Published online May 20, 2022. doi: 10.5662/wjm.v12.i3.148
Peer-review started: December 22, 2021
First decision: February 8, 2022
Revised: February 27, 2022
Accepted: April 24, 2022
Article in press: April 24, 2022
Published online: May 20, 2022
Processing time: 147 Days and 2.3 Hours
This study evaluates the American Thyroid Association (ATA) ultrasound (US) classification system for the initial assessment of thyroid nodules to determine if it indeed facilitates clinical decision-making.
To perform a systematic review and meta-analysis of the diagnostic value of the ATA US classification system for the initial assessment of thyroid nodules.
In accordance with the PRISMA statement for diagnostic test accuracy, we selected articles that evaluated the 2015 ATA US pattern guidelines using a diagnostic gold standard. We analyzed these cases using traditional diagnostic parameters, as well as the threshold approach to clinical decision-making and decision curve analysis.
We reviewed 13 articles with 8445 thyroid nodules, which were classified according to 2015 ATA patterns. Of these, 46.62% were malignant. No cancer was found in any of the ATA benign pattern nodules. The Bayesian analysis post-test probability for cancer in each classification was: (1) Very-low suspicion, 0.85%; (2) Low, 2.6%; (3) Intermediate, 6.7%; and (4) High, 40.9%. The net benefit (NB), expressed as avoided interventions, indicated that the highest capacity to avoid unnecessary fine needle aspiration biopsy (FNAB) in the patterns that we studied was 42, 31, 35, and 43 of every 100 FNABs. The NB calculation for a probability threshold of 11% for each of the ATA suspicion patterns studied is less than that of performing FNAB on all nodules.
These three types of analysis have shown that only the ATA high-suspicion diagnostic pattern is clinically useful, in which case, FNAB should be performed. However, the curve decision analysis has demonstrated that using the ATA US risk patterns to decide which patients need FNAB does not provide a greater benefit than performing FNAB on all thyroid nodules. Therefore, it is likely that a better way to approach the assessment of thyroid nodules would be to perform FNAB on all non-cystic nodules, as the present analysis has shown the ATA risk patterns do not provide an adequate clinical decision-making framework.
Core Tip: There is no analysis that evaluates the real diagnostic value of the 2015 American Thyroid Association thyroid nodule risk patterns and their usefulness for clinical decision-making; thus, we undertook this study to quantify both values.
- Citation: Hurtado-Lopez LM, Carrillo-Muñoz A, Zaldivar-Ramirez FR, Basurto-Kuba EOP, Monroy-Lozano BE. Assessment of diagnostic capacity and decision-making based on the 2015 American Thyroid Association ultrasound classification system. World J Methodol 2022; 12(3): 148-163
- URL: https://www.wjgnet.com/2222-0682/full/v12/i3/148.htm
- DOI: https://dx.doi.org/10.5662/wjm.v12.i3.148
Many decisions in medicine involve trade-offs, such as weighing the balance between diagnosing patients with disease vs the cost of unnecessary additional testing for those who are healthy[1]. The traditional biostatistical approach to evaluating tests focuses on accuracy, evaluating calibration and discrimination, as well as using metrics such as sensitivity, specificity, or area under the curve (AUC). These methods have several advantages: They are mathematically simple, can be used for binary or continuous predictors, and are relatively easy to interpret. However, their clinical relevance is low, because there is no way to correctly discriminate between two or more diagnostic tests when there are differences in sensitivity or specificity among them. Furthermore, they do not take into consideration the consequences of the decisions made[2,3]. To address these issues, analytical methods for decision-making have been developed, which explicitly take into consideration the clinical consequences of decisions. They provide data about the clinical value of tests, including either the risks associated with an incorrect diagnosis, or the benefits of a correct diagnosis, and so can determine whether or not these tests should be used to guide decisions regarding patient care[4].
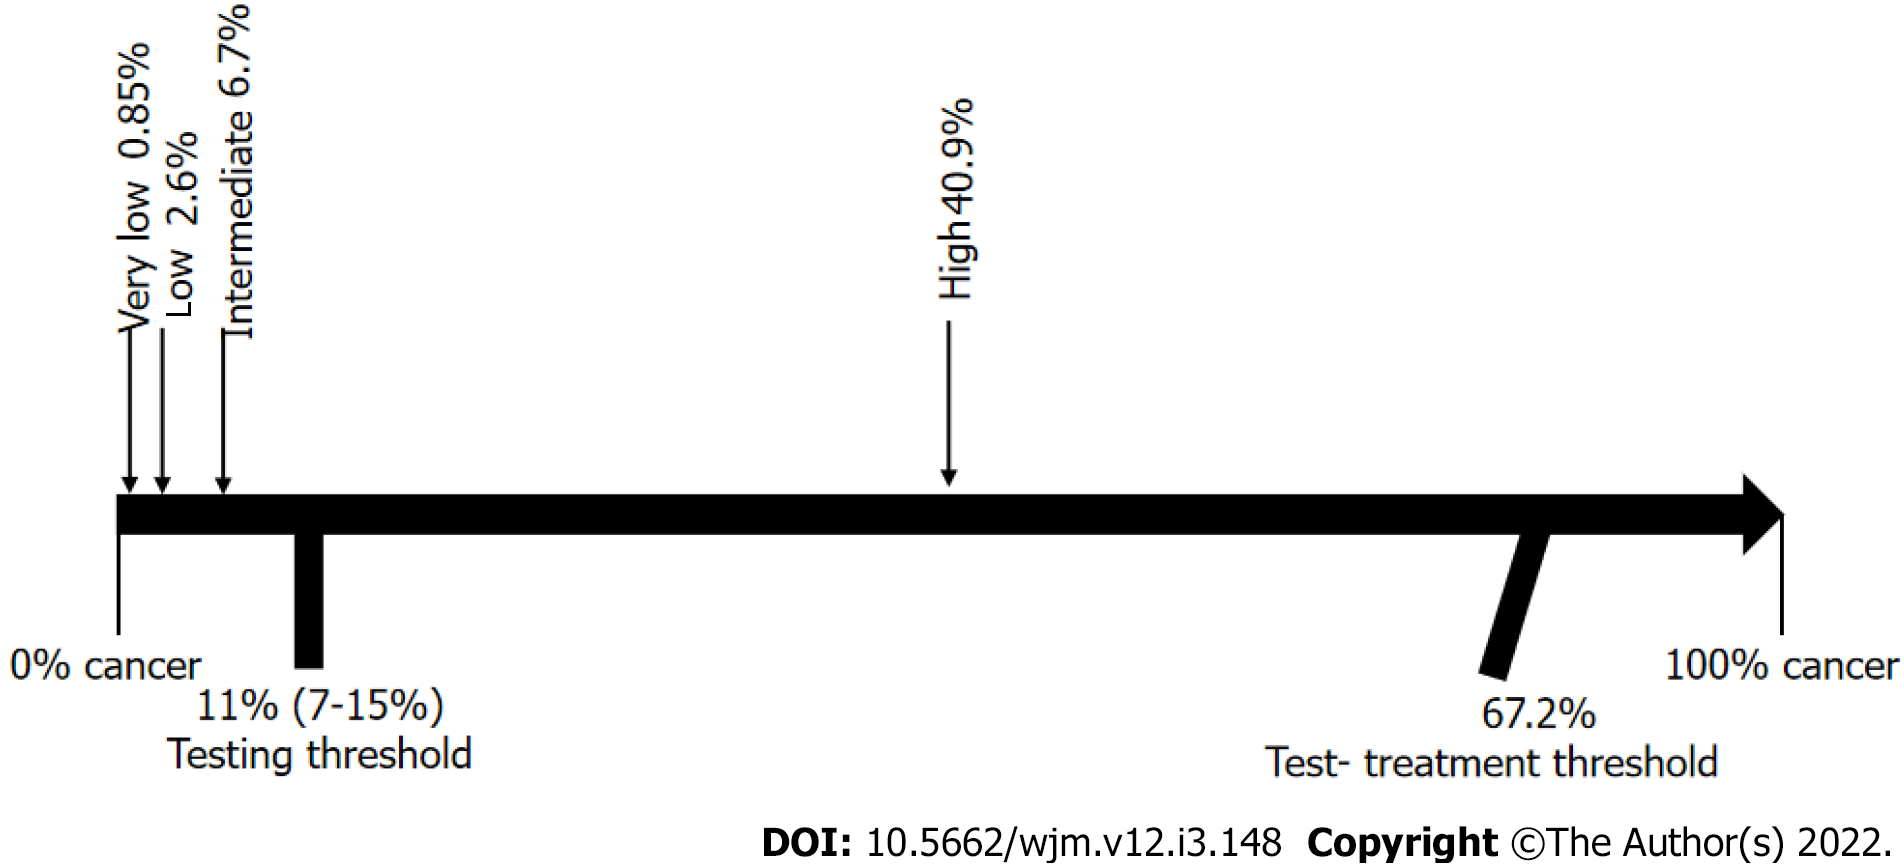
Ideally, the results of a diagnostic test should help physicians make a clear decision, meaning that, upon testing, we would either move from an epidemiological probability that a disease is present (testing threshold) to a lesser probability, and subsequent ruling out of the disease; or, on the contrary, the results could increase the probability to levels above the test-treatment threshold, and hence, point directly to treatment. However, sometimes the change in probability is higher than the testing threshold, but lower than the test-treatment threshold, in which case, the initial diagnostic test does not provide enough certainty to support decision-making regarding treatment, and additional diagnostic testing would therefore be required. This analytical process of diagnostic testing is known as “the threshold approach to clinical decision-making”[5,6] and it provides a clear, objective, and rational method to determine whether additional diagnostic testing is needed or not (Figure 1).
The sensitivity and specificity of a test cannot be used alone to estimate the probability of disease in a patient, but the two parameters when combined into one measure, called the likelihood ratio, may be used in conjunction with disease prevalence to estimate an individual patient's probability of having disease. This probability can then be transformed into a post-test probability through Bayesian analysis, and this post-test probability, when applied to the threshold approach to clinical decision-making, can then show us the true utility of a diagnostic test[7-9].
Another method for clinical decision-making is decision curve analysis[2,10,11]. This method calculates a clinical “net benefit” for a diagnostic test vs treating all or no patients, across a range of threshold probabilities, defined as “the minimum probability of disease at which further intervention would be warranted”. The net benefit, unlike accuracy metrics such as discrimination and calibration, incorporates the consequences of the decisions that were made based on the results of a diagnostic test. Therefore, if you look at the net benefit of a range of reasonable threshold probabilities (Pt) for any given intervention and, if your test has a high net benefit across the whole range, you can say that your test can help you to make an adequate decision regarding that intervention. It is clear, then, that if we use analytical methods for clinical decision-making, in addition to traditional diagnostic testing, we will have a better understanding and clinical use of the diagnostic test results.
In the context of thyroid nodule assessment, the role of ultrasound (US) has historically been very important. It was initially used only to identify the thyroid nodule and guide fine needle aspiration biopsy (FNAB), and later, it was further developed to identify nodule characteristics that would help differentiate between benign and malignant lesions, such as internal calcifications, hypoechoicity, increased central blood flow, infiltrative margins, taller than wider shape, absence of halo, solid nodule, and nodule size[12,13]. However, various meta-analyses have shown that none of these characteristics alone can differentiate with certainty between benign and malignant lesions[14-16].
The 2015 American Thyroid Association (ATA) Management Guidelines for Adult Patients with Thyroid Nodules and Differentiated Thyroid Cancer[17] reengineered these images, and, taking advantage of the practical aspects of US (non-invasive and readily accessible), described five sonographic patterns to establish the risk of malignancy: (1) Benign US features consist of purely cystic nodules, with no solid component, with an estimated risk of malignancy < 1%; (2) Very-low suspicion US features consist of spongiform or partially cystic nodules without any of the sonographic features described in low, intermediate, or high suspicion patterns, with an estimated risk of malignancy < 3%; (3) Low suspicion US features consist of isoechoic or hyperechoic solid nodule, or partially cystic nodule with eccentric solid areas, without microcalcification, irregular margin or extra thyroidal extension (ETE), or taller than wide shape, with an estimated risk of malignancy of 5%-10%; (4) Intermediate suspicion US features consist of hypoechoic solid nodule with smooth margins without microcalcifications, ETE, or taller than wide shape, with an estimated risk of malignancy of 10-20%; and (5) High suspicion US features consist of solid hypoechoic nodule or solid hypoechoic component of a partially cystic nodule with one or more of the following features: Irregular margins (infiltrative, microlobulated), microcalcifications, taller than wide shape, rim calcifications with small extrusive soft tissue component, evidence of ETE, with an estimated risk of malignancy between 70%-90%.
Based on these US descriptions and the size of the thyroid nodule, the ATA’s intention is to standardize diagnostic behavior, from performing FNAB to simply keeping the thyroid nodule under observation, and the ATA patterns provide a clear and simple guideline to follow.
However, in the development of these US patterns, the origins of the percentages of malignancy suspicion assigned to each pattern is not clear, nor is the diagnostic accuracy of each pattern.
Several papers which have been published to date, both retrospective and prospective, have attempted to validate the risk patterns indicated in the ATA guidelines. These papers have shown similar findings in terms of malignancy rates in the categories of very low, low, and intermediate suspicion, although not in high suspicion, which have generally been found to be a lower percentage[18-40]. However, these studies only calculated the risk as a simple percentage and did not consider the diagnostic value in a clinical setting, which must be clearly established prior to decision-making.
Therefore, the objective of this study was to determine the real diagnostic value of the ATA classification system and to determine whether clinical decision-making based on this classification leads to an optimal management of thyroid nodules.
We made a systematic review of the published literature related to the American Thyroid Association US classification system for the initial assessment of thyroid nodules[17] from 2016 to date.
Data extraction was performed in accordance with the PRISMA statement for Diagnostic Test Accuracy Studies[41] and by searching PubMed-Medline for all articles published in the English language with the keywords: Thyroid nodule, thyroid, ultrasound, US, ultrasonography, and 2015 ATA. Related articles suggested by PubMed were also retrieved. Bibliographies of retrieved articles were searched independently and checked for additional studies.
Our criteria for eligibility were articles that clearly reported data related to the US patterns described in the ATA 2015 guidelines[17] and where the diagnosis of malignant or benign had been established either by histology reports, or two benign FNAB results.
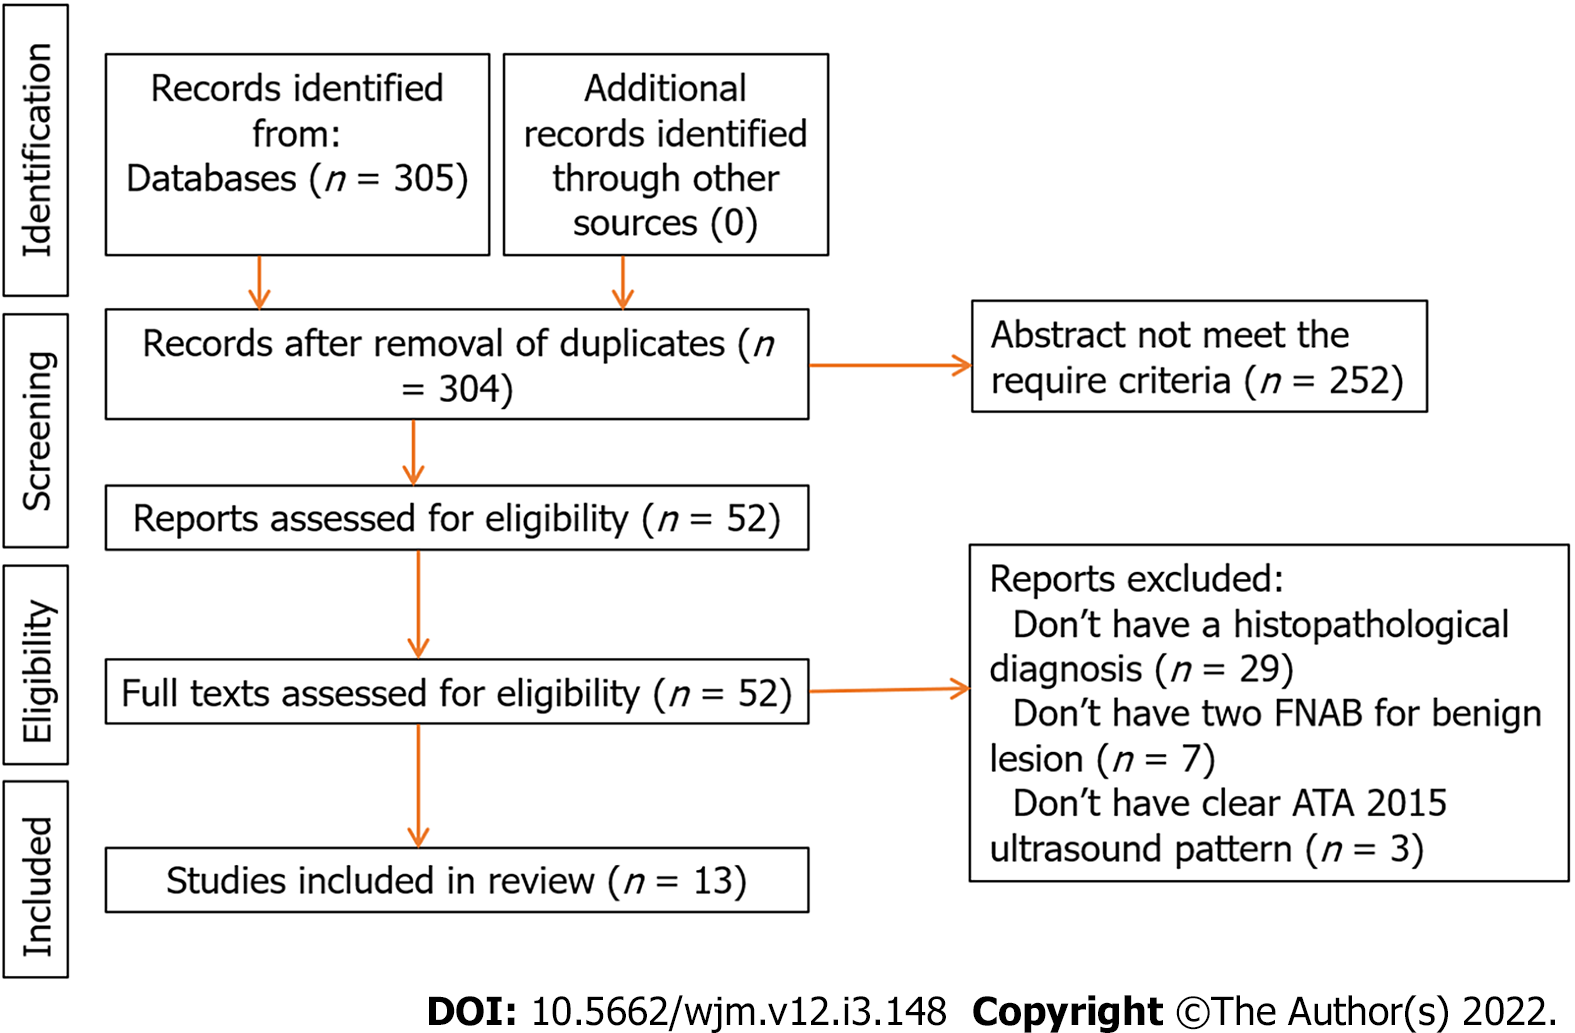
Two authors (LMHL and ACM) independently reviewed the articles and established the criteria for inclusion in the pooled data analysis, with disagreements resolved through discussion. Characteristics of the included and excluded articles are presented in Figure 2.
Methodologic quality was assessed using the QUADAS-2 (Quality Assessment of Diagnostic Accuracy Studies 2) criteria[42]. Both reviewers (LMHL and ACM) scored the 7-item tool independently and disagreements were resolved by consensus (among LMHL, ACM, and FRZR) via a face-to-face discussion about each disagreement (Table 1).
| Ref. | Risk of bias | Flow and timing | Applicability | ||||
| Patient selection | Index test | Reference standard | Patient selection | Index test | Reference standard | ||
| Tang et al[25] | Low | Low | Low | Low | Low | Low | Low |
| Trimboli et al[28] | Low | Low | Low | Unclear | Low | Low | Low |
| Xu et al[29] | Low | Low | Low | Low | Low | Low | Low |
| Persichetti et al[30] | Low | Low | Low | Low | Low | Low | Low |
| Macedo et al[31] | Low | Low | Low | Low | Low | Low | Low |
| Chng et al[32] | Unclear | Unclear | Low | Low | High | Low | Low |
| Huang et al[34] | Low | Low | Low | Unclear | Low | Low | Low |
| Barbosa et al[35] | Unclear | Low | Low | Low | High | Low | Low |
| Hong et al[36] | Low | Low | Low | Low | Low | Low | Low |
| Valderrabano et al[37] | Low | Low | Low | Low | Low | Low | Low |
| Xiang et al[38] | Low | Low | Low | Low | Low | Low | Low |
| Gao et al[39] | Low | Low | Low | Low | Low | Low | Low |
| Shen et al[40] | Low | Low | Low | Low | Low | Low | Low |
We used the Meta-DiSc, version 1.4 software (Ramon y Cajal Hospital, Madrid, Spain) in our meta-analysis[43]. The Mantel-Haenszel method of the random-effect model was used to calculate pooled sensitivity and specificity with corresponding 95% confidence intervals.
We analyzed these cases first using traditional diagnostic parameters and then the threshold approach to clinical decision-making and decision curve analysis.
To perform the threshold approach to clinical decision-making, it is important to understand that the indifference point for the choice between withholding therapy and performing a diagnostic test is a probability of disease designated here as the "testing" threshold (Tt). The indifference point for the choice between performing the diagnostic test and administering treatment is a probability of disease designated here as the "test-treatment" threshold (Ttrx).
Because the thresholds define these two indifference points, the physician can be guided by the calculated thresholds and estimated probability of disease in a given patient. As illustrated in Figure 1, the best choices are to withhold both treatment and the test if the probability of disease is smaller than the testing threshold, to administer treatment without testing if the probability of disease is greater than the test-treatment threshold, and to perform the test only if the probability of disease falls between the two thresholds.
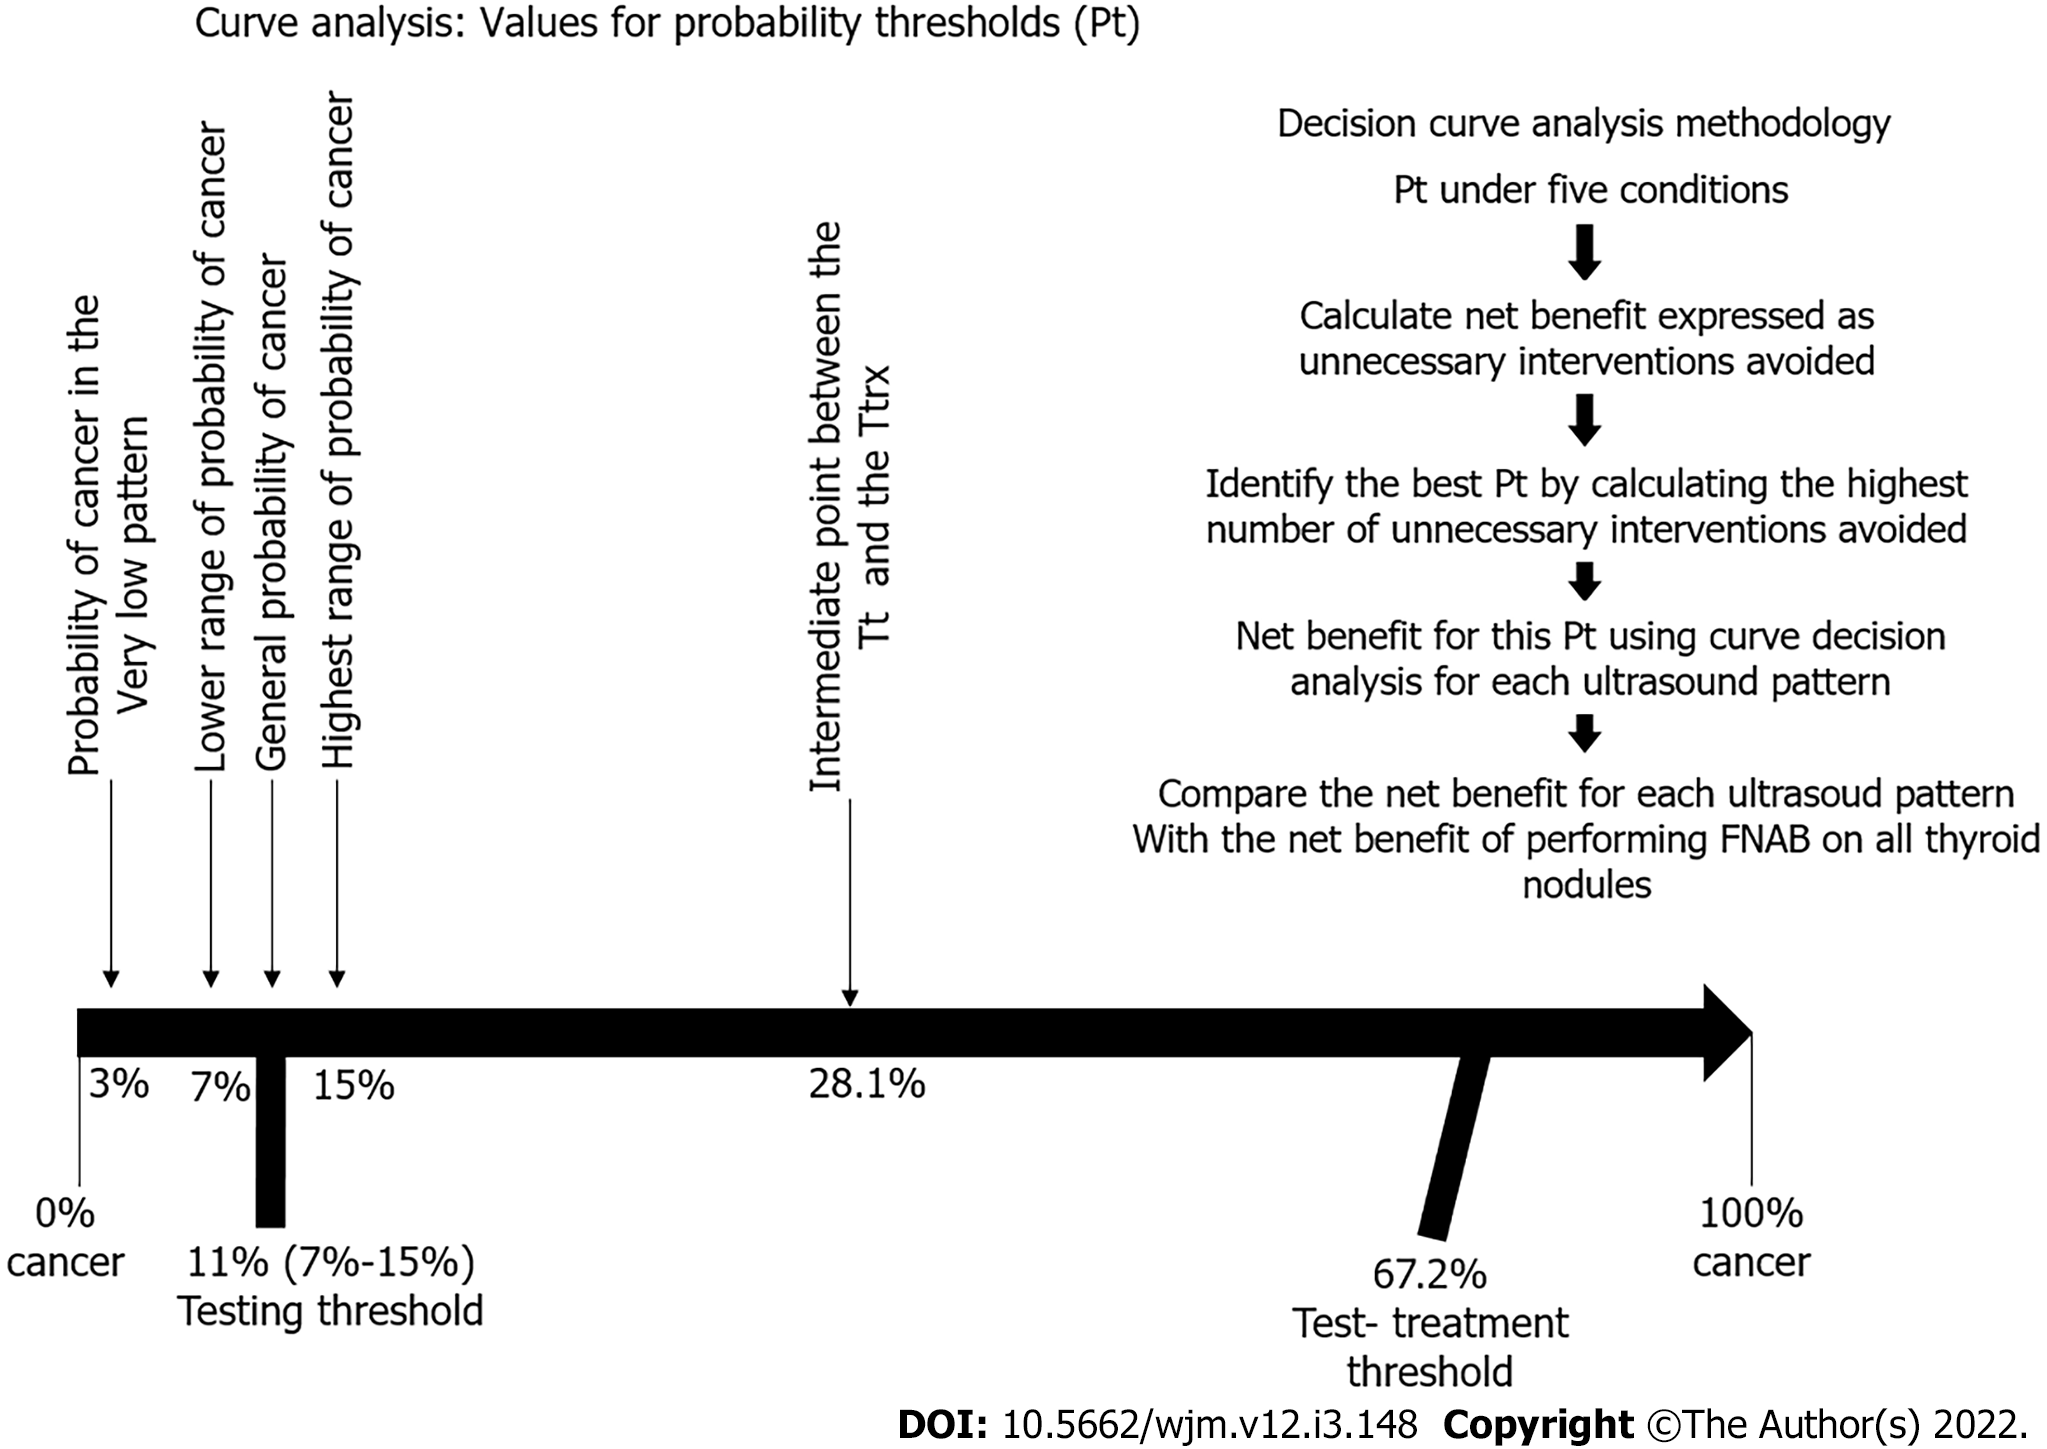
The threshold levels were developed as follows[5]: The Tt consisted of the frequency of thyroid cancer, as reported in the 1015 ATA guidelines[17], estimated to be between 7% and 15%, making an average frequency of 11%.
For the Ttrx, we used the formula described by Pauker et al[5] shown in Figure 3. Using this formula, we estimated the Brx at 20% considering that the survival rate of a patient with papillary thyroid cancer is 98% with an early diagnosis, and 78% when there has been distant metastases[17,44]; Rrx at 4.2% when calculating an overall average rate of morbidity in total thyroidectomies, including permanent injury of the recurrent laryngeal nerve[45-47], injury to the external branch of the upper laryngeal nerve[48,49], hypoparathyroidism[50-53], and hematoma[54,55]; Rt at zero, as performing an US does not expose the patient to any risk; Pneg/nd at 0.98, representing true negatives, calculated based on US patterns[17] for benign and very low suspicion; and Pneg/d at 0.10 representing false negatives, as high-suspicion patterns detect 90% of cancers[17]. The resulting Ttrx was 67.2%.
To perform the decision curve analysis, the value for probability threshold (Pt), defined as the minimum probability of disease at which further intervention would be warranted[2,10], is a clinical judgement, and was calculated under five conditions: The first was set by simply identifying the general probability of cancer in a thyroid nodule, which is 11%, according to the ATA. The second was set to 28.1%, by taking an intermediate point between the Tt (11%) and the Ttrx (67.2%). The third condition was set to 3%, which is the probability of cancer in the very low pattern. The fourth condition was set to 7%, which is the lower range of probability of cancer according to the 2015 ATA guidelines. The fifth condition was set to 15%, which is the highest range of probability of cancer according to the 2015 ATA guidelines. We used these five Pt to calculate the net benefit of each ATA US risk pattern.
We calculated the net benefit, expressed as the number of unnecessary interventions avoided, in this case the number of FNABs avoided, using true negatives rather than true positives, and using the following formula: Net benefit for unnecessary interventions = (true negative count/total number of patients) – (false positive count/total number of patients) × (Pt /(1- Pt) in order to determine the number of unnecessary biopsies that had been performed, without missing any patients with cancer, in each of the ATA US patterns. We calculated these in all five possible Pt[10,11].
Once we were able to determine the best Pt by calculating the highest number of unnecessary FNABs avoided, we then calculated the net benefit for this Pt using curve decision analysis for each US pattern, using the following formula: Net benefit = (true positive count/total number of patients) – (false-positive count/total number of patients) × (Pt/1-Pt). This result would then be compared with the net benefit of performing FNAB on all thyroid nodules (Figure 4).
The resulting net benefit for each US pattern would have to be of greater value than the net benefit of performing FNAB on all thyroid nodules for it to be considered a diagnostic model that provides the correct identification of those thyroid nodules which can be safely excluded from FNAB.
We extracted the information, grouped it by author, and added all the cases together, obtaining sensitivity, specificity, and positive and negative predictive values for each of the categories. We determined the Youden's index using the following formula: Sensitivity + (specificity -1); and the positive likelihood ratio (LR) using the following formula: Sensitivity/(1-specificity). We then calculated post-test odds with Bayesian analysis using the following formula: Post-test odds = pretest odds × LR, and, in the final step, we converted the post-test odds into post-test probability.
Due to the design of this study, approval by an institutional review board was not required.
Our initial search retrieved 305 articles, and the summaries were reviewed by two authors (LMHL and ACM) to select those that met the required criteria. This resulted in 52 articles that we reviewed in their full text, before finally selecting 13 articles[25,28,29-32,34-40] which contained the required information in accordance with the design of the study. Nine were retrospective studies[28,29,32-37,39,40] and four were prospective studies[25,30,31,38] (Table 2 and Figure 3).
| Ref. | Very low | Low | Intermediate | High | ||||
| Cancer no | Cancer yes | Cancer no | Cancer yes | Cancer no | Cancer yes | Cancer no | Cancer yes | |
| Tang et al[25] | 7 | 1 | 20 | 5 | 17 | 7 | 0 | 8 |
| Trimboli et al[28] | 15 | 2 | 43 | 8 | 68 | 15 | 6 | 18 |
| Xu et al[29] | 36 | 2 | 190 | 21 | 212 | 59 | 109 | 277 |
| Persichetti et al[30] | 134 | 3 | 255 | 8 | 295 | 18 | 104 | 127 |
| Macedo et al[31] | 11 | 0 | 10 | 0 | 13 | 5 | 1 | 5 |
| Chng et al[32] | 16 | 1 | 60 | 10 | 18 | 12 | 13 | 27 |
| Huang et al[34] | 14 | 0 | 109 | 18 | 57 | 32 | 4 | 15 |
| Barbosa et al[35] | 4 | 1 | 33 | 10 | 27 | 9 | 10 | 46 |
| Hong et al[36] | 35 | 0 | 174 | 6 | 109 | 55 | 37 | 263 |
| Valderrabano et al[37] | 25 | 0 | 127 | 32 | 61 | 13 | 16 | 20 |
| Xiang et al[38] | 170 | 0 | 112 | 24 | 8 | 11 | 32 | 289 |
| Gao et al[39] | 178 | 0 | 339 | 20 | 107 | 55 | 233 | 1606 |
| Shen et al[40] | 187 | 6 | 149 | 17 | 348 | 42 | 150 | 708 |
| Total | 832 | 16 | 1621 | 179 | 1340 | 333 | 715 | 3409 |
The data from 8445 thyroid nodules was obtained, of which 3937 (46.62%) were malignant and 4508 (53.38%) were benign. The average size of the tumors was 18.5 mm (5 mm to 71 mm).
When grouping the nodules into risk patterns, we found that the benign pattern was reported in only 6 of the 13 articles[30,32,34,36,39,40], for a total of 62 nodules in the category, and all of these corresponded to histopathologically benign nodules, therefore we decided to exclude this pattern from our analysis.
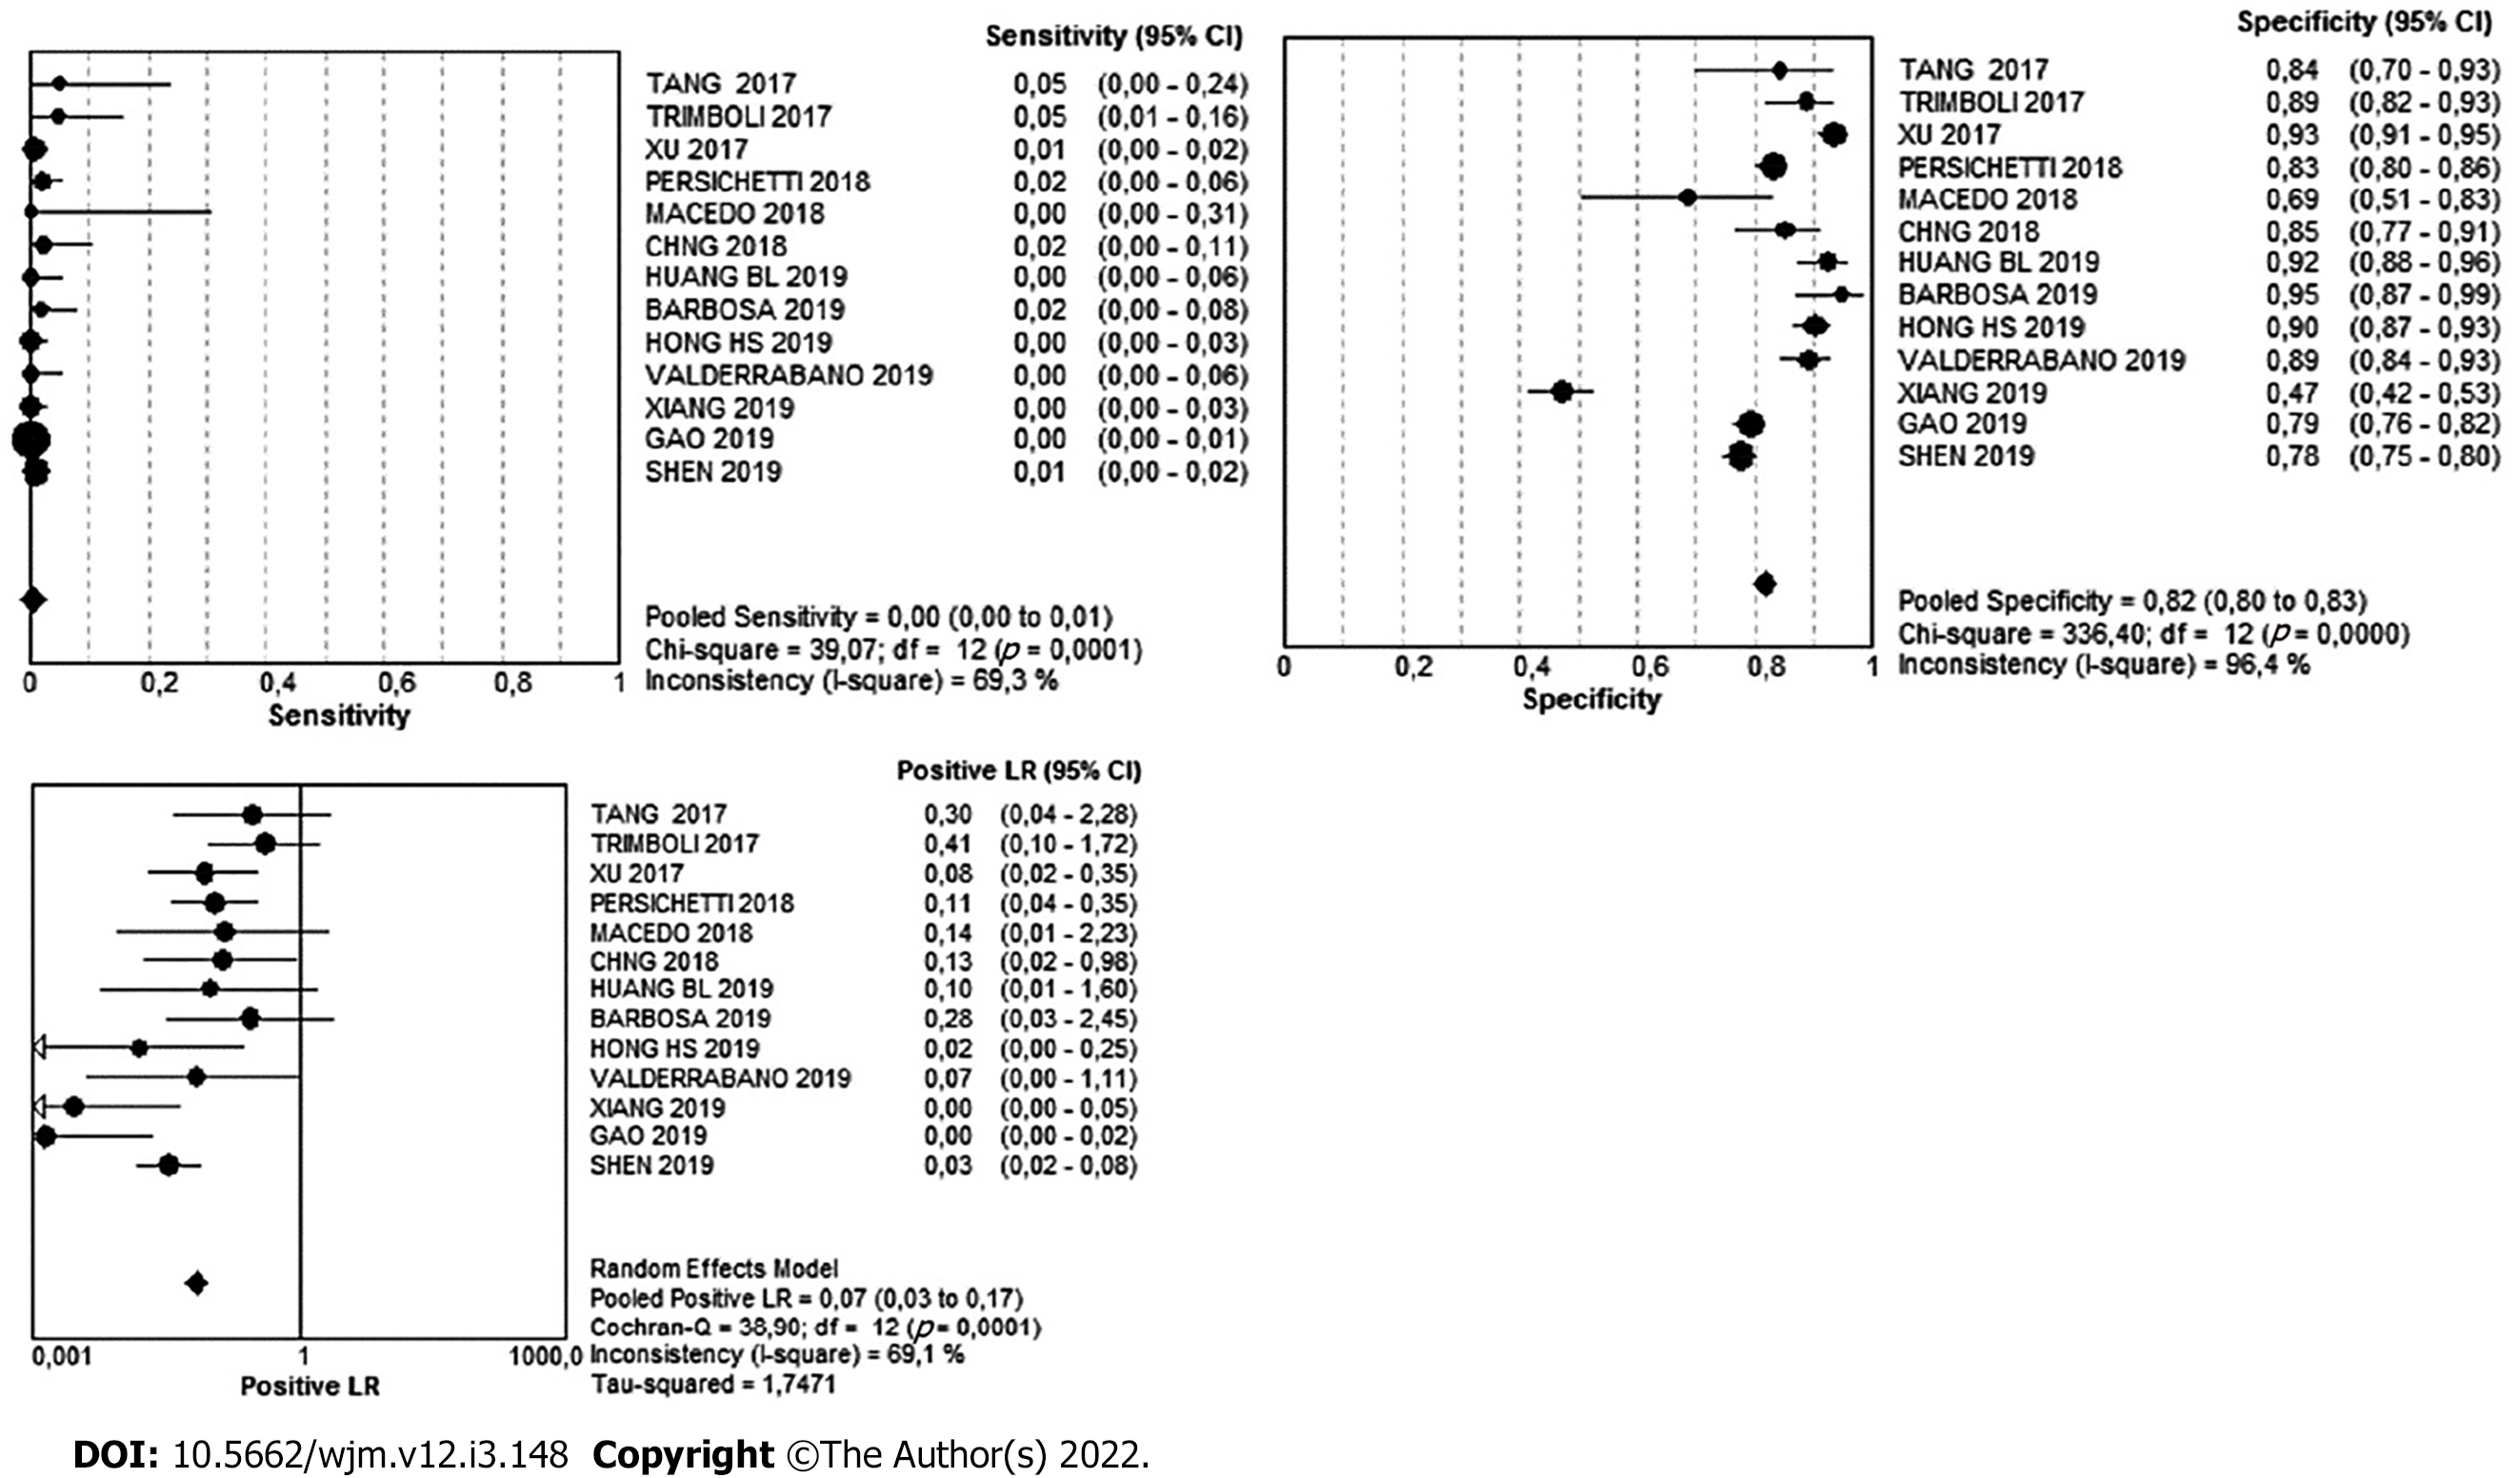
For the very-low suspicion pattern, there were a total of 848 cases. Of these, 832 were benign and 16 were malignant, meaning that in this pattern, the simple percentage of malignancy was 1.8%. The Youden's index was -0.18. The diagnostic value can be found in Table 3 and Figure 5.
| Very Low | 95%CI | Low | 95%CI | Intermediate | 95%CI | High | 95%CI | |
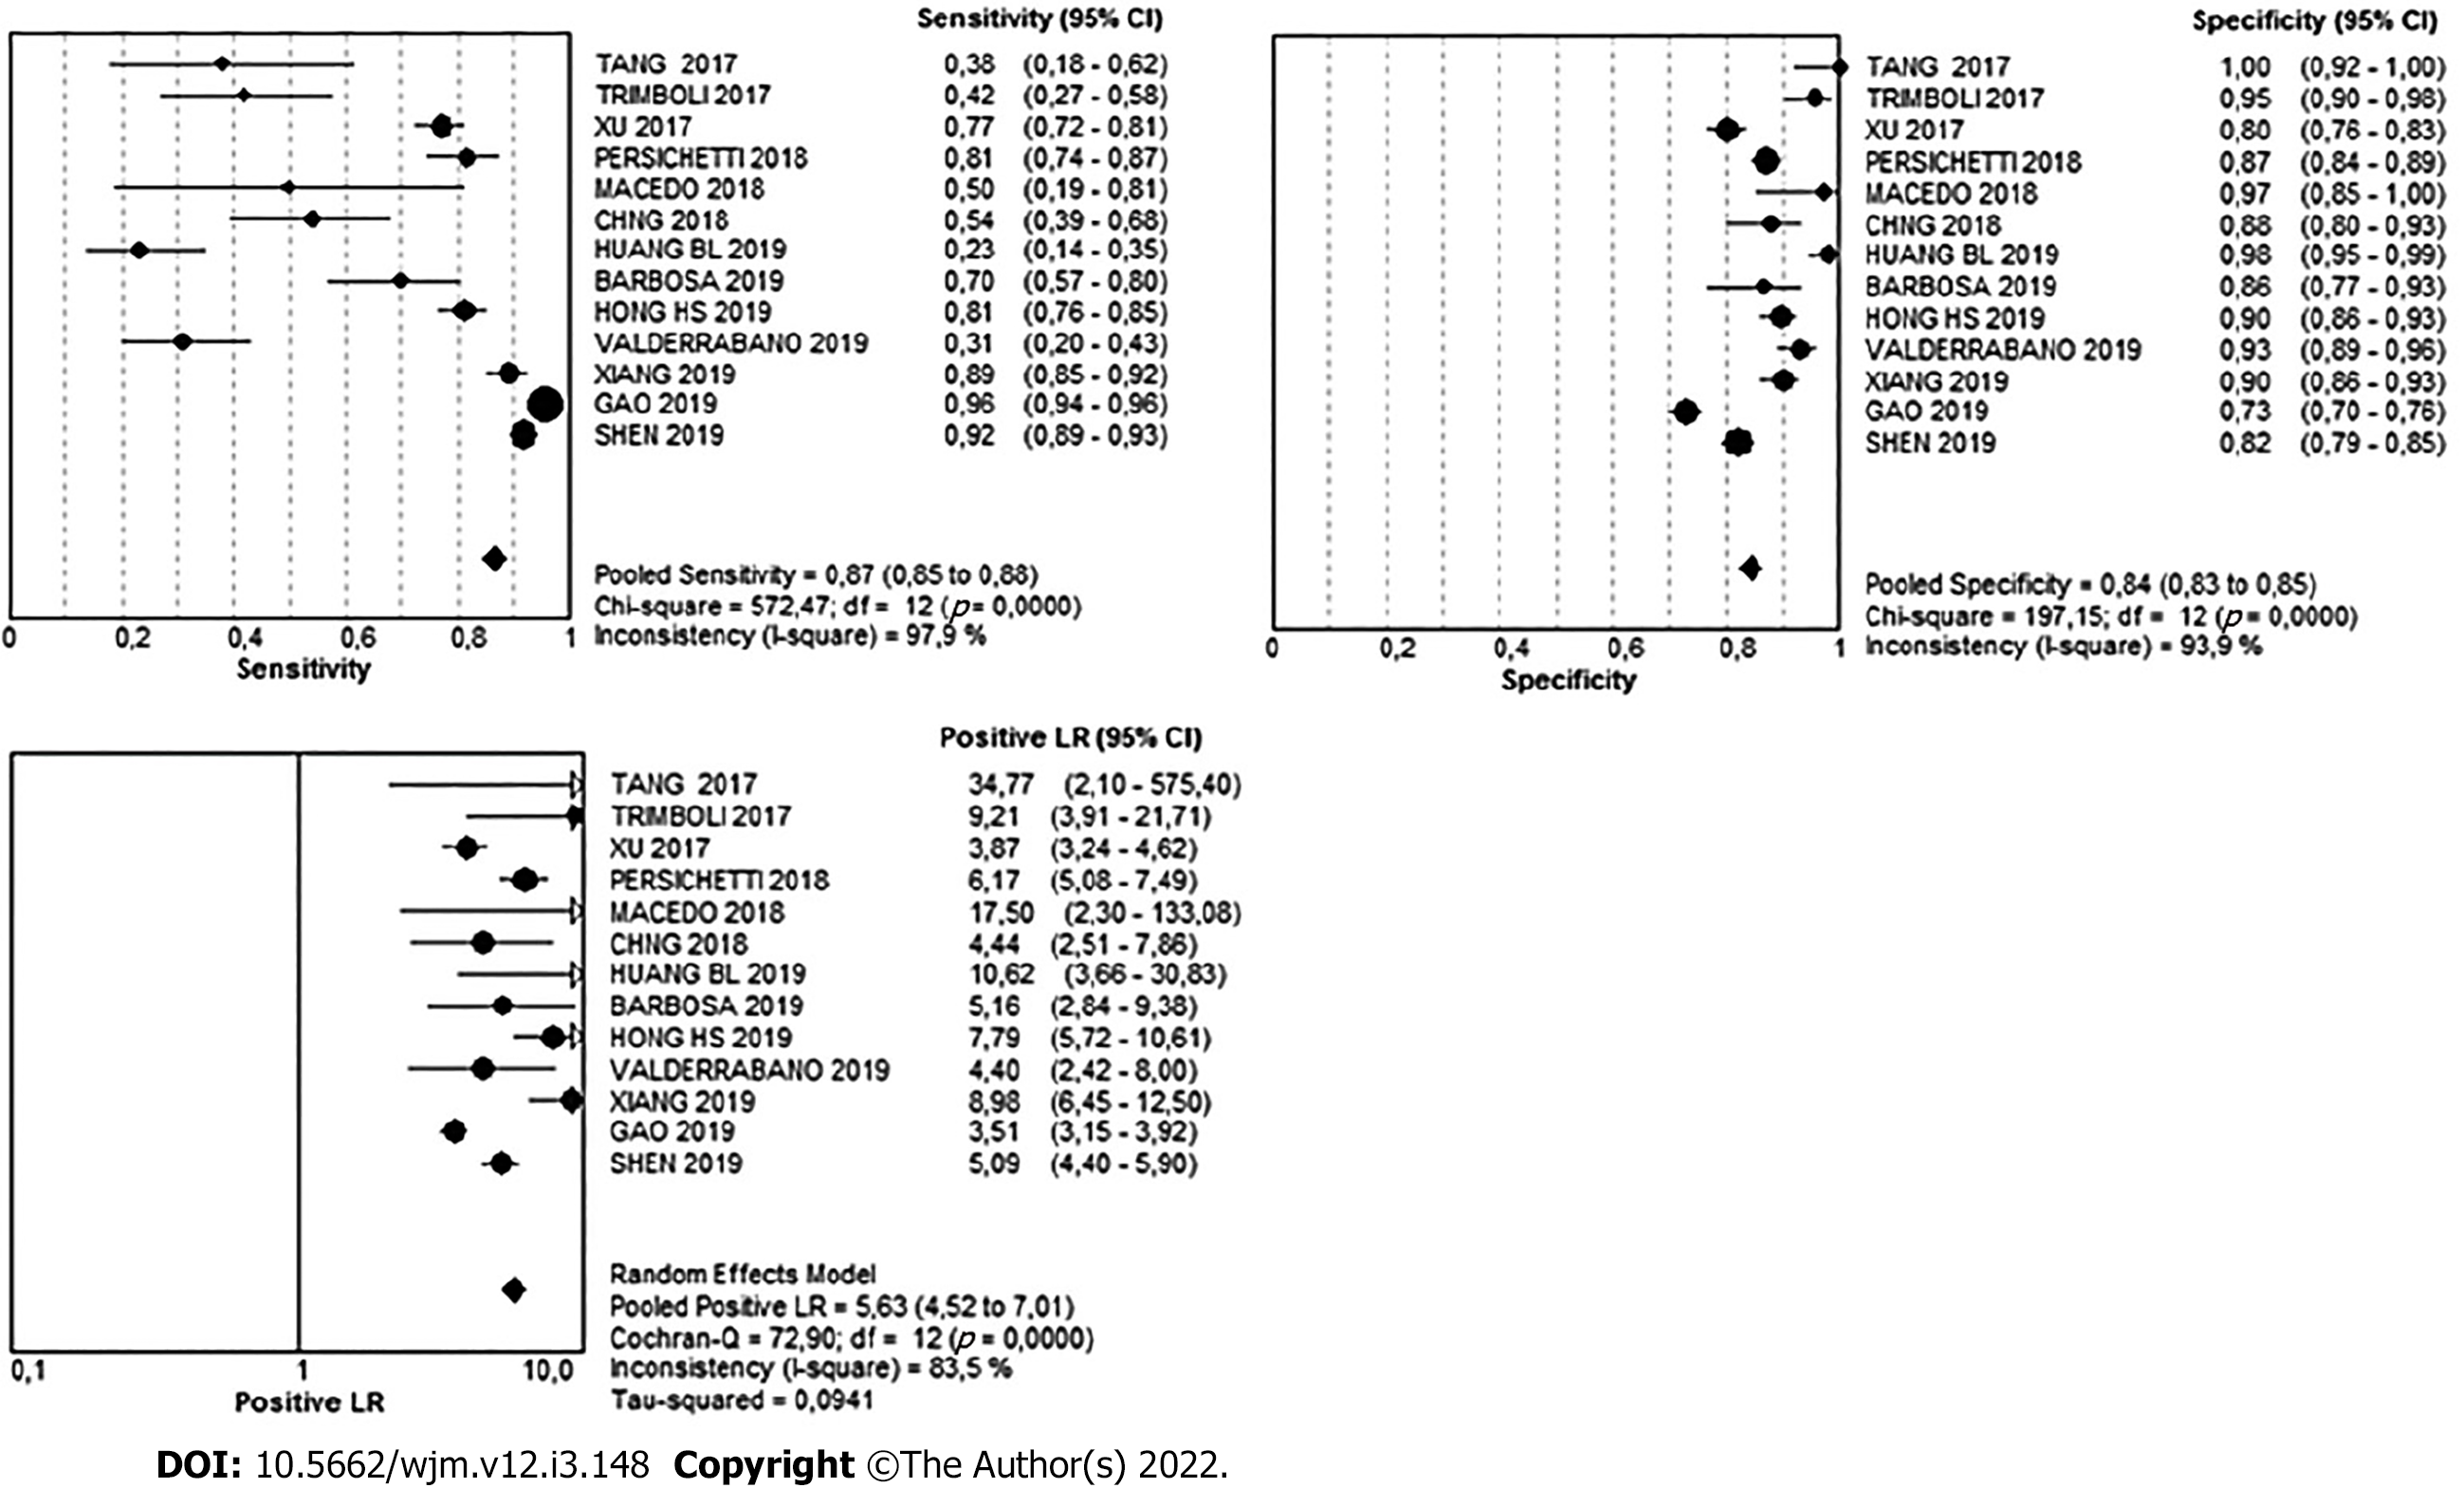
| Sensitivity | 1% | 0-1 | 5% | 4-5 | 8% | 8-9 | 87% | 85-88 |
| Specificity | 82% | 80-83 | 64% | 63-65 | 70% | 68-72 | 84% | 83-85 |
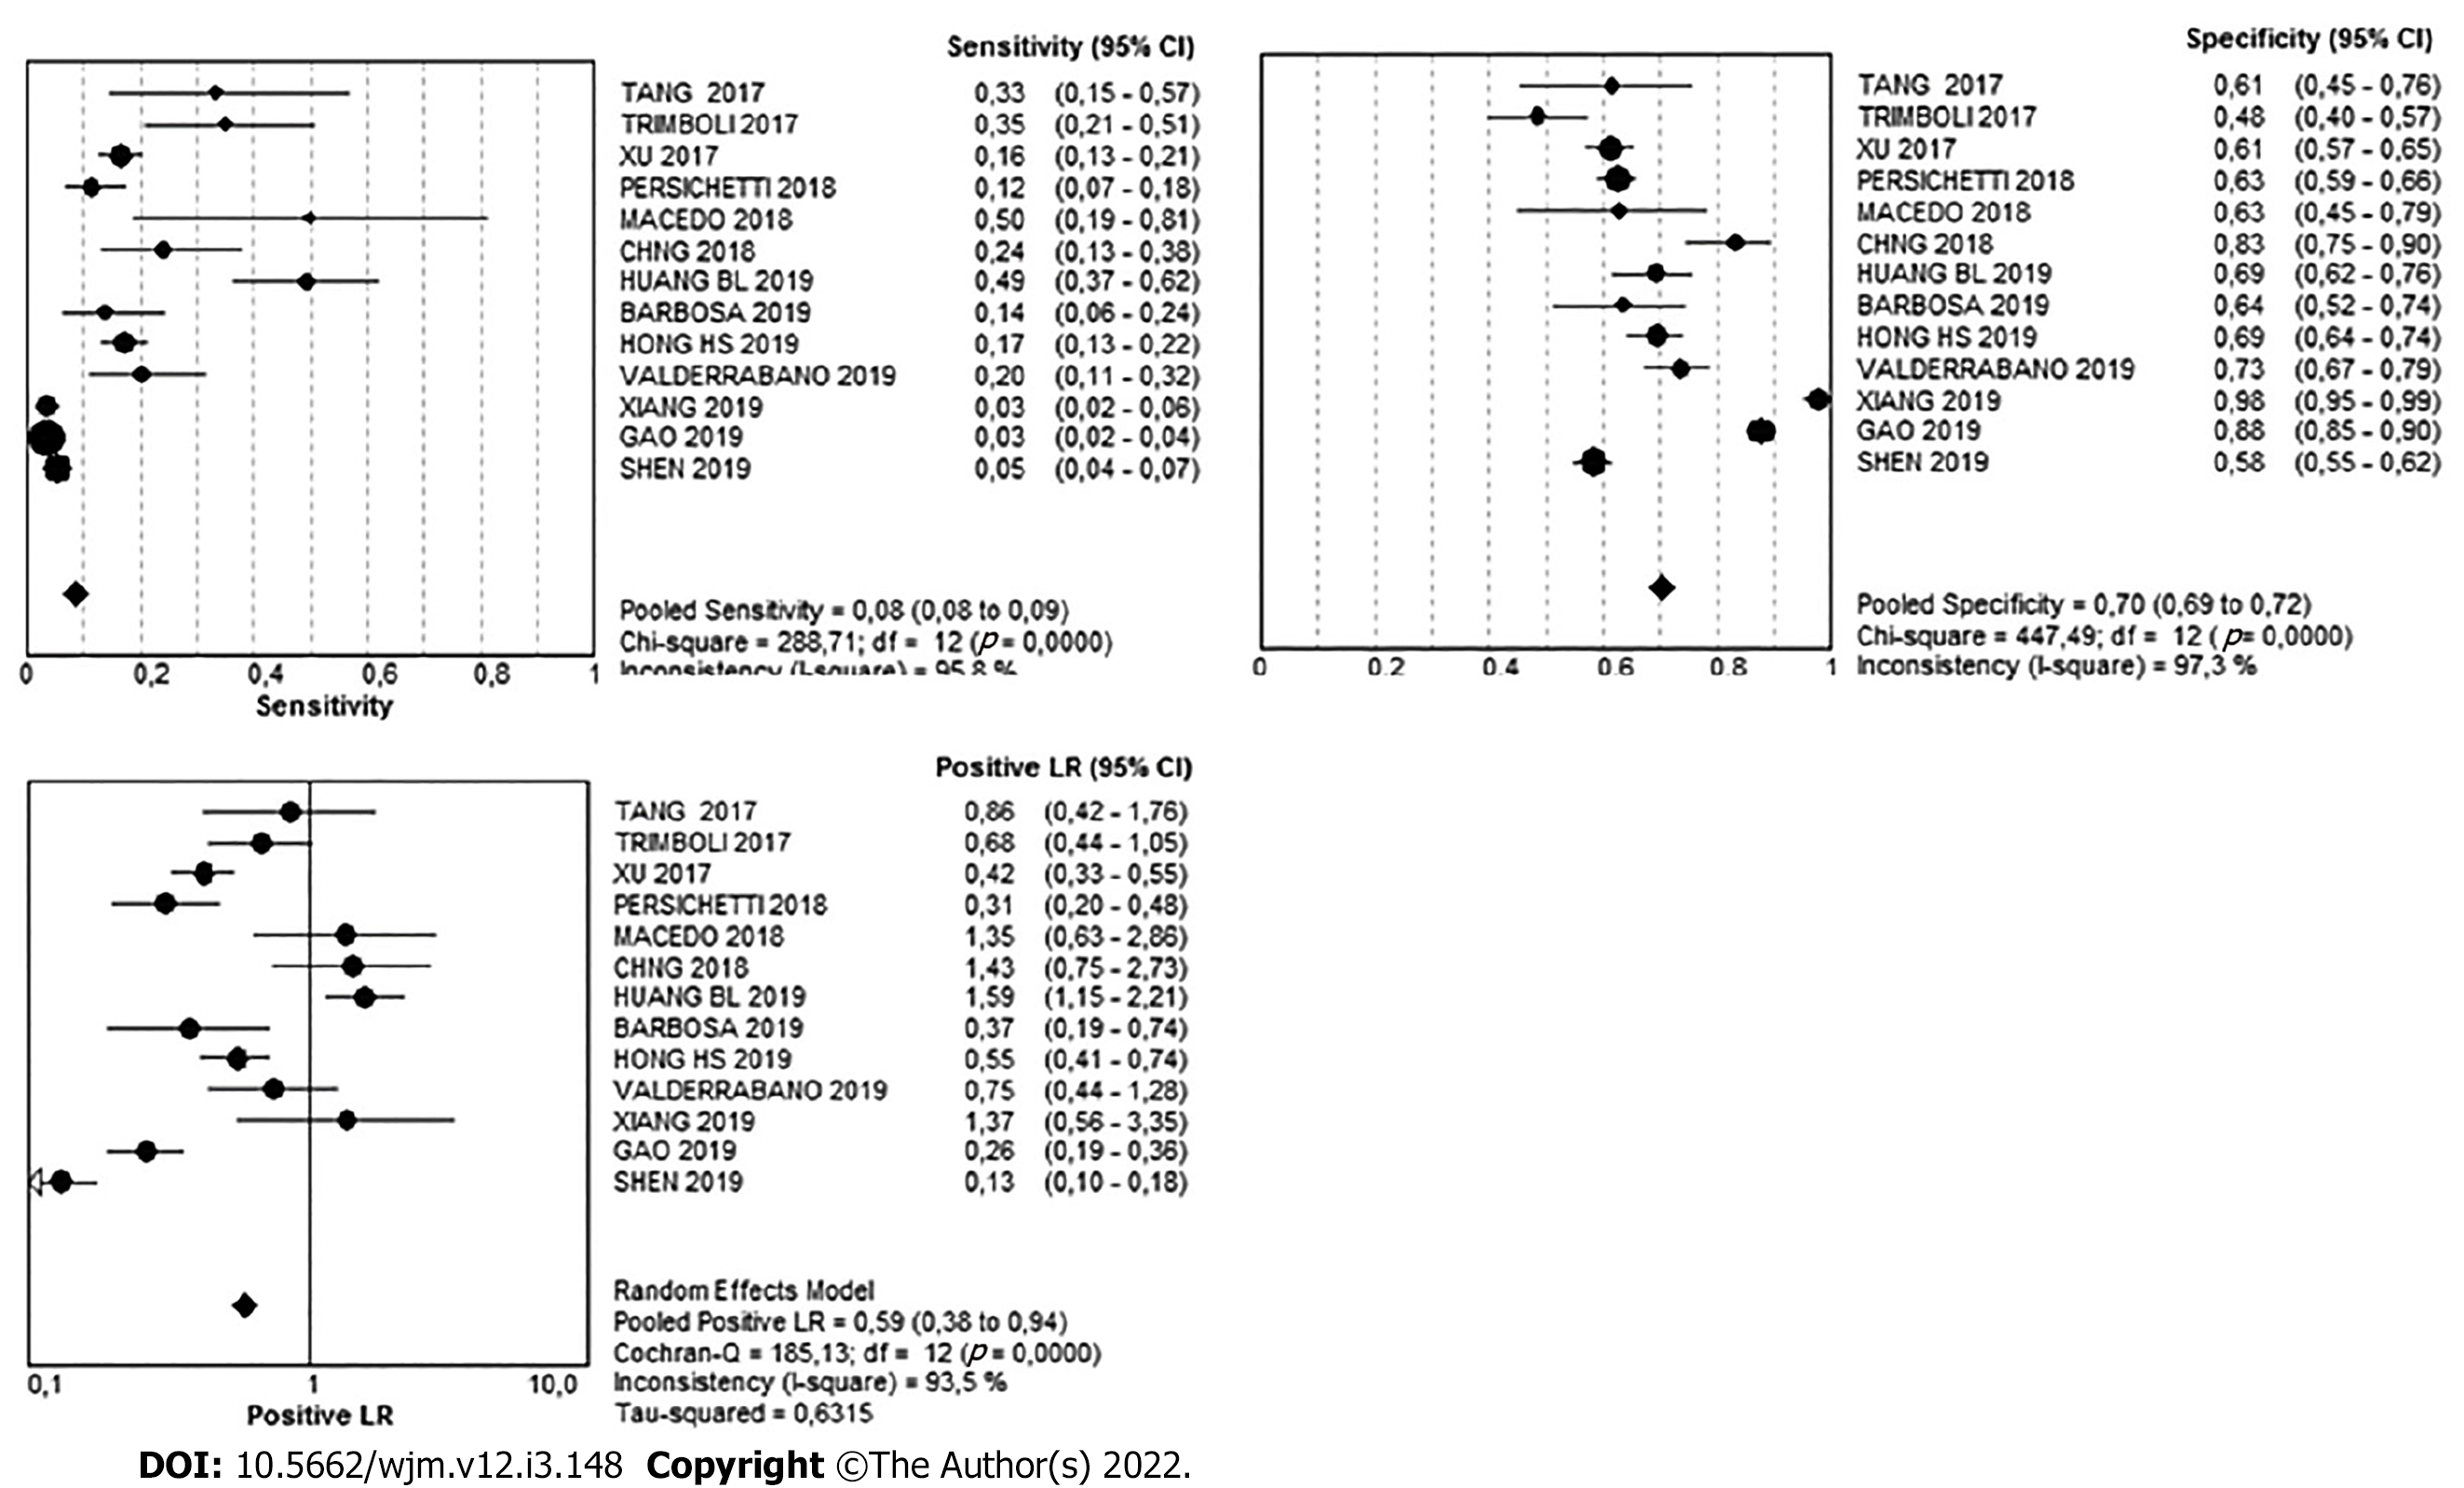
| Likelihood ratio (+) | 0.07 | 0.03- 0.17 | 0.22 | 0.11-0.43 | 0.59 | 0.38-0.94 | 5.63 | 4.52-7.01 |
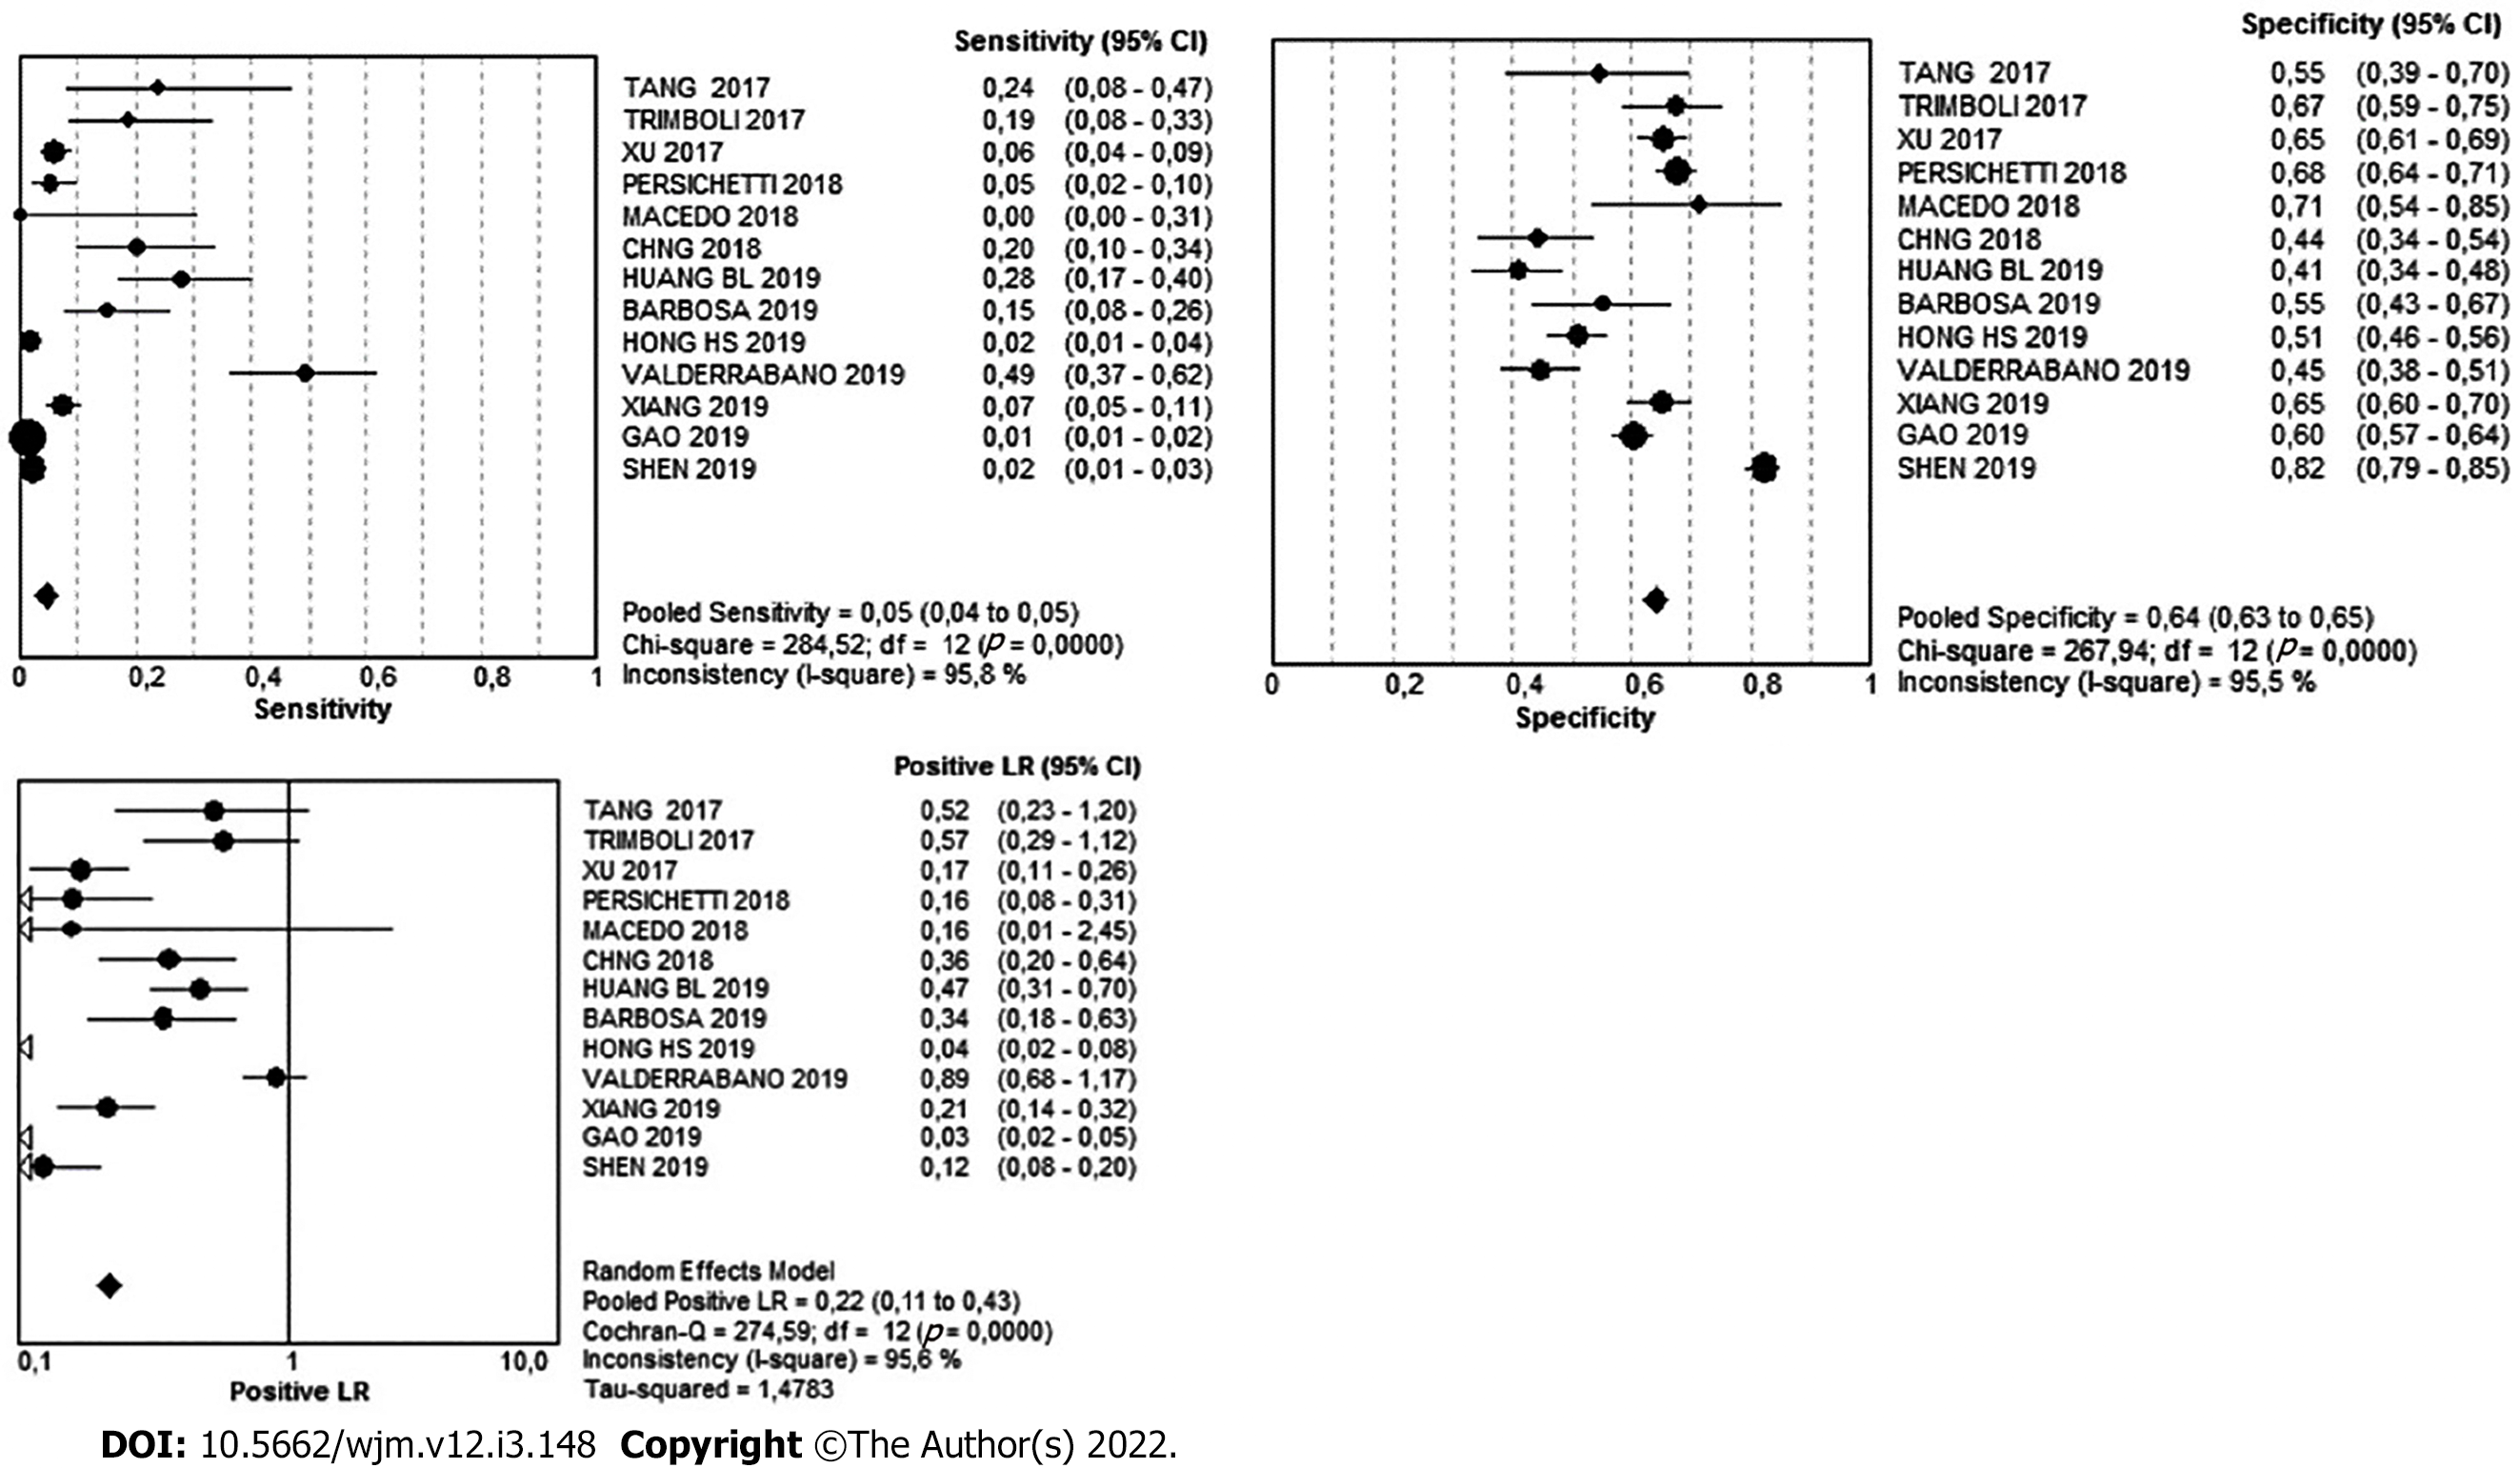
There were 1800 nodules in the low-suspicion pattern. Of these, 1621 were benign and 179 were malignant, meaning that in this pattern, the simple percentage of malignancy was 9.4%. The Youden's index was -0.31. The diagnostic value can be found in Table 3 and Figure 6.
There were 1673 nodules in the intermediate-suspicion pattern. Of these, 1340 were benign and 333 were malignant, meaning that in this pattern, the simple percentage of malignancy was 19.9%. The Youden's index was -0.22. The diagnostic value can be found in Table 3 and Figure 7.
There were 4124 nodules in the high-suspicion pattern. Of these, 715 were benign and 3404 were malignant, meaning that in this pattern, the simple percentage of malignancy was 82.5%. The Youden's index was 0.71. The diagnostic value can be found in Table 3 and Figure 8.
After using Bayesian analysis to determine the post-test probability of cancer, our results were as follows: Very low, 0.85%; low, 2.6%; intermediate, 6.7%; and high, 40.9% (Figure 9).
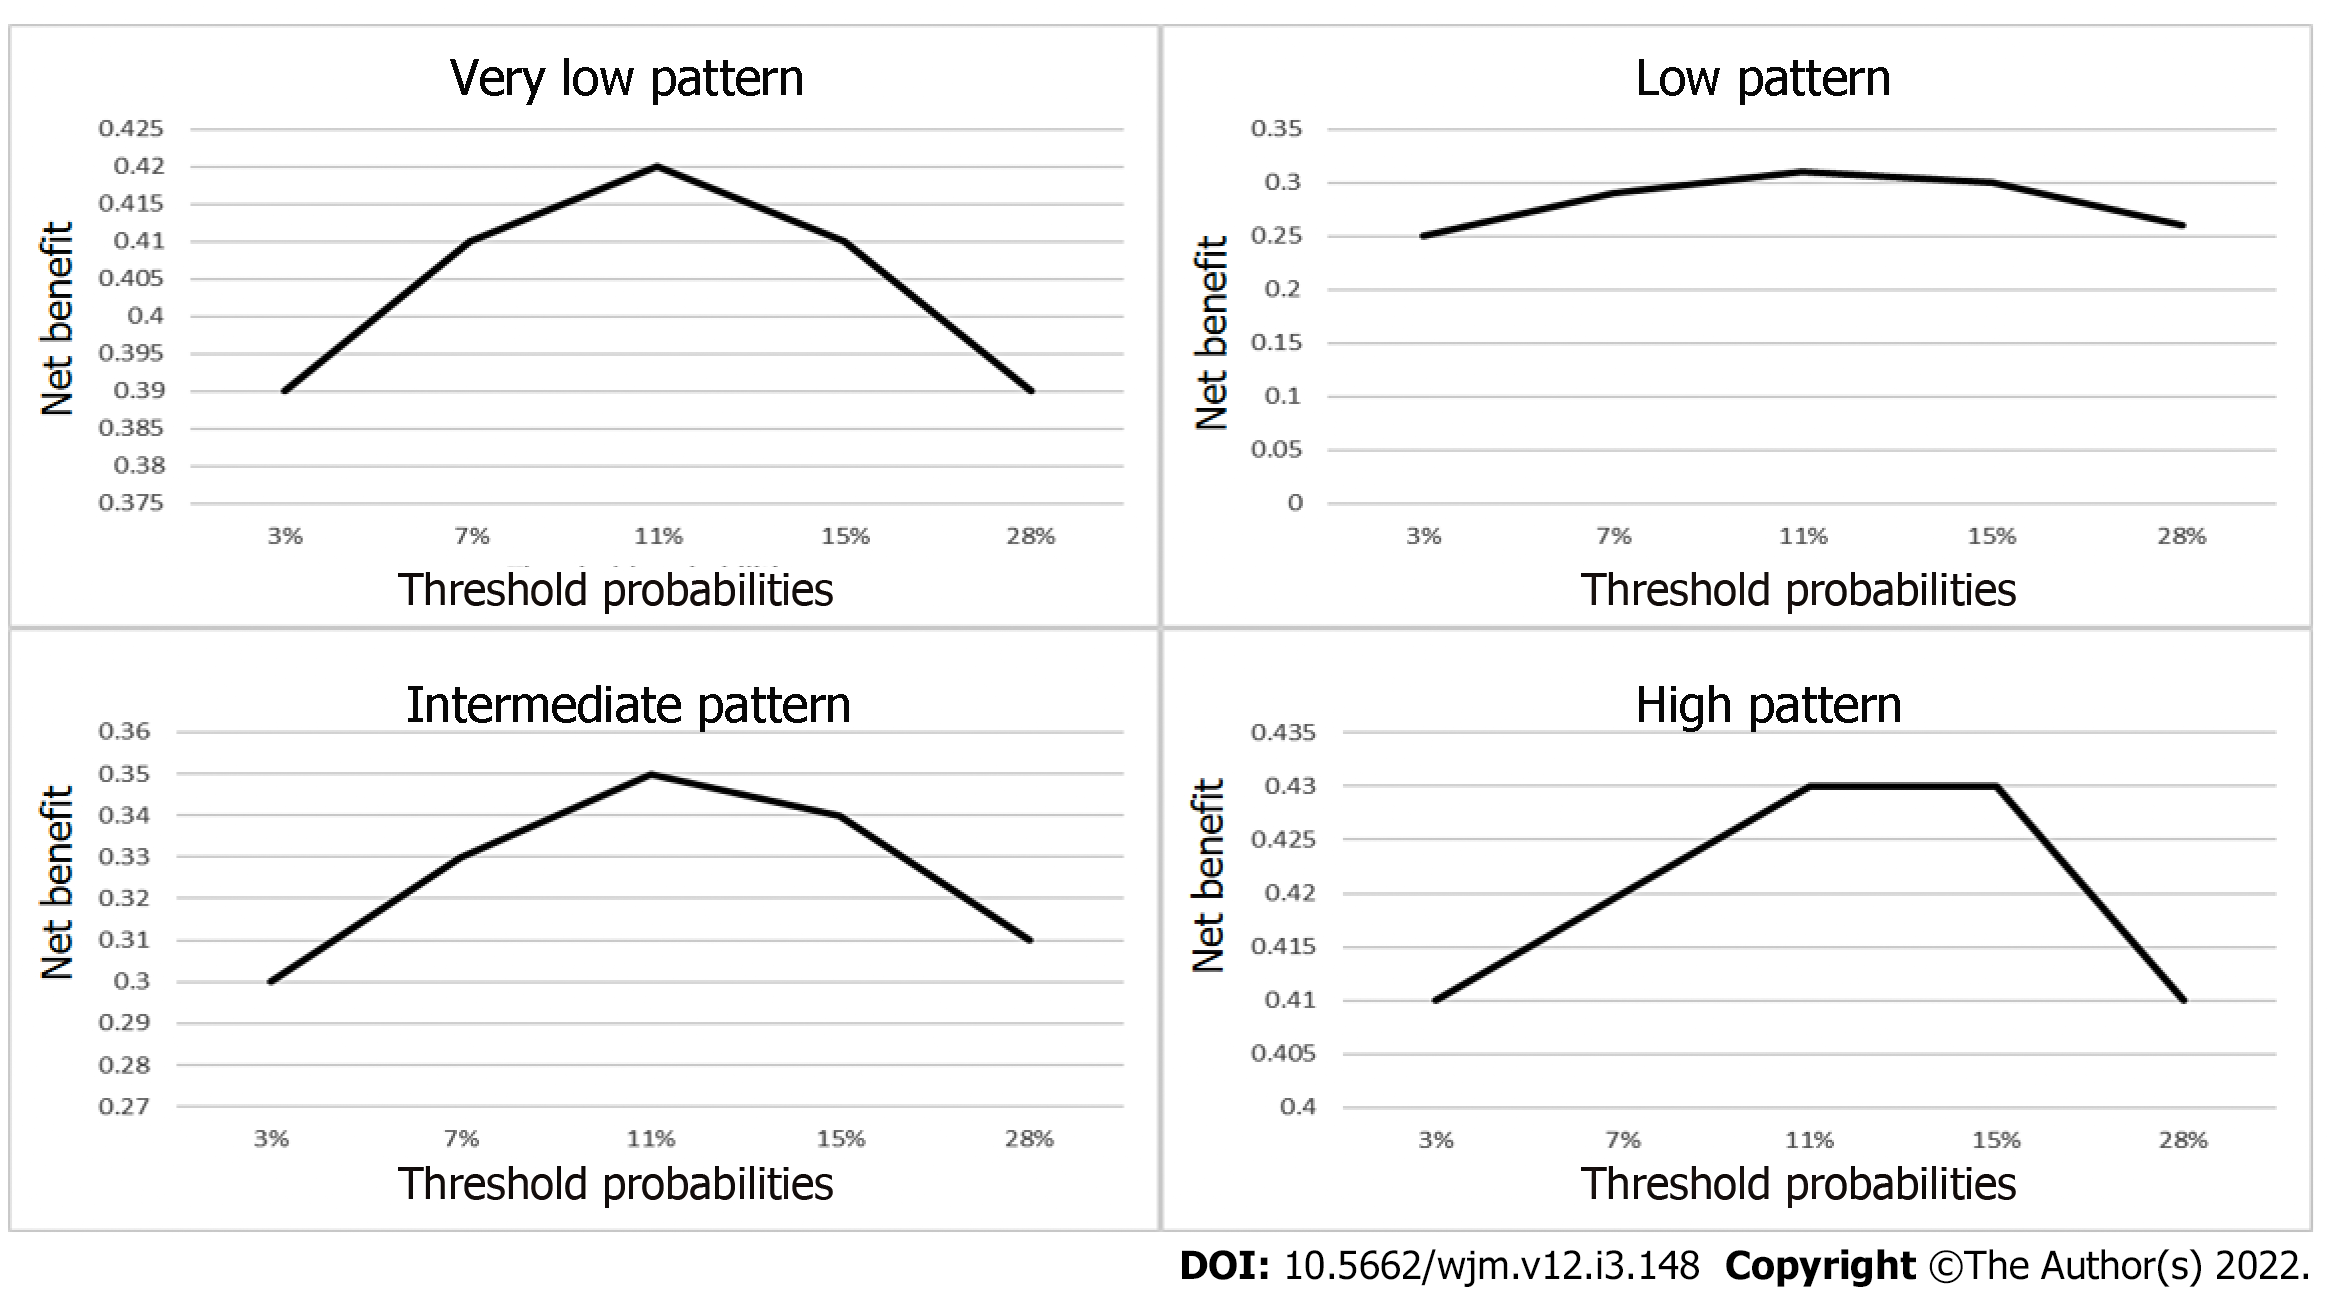
The net benefit, expressed as the number of interventions (FNAB) avoided, with a Pt calculated for all five possibilities, can be seen in Figure 10.
The NB calculation for a Pt of 11% was: Very low, -0.01028; low, -0.002526; intermediate, 0.019821; and high, 0.393207. This means that the intermediate pattern was only able to identify 1.9 of every 100 patients with cancer, and the high pattern was only able to identify 39 of every 100 patients with cancer. In the very low and low pattern cases, there was no obvious interpretation for negative net benefit using this type of framework.
The true- and false-positive count for performing FNAB in all thyroid nodules is simply the number of patients with and without thyroid cancer, respectively. Calculating the net benefit for this strategy gave: (3937/8445) − (4508/8445) × (0.11/0.89) = 0.40022. The net benefit for each of the ATA suspicion patterns studied was less than that of performing FNAB on all nodules.
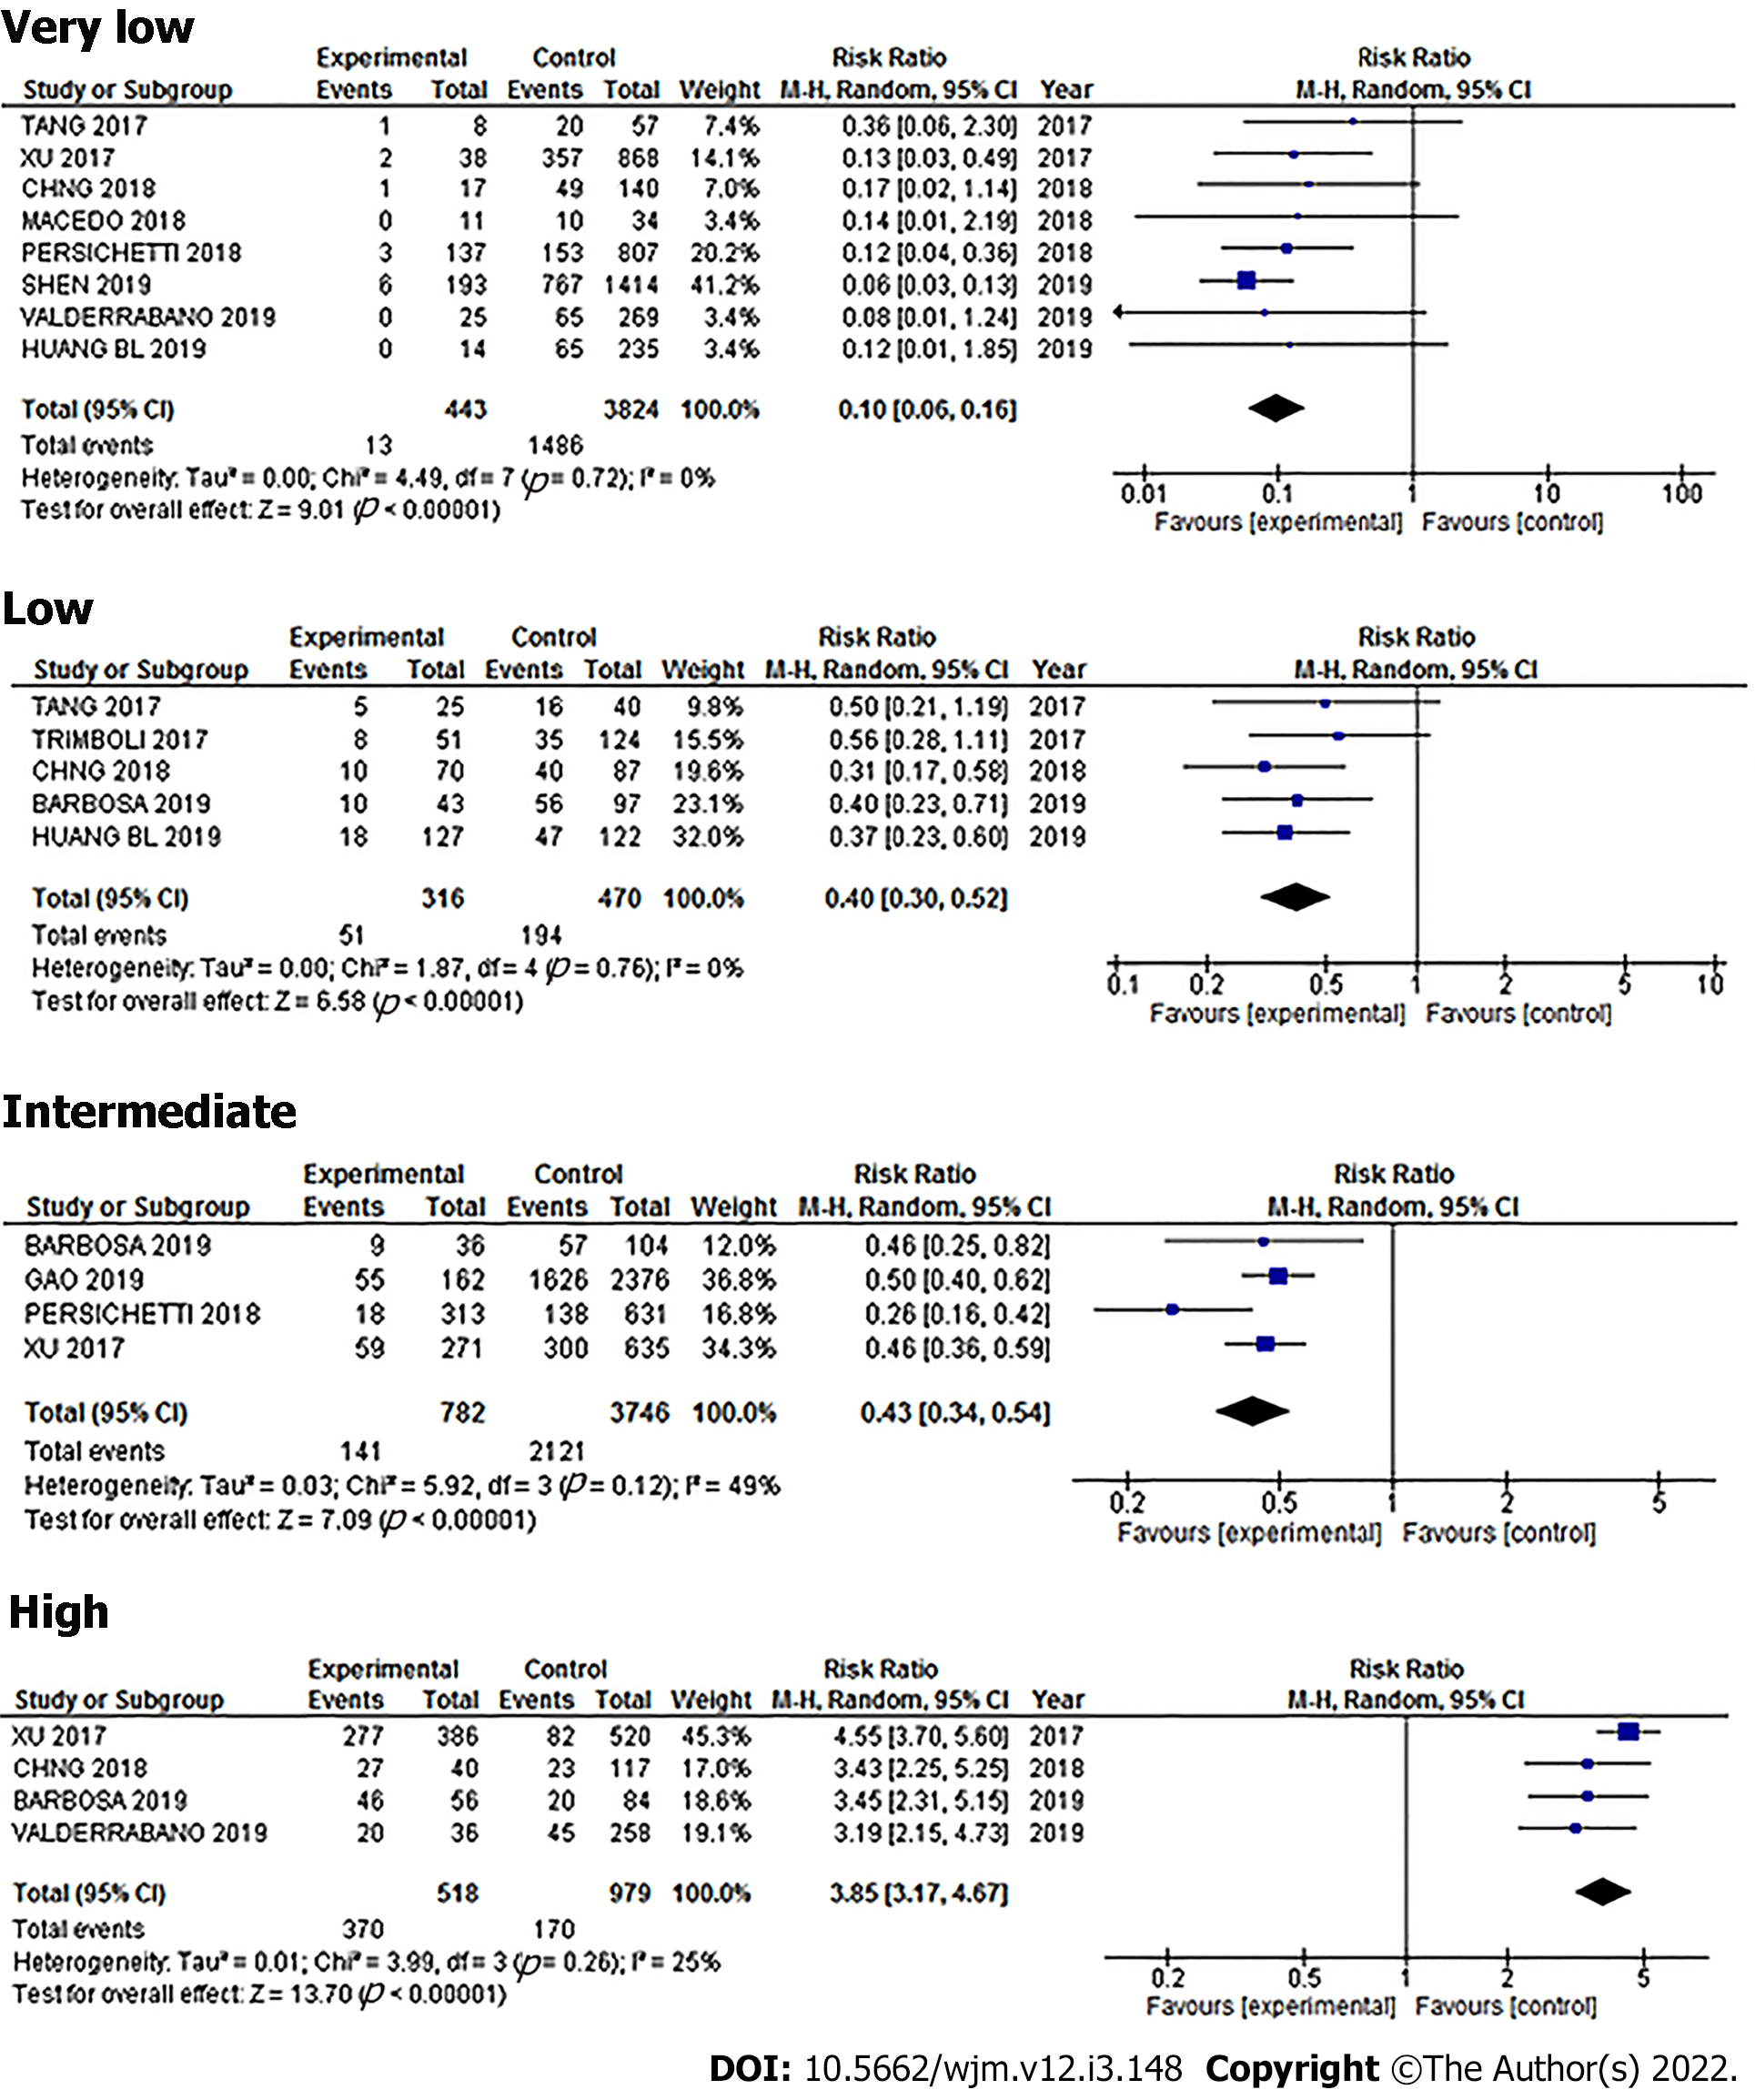
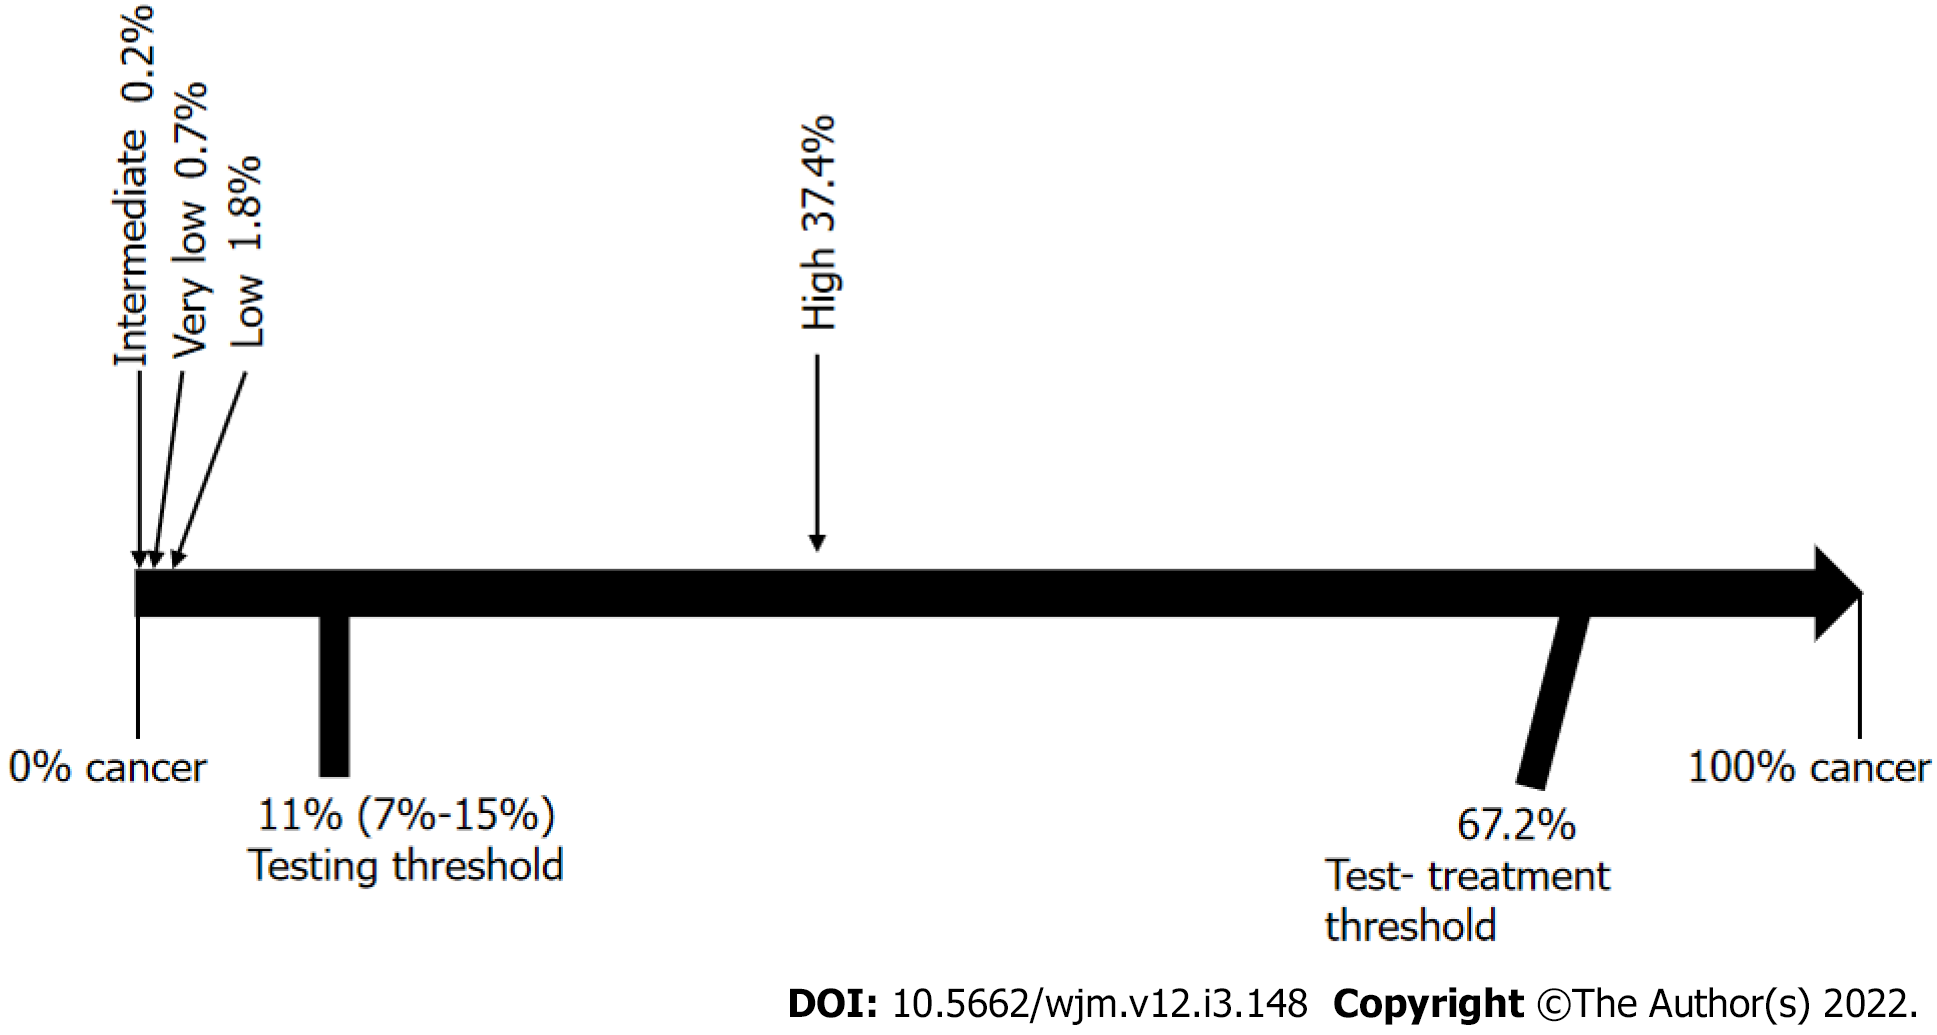
There was heterogeneity in the initial results, which could create a bias risk, so we made an analysis of the subgroups (Figure 10). The homogenous group was reduced to a population of 5151 thyroid nodules: 443 from the very low risk category with a 2.9% frequency of cancer, 316 cases from the low risk category with a 16.1% frequency of cancer, 946 from the intermediate risk category with a 20.7% frequency of cancer, and finally in the high risk category, 3446 nodules with an 81.5% frequency of cancer (Figure 11). After using Bayesian analysis to determine the post-test probability of cancer in the subgroup analysis, our results were: Very low, 0.7%; low, 1.8%; intermediate, 0.2%; and high, 37.4% (Figure 12).
This study demonstrates how complicated it can be to interpret diagnostic tests and use them for clinical decision-making.
It is important to recognize that when we analyze decision-making based on diagnostic tests, there is no one “perfect test” that can either rule out or diagnose a disease with a 100% accuracy (in this discussion, thyroid cancer). Therefore, for every patient who undergoes a diagnostic test to help guide decision-making, there will always be three possible paths; the first is to keep the nodule under observation, the second is to do additional diagnostic testing, and the third is to proceed with treatment.
The results found in this study show an overall frequency of cancer of 46.6%. This frequency is higher than the 7% to 15% reported by the ATA because the data was obtained from reference center hospitals with a high volume of thyroid cancer cases. Although this could be considered as selection bias, it is important to emphasize that the diagnostic parameters which we used in this analysis, in particular sensitivity and specificity, and the decision-making based on these diagnostic tests, are not affected by the frequency of this disease.
We must also keep in mind that while indeed cancer was most frequent in the high-suspicion pattern, 15.5% of the cases were found among the very low, low, and intermediate-suspicion patterns.
It is also important to note that we did not include the benign pattern, as it was only reported in six of the studies analyzed, and of the 62 nodules reported with this pattern, all were confirmed to be benign. Therefore, it is reasonable to assume that any thyroid nodule that is purely cystic, regardless of size, is benign, and as such, we did not consider it necessary to include them in this study.
Another potential bias is that we had to exclude the size of the thyroid nodules, as detailed information for each nodule was not available in the articles that we reviewed. However, we do not consider this as selection bias, because the average of sizes reported in the articles that we reviewed was 18.5 mm (ranging from 5 mm to 71 mm), which is within the typical range found in most nodules in the day-to-day medical practice. We therefore consider that this variable is not of particular importance in deciding which patients will need FNAB. Nodule size has always generated controversy in terms of how it might affect the diagnosis of malignancy[56-59].
The final limitation in our study is that most of the US images, and consequently their ATA US classifications, were performed retrospectively. However, this is unlikely to be significant, as the cases came from high-volume thyroid disease reference centers, and were interpreted by highly qualified US experts[60,61].
Our results show that, if we were to assume that the simple percentage for the presence of cancer in each US pattern was a reliable diagnostic tool, they would coincide perfectly with the ranges published by the 2015 ATA guidelines[17], in that the very low pattern had a 1.8% malignancy rate and the ATA reports < 3%; in the low pattern, a 9.4% malignancy rate and the ATA reports 5% to 10%; in the intermediate pattern, a 19.9% malignancy rate and the ATA reports 10% to 20%; and finally, in the high pattern, an 82.5% malignancy rate and the ATA reports between 70% and 90%.
However, when we analyzed the results of the traditional biostatistical approach to evaluating tests and Youden's index, together with the threshold approach to clinical decision-making and curve decision analysis, we can see that these US patterns were no longer as clear, or as practical.
When we analyzed a traditional diagnostic parameter, we can see that the very low, low, and intermediate patterns had a regular to good specificity, but a very low sensitivity, therefore they could, in theory, be used to correctly identify and rule out patients who do not have the disease, with very few false-positive results. In effect, this is the reason that the ATA has grouped thyroid nodules into patterns to guide decisions regarding whether to do further FNAB testing or not. However, our study showed that relying strictly on these patterns would have resulted in false positives: For very low, 18.1%; low, 36%; and intermediate, 29.7%, meaning that there would have been patients with cancer that went undetected using the US patterns, and, because the Youden's index for these three patterns was below 0, they would have been identified as “without diagnostic value”.
On the other hand, the high pattern gave a more accurate diagnostic value with a sensitivity of 86.6%, specificity of 84.1%, and Youden´s J index of 0.7, and so, this pattern is better able to discriminate between malignant and benign cases, and therefore, can be used reliably.
When analyzing decisions based on the threshold approach to clinical decision-making, we were able to determine that the testing threshold was 11% and the test-treatment threshold was 67.2%. Once we determined the values of the US patterns using Bayesian analysis, we concluded that the very low pattern had a cancer risk of 0.3%, low of 1.5%, and intermediate of 3.4%, meaning that these three patterns would be below the testing threshold and, as a logical consequence of this method of analysis, thyroid nodules classified within these three patterns could simply be left under observation, since by definition, cancer had been ruled out, rendering further testing unnecessary. However, decisions using this type of analysis would have resulted in 15.5% of the cancers in this study going undiagnosed, troubling if we keep in mind that intermediate-risk nodules are mostly isoechoic nodules, which could be follicular carcinoma, a potentially high-risk thyroid cancer with a poor prognosis. If physicians do not perform FNAB on Bethesda IV intermediate-risk nodules, this group of potentially high-risk cancers can be missed.
The high-risk pattern, on the other hand, analyzed in the same way, raises the probability of thyroid nodule cancer to 40.3%, which is between the testing threshold (11%) and the test-treatment threshold (67.2%), therefore indicating the need to do additional FNAB testing.
With regard to heterogeneity, we made an analysis by subgroups, and it is interesting to note that the frequency of malignancy was quite similar to the initial analysis. Even more importantly, after using Bayesian analysis with the threshold approach to clinical decision-making, the results were still the same, where, in the groups of very low, low, and intermediate risk, cancer was ruled out, and the high-risk group fell in the area where additional testing would be necessary.
When analyzing decision-making based on the net benefit expressed as the number of unnecessary interventions avoided, we made our calculations using several different Pt scenarios, with a Pt of 11% being the one that most frequently matched with the test threshold defined in the analysis discussed above. We made this analysis, because the classification of US patterns was intended to determine who should undergo FNAB and who could be kept under observation, in order to reduce the number of unnecessary FNABs. When evaluating the capacity to avoid unnecessary FNABs, we found that the highest capacity for avoidance was: 42 of 100 FNABs in the very low pattern with a Pt of 11%, 31 of 100 FNAB in the low pattern with a Pt of 11%, 35 of 100 FNAB in the intermediate pattern with a Pt of 11%, and 43 of 100 FNABs in the high-risk pattern with a Pt of 11%. This means that attempting to avoid unnecessary FNABs is unadvisable, since over half of them were indeed necessary, and a cancer diagnosis would have been missed if FNAB had not been performed.
When calculating NB with a Pt of 11%, the very low and low patterns had a net benefit of less than zero, so there was no obvious interpretation for negative net benefit using this type of framework. In the case of intermediate patterns, NB could only detect slightly fewer than 2 out of every 100 patients with cancer, and in high-risk patterns, it could only detect 39 out of every 100 patients with cancer.
Further still, when comparing the net benefit of each US risk pattern studied vs that of systematically performing FNAB on all thyroid nodules, we found that none were higher than that of performing FNAB on all thyroid nodules. This clearly demonstrates that using these US categories to guide the decision regarding who should undergo FNAB is inferior to performing FNAB on all thyroid nodules.
It is also important to understand that clinical decisions should not be made based on simple percentages. Instead, it is preferable to apply a rigorous study based on clinical decision models, which, although they may seem complicated to calculate, are, in reality, the only way to make an accurate professional diagnosis for the thyroid nodule patient. It is also clear that the clinically low aggressiveness of malignant thyroid cancer has allowed for a margin of error since it can be detected in a formerly undiagnosed patient at a later date. However, this diagnostic behavior would be unprofessional, as any patient who consults a physician for a thyroid nodule expects an accurate diagnosis.
From a practical standpoint, the results of this study indicate to the physician that, when evaluating thyroid nodules by US, only the high-risk and benign categories are clinically useful, indicating FNAB for high-risk cases and observation for the benign pattern. However, if the US shows a pattern of very low, low, or intermediate risk, the physician should recommend FNAB, as opposed to the current recommendations of observation only, as there is a risk of cancer of up to 15% that could go undiagnosed.
It is clear from our three types of analysis, that the only ATA diagnostic pattern that is clinically useful is the high-suspicion pattern, in which case, without a doubt, FNAB should be performed. However, and even more importantly, curve decision analysis has demonstrated that using these US risk patterns to decide which patients need FNAB does not provide a greater benefit than performing FNAB on all thyroid nodule patients. Therefore, we conclude that a better way to approach the assessment of thyroid nodules would be to perform FNAB on all non-cystic nodules, as the present study has shown that the ATA risk patterns do not provide an adequate clinical decision-making framework.
It is important to make clinical decisions with the best evidence available, but the 2015 American Thyroid Association (ATA) Ultrasound (US) Guide does not yet have sufficient evidence. Therefore it should be studied and evaluated whether or not it is useful in making clinical decisions during the initial evaluation of thyroid nodules.
The real diagnostic value and its usefulness in clinical decision-making of the ATA 2015 US guide should be known.
To perform a systematic review and meta-analysis of the diagnostic value of the American Thyroid Association US system for the initial assessment of thyroid nodules.
A meta-analysis study of the diagnostic value of the ATA 2015 ultrasonographic patterns was carried out and this diagnostic value was used to evaluate, through threshold and decision curve analysis, whether it is useful in decision-making during the initial evaluation of thyroid nodules.
The results showed that the US guided studies had no diagnostic value for decision-making in selecting which nodule should undergo or not FNAB.
Physicians should continue doing FNAB to all solid or mixed thyroid nodules.
An alternative diagnostic method must continue to be sought, which resolves the question of which nodule should undergo and which not FNAB.
Provenance and peer review: Invited article; Externally peer reviewed.
Peer-review model: Single blind
Specialty type: Endocrinology and metabolism
Country/Territory of origin: Mexico
Peer-review report’s scientific quality classification
Grade A (Excellent): A
Grade B (Very good): B
Grade C (Good): C
Grade D (Fair): 0
Grade E (Poor): 0
P-Reviewer: Bhattacharya S, India; Geng J, China; Gluvic Z, Serbia S-Editor: Ma YJ L-Editor: Wang TQ P-Editor: Qi WW
| 1. | Leeflang MM. Systematic reviews and meta-analyses of diagnostic test accuracy. Clin Microbiol Infect. 2014;20:105-113. [RCA] [PubMed] [DOI] [Full Text] [Cited by in Crossref: 171] [Cited by in RCA: 222] [Article Influence: 18.5] [Reference Citation Analysis (0)] |
| 2. | Vickers AJ, Elkin EB. Decision curve analysis: a novel method for evaluating prediction models. Med Decis Making. 2006;26:565-574. [RCA] [PubMed] [DOI] [Full Text] [Full Text (PDF)] [Cited by in Crossref: 3515] [Cited by in RCA: 3799] [Article Influence: 190.0] [Reference Citation Analysis (2)] |
| 3. | Leeflang MM, Deeks JJ, Gatsonis C, Bossuyt PM; Cochrane Diagnostic Test Accuracy Working Group. Systematic reviews of diagnostic test accuracy. Ann Intern Med. 2008;149:889-897. [RCA] [PubMed] [DOI] [Full Text] [Full Text (PDF)] [Cited by in Crossref: 901] [Cited by in RCA: 860] [Article Influence: 47.8] [Reference Citation Analysis (0)] |
| 4. | Baker SG, Kramer BS. Evaluating a new marker for risk prediction: decision analysis to the rescue. Discov Med. 2012;14:181-188. [RCA] [PubMed] [DOI] [Full Text] [Full Text (PDF)] [Cited by in Crossref: 53] [Cited by in RCA: 64] [Article Influence: 4.6] [Reference Citation Analysis (0)] |
| 5. | Pauker SG, Kassirer JP. The threshold approach to clinical decision-making. N Engl J Med. 1980;302:1109-1117. [RCA] [PubMed] [DOI] [Full Text] [Cited by in Crossref: 907] [Cited by in RCA: 874] [Article Influence: 19.0] [Reference Citation Analysis (0)] |
| 6. | Glasziou P, Hilden J. Threshold analysis of decision tables. Med Decis Making. 1986;6:161-168. [RCA] [PubMed] [DOI] [Full Text] [Cited by in Crossref: 13] [Cited by in RCA: 13] [Article Influence: 0.3] [Reference Citation Analysis (0)] |
| 7. | Glasziou P. Threshold analysis via the Bayes' nomogram. Med Decis Making. 1991;11:61-62. [RCA] [PubMed] [DOI] [Full Text] [Cited by in Crossref: 11] [Cited by in RCA: 10] [Article Influence: 0.3] [Reference Citation Analysis (0)] |
| 8. | Talboy AN, Schneider SL. Improving Understanding of Diagnostic Test Outcomes. Med Decis Making. 2018;38:573-583. [RCA] [PubMed] [DOI] [Full Text] [Cited by in Crossref: 5] [Cited by in RCA: 5] [Article Influence: 0.6] [Reference Citation Analysis (0)] |
| 9. | Fagan TJ. Letter: Nomogram for Bayes theorem. N Engl J Med. 1975;293:257. [RCA] [PubMed] [DOI] [Full Text] [Cited by in Crossref: 576] [Cited by in RCA: 583] [Article Influence: 11.4] [Reference Citation Analysis (0)] |
| 10. | Vickers AJ, van Calster B, Steyerberg EW. A simple, step-by-step guide to interpreting decision curve analysis. Diagn Progn Res. 2019;3:18. [RCA] [PubMed] [DOI] [Full Text] [Full Text (PDF)] [Cited by in Crossref: 280] [Cited by in RCA: 713] [Article Influence: 101.9] [Reference Citation Analysis (0)] |
| 11. | Vickers AJ, Van Calster B, Steyerberg EW. Net benefit approaches to the evaluation of prediction models, molecular markers, and diagnostic tests. BMJ. 2016;352:i6. [RCA] [PubMed] [DOI] [Full Text] [Full Text (PDF)] [Cited by in Crossref: 412] [Cited by in RCA: 708] [Article Influence: 70.8] [Reference Citation Analysis (1)] |
| 12. | Durante C, Grani G, Lamartina L, Filetti S, Mandel SJ, Cooper DS. The Diagnosis and Management of Thyroid Nodules: A Review. JAMA. 2018;319:914-924. [RCA] [PubMed] [DOI] [Full Text] [Cited by in Crossref: 304] [Cited by in RCA: 520] [Article Influence: 65.0] [Reference Citation Analysis (2)] |
| 13. | Ginat DT, Butani D, Giampoli EJ, Patel N, Dogra V. Pearls and pitfalls of thyroid nodule sonography and fine-needle aspiration. Ultrasound Q. 2010;26:171-178. [RCA] [PubMed] [DOI] [Full Text] [Cited by in Crossref: 25] [Cited by in RCA: 27] [Article Influence: 1.7] [Reference Citation Analysis (0)] |
| 14. | Brito JP, Gionfriddo MR, Al Nofal A, Boehmer KR, Leppin AL, Reading C, Callstrom M, Elraiyah TA, Prokop LJ, Stan MN, Murad MH, Morris JC, Montori VM. The accuracy of thyroid nodule ultrasound to predict thyroid cancer: systematic review and meta-analysis. J Clin Endocrinol Metab. 2014;99:1253-1263. [RCA] [PubMed] [DOI] [Full Text] [Cited by in Crossref: 284] [Cited by in RCA: 325] [Article Influence: 27.1] [Reference Citation Analysis (2)] |
| 15. | Remonti LR, Kramer CK, Leitão CB, Pinto LC, Gross JL. Thyroid ultrasound features and risk of carcinoma: a systematic review and meta-analysis of observational studies. Thyroid. 2015;25:538-550. [RCA] [PubMed] [DOI] [Full Text] [Full Text (PDF)] [Cited by in Crossref: 216] [Cited by in RCA: 246] [Article Influence: 22.4] [Reference Citation Analysis (0)] |
| 16. | Campanella P, Ianni F, Rota CA, Corsello SM, Pontecorvi A. Quantification of cancer risk of each clinical and ultrasonographic suspicious feature of thyroid nodules: a systematic review and meta-analysis. Eur J Endocrinol. 2014;170:R203-R211. [RCA] [PubMed] [DOI] [Full Text] [Cited by in Crossref: 91] [Cited by in RCA: 76] [Article Influence: 6.3] [Reference Citation Analysis (0)] |
| 17. | Haugen BR, Alexander EK, Bible KC, Doherty GM, Mandel SJ, Nikiforov YE, Pacini F, Randolph GW, Sawka AM, Schlumberger M, Schuff KG, Sherman SI, Sosa JA, Steward DL, Tuttle RM, Wartofsky L. 2015 American Thyroid Association Management Guidelines for Adult Patients with Thyroid Nodules and Differentiated Thyroid Cancer: The American Thyroid Association Guidelines Task Force on Thyroid Nodules and Differentiated Thyroid Cancer. Thyroid. 2016;26:1-133. [RCA] [PubMed] [DOI] [Full Text] [Cited by in Crossref: 10769] [Cited by in RCA: 10214] [Article Influence: 1021.4] [Reference Citation Analysis (1)] |
| 18. | Ha EJ, Na DG, Moon WJ, Lee YH, Choi N. Diagnostic Performance of Ultrasound-Based Risk-Stratification Systems for Thyroid Nodules: Comparison of the 2015 American Thyroid Association Guidelines with the 2016 Korean Thyroid Association/Korean Society of Thyroid Radiology and 2017 American College of Radiology Guidelines. Thyroid. 2018;28:1532-1537. [RCA] [PubMed] [DOI] [Full Text] [Cited by in Crossref: 70] [Cited by in RCA: 83] [Article Influence: 10.4] [Reference Citation Analysis (0)] |
| 19. | Creo A, Alahdab F, Al Nofal A, Thomas K, Kolbe A, Pittock ST. Ultrasonography and the American Thyroid Association Ultrasound-Based Risk Stratification Tool: Utility in Pediatric and Adolescent Thyroid Nodules. Horm Res Paediatr. 2018;90:93-101. [RCA] [PubMed] [DOI] [Full Text] [Cited by in Crossref: 21] [Cited by in RCA: 29] [Article Influence: 4.1] [Reference Citation Analysis (0)] |
| 20. | Mohammadi M, Betel C, Burton KR, Higgins KM, Ghorab Z, Halperin IJ. Retrospective Application of the 2015 American Thyroid Association Guidelines for Ultrasound Classification, Biopsy Indications, and Follow-up Imaging of Thyroid Nodules: Can Improved Reporting Decrease Testing? Can Assoc Radiol J. 2019;70:68-73. [RCA] [PubMed] [DOI] [Full Text] [Cited by in Crossref: 5] [Cited by in RCA: 6] [Article Influence: 0.9] [Reference Citation Analysis (0)] |
| 21. | Ruan JL, Yang HY, Liu RB, Liang M, Han P, Xu XL, Luo BM. Fine needle aspiration biopsy indications for thyroid nodules: compare a point-based risk stratification system with a pattern-based risk stratification system. Eur Radiol. 2019;29:4871-4878. [RCA] [PubMed] [DOI] [Full Text] [Cited by in Crossref: 28] [Cited by in RCA: 42] [Article Influence: 6.0] [Reference Citation Analysis (0)] |
| 22. | Middleton WD, Teefey SA, Reading CC, Langer JE, Beland MD, Szabunio MM, Desser TS. Comparison of Performance Characteristics of American College of Radiology TI-RADS, Korean Society of Thyroid Radiology TIRADS, and American Thyroid Association Guidelines. AJR Am J Roentgenol. 2018;210:1148-1154. [RCA] [PubMed] [DOI] [Full Text] [Cited by in Crossref: 123] [Cited by in RCA: 148] [Article Influence: 18.5] [Reference Citation Analysis (0)] |
| 23. | Kim YY, Han K, Kim EK, Moon HJ, Yoon JH, Park VY, Kwak JY. Validation of the 2015 American Thyroid Association Management Guidelines for Thyroid Nodules With Benign Cytologic Findings in the Era of the Bethesda System. AJR Am J Roentgenol. 2018;210:629-634. [RCA] [PubMed] [DOI] [Full Text] [Cited by in Crossref: 5] [Cited by in RCA: 5] [Article Influence: 0.6] [Reference Citation Analysis (0)] |
| 24. | Lee JH, Han K, Kim EK, Moon HJ, Yoon JH, Park VY, Kwak JY. Risk Stratification of Thyroid Nodules With Atypia of Undetermined Significance/Follicular Lesion of Undetermined Significance (AUS/FLUS) Cytology Using Ultrasonography Patterns Defined by the 2015 ATA Guidelines. Ann Otol Rhinol Laryngol. 2017;126:625-633. [RCA] [PubMed] [DOI] [Full Text] [Cited by in Crossref: 24] [Cited by in RCA: 29] [Article Influence: 3.2] [Reference Citation Analysis (0)] |
| 25. | Tang AL, Falciglia M, Yang H, Mark JR, Steward DL. Validation of American Thyroid Association Ultrasound Risk Assessment of Thyroid Nodules Selected for Ultrasound Fine-Needle Aspiration. Thyroid. 2017;27:1077-1082. [RCA] [PubMed] [DOI] [Full Text] [Cited by in Crossref: 47] [Cited by in RCA: 44] [Article Influence: 4.9] [Reference Citation Analysis (0)] |
| 26. | Lee JH, Han K, Kim EK, Moon HJ, Yoon JH, Park VY, Kwak JY. Validation of the modified 4-tiered categorization system through comparison with the 5-tiered categorization system of the 2015 American Thyroid Association guidelines for classifying small thyroid nodules on ultrasound. Head Neck. 2017;39:2208-2215. [RCA] [PubMed] [DOI] [Full Text] [Cited by in Crossref: 4] [Cited by in RCA: 4] [Article Influence: 0.4] [Reference Citation Analysis (0)] |
| 27. | Park CJ, Kim EK, Moon HJ, Yoon JH, Park VY, Kwak JY. Thyroid Nodules With Nondiagnostic Cytologic Results: Follow-Up Management Using Ultrasound Patterns Based on the 2015 American Thyroid Association Guidelines. AJR Am J Roentgenol. 2018;210:412-417. [RCA] [PubMed] [DOI] [Full Text] [Cited by in Crossref: 7] [Cited by in RCA: 6] [Article Influence: 0.7] [Reference Citation Analysis (0)] |
| 28. | Trimboli P, Deandrea M, Mormile A, Ceriani L, Garino F, Limone PP, Giovanella L. American Thyroid Association ultrasound system for the initial assessment of thyroid nodules: Use in stratifying the risk of malignancy of indeterminate lesions. Head Neck. 2018;40:722-727. [RCA] [PubMed] [DOI] [Full Text] [Cited by in Crossref: 19] [Cited by in RCA: 25] [Article Influence: 2.8] [Reference Citation Analysis (0)] |
| 29. | Xu T, Gu JY, Ye XH, Xu SH, Wu Y, Shao XY, Liu DZ, Lu WP, Hua F, Shi BM, Liang J, Xu L, Tang W, Liu C, Wu XH. Thyroid nodule sizes influence the diagnostic performance of TIRADS and ultrasound patterns of 2015 ATA guidelines: a multicenter retrospective study. Sci Rep. 2017;7:43183. [RCA] [PubMed] [DOI] [Full Text] [Full Text (PDF)] [Cited by in Crossref: 27] [Cited by in RCA: 36] [Article Influence: 4.0] [Reference Citation Analysis (0)] |
| 30. | Persichetti A, Di Stasio E, Guglielmi R, Bizzarri G, Taccogna S, Misischi I, Graziano F, Petrucci L, Bianchini A, Papini E. Predictive Value of Malignancy of Thyroid Nodule Ultrasound Classification Systems: A Prospective Study. J Clin Endocrinol Metab. 2018;103:1359-1368. [RCA] [PubMed] [DOI] [Full Text] [Cited by in Crossref: 59] [Cited by in RCA: 55] [Article Influence: 6.9] [Reference Citation Analysis (0)] |
| 31. | Macedo BM, Izquierdo RF, Golbert L, Meyer ELS. Reliability of Thyroid Imaging Reporting and Data System (TI-RADS), and ultrasonographic classification of the American Thyroid Association (ATA) in differentiating benign from malignant thyroid nodules. Arch Endocrinol Metab. 2018;62:131-138. [RCA] [PubMed] [DOI] [Full Text] [Cited by in Crossref: 7] [Cited by in RCA: 10] [Article Influence: 1.3] [Reference Citation Analysis (0)] |
| 32. | Chng CL, Tan HC, Too CW, Lim WY, Chiam PPS, Zhu L, Nadkarni NV, Lim AYY. Diagnostic performance of ATA, BTA and TIRADS sonographic patterns in the prediction of malignancy in histologically proven thyroid nodules. Singapore Med J. 2018;59:578-583. [RCA] [PubMed] [DOI] [Full Text] [Cited by in Crossref: 25] [Cited by in RCA: 39] [Article Influence: 4.9] [Reference Citation Analysis (0)] |
| 33. | Yoon JH, Lee HS, Kim EK, Moon HJ, Kwak JY. Malignancy Risk Stratification of Thyroid Nodules: Comparison between the Thyroid Imaging Reporting and Data System and the 2014 American Thyroid Association Management Guidelines. Radiology. 2016;278:917-924. [RCA] [PubMed] [DOI] [Full Text] [Cited by in Crossref: 148] [Cited by in RCA: 159] [Article Influence: 15.9] [Reference Citation Analysis (0)] |
| 34. | Huang BL, Ebner SA, Makkar JS, Bentley-Hibbert S, McConnell RJ, Lee JA, Hecht EM, Kuo JH. A Multidisciplinary Head-to-Head Comparison of American College of Radiology Thyroid Imaging and Reporting Data System and American Thyroid Association Ultrasound Risk Stratification Systems. Oncologist. 2020;25:398-403. [RCA] [PubMed] [DOI] [Full Text] [Cited by in Crossref: 15] [Cited by in RCA: 26] [Article Influence: 3.7] [Reference Citation Analysis (0)] |
| 35. | Barbosa TLM, Junior COM, Graf H, Cavalvanti T, Trippia MA, da Silveira Ugino RT, de Oliveira GL, Granella VH, de Carvalho GA. ACR TI-RADS and ATA US scores are helpful for the management of thyroid nodules with indeterminate cytology. BMC Endocr Disord. 2019;19:112. [RCA] [PubMed] [DOI] [Full Text] [Full Text (PDF)] [Cited by in Crossref: 78] [Cited by in RCA: 76] [Article Influence: 10.9] [Reference Citation Analysis (0)] |
| 36. | Hong HS, Lee JY. Diagnostic Performance of Ultrasound Patterns by K-TIRADS and 2015 ATA Guidelines in Risk Stratification of Thyroid Nodules and Follicular Lesions of Undetermined Significance. AJR Am J Roentgenol. 2019;213:444-450. [RCA] [PubMed] [DOI] [Full Text] [Cited by in Crossref: 15] [Cited by in RCA: 25] [Article Influence: 3.6] [Reference Citation Analysis (0)] |
| 37. | Valderrabano P, McGettigan MJ, Lam CA, Khazai L, Thompson ZJ, Chung CH, Centeno BA, McIver B. Thyroid Nodules with Indeterminate Cytology: Utility of the American Thyroid Association Sonographic Patterns for Cancer Risk Stratification. Thyroid. 2018;28:1004-1012. [RCA] [PubMed] [DOI] [Full Text] [Cited by in Crossref: 47] [Cited by in RCA: 52] [Article Influence: 6.5] [Reference Citation Analysis (0)] |
| 38. | Xiang P, Chu X, Chen G, Liu B, Ding W, Zeng Z, Wu X, Wang J, Xu S, Liu C. Nodules with nonspecific ultrasound pattern according to the 2015 American Thyroid Association malignancy risk stratification system: A comparison to the Thyroid Imaging Reporting and Data System (TIRADS-Na). Medicine (Baltimore). 2019;98:e17657. [RCA] [PubMed] [DOI] [Full Text] [Full Text (PDF)] [Cited by in Crossref: 6] [Cited by in RCA: 7] [Article Influence: 1.0] [Reference Citation Analysis (0)] |
| 39. | Gao L, Xi X, Jiang Y, Yang X, Wang Y, Zhu S, Lai X, Zhang X, Zhao R, Zhang B. Comparison among TIRADS (ACR TI-RADS and KWAK- TI-RADS) and 2015 ATA Guidelines in the diagnostic efficiency of thyroid nodules. Endocrine. 2019;64:90-96. [RCA] [PubMed] [DOI] [Full Text] [Cited by in Crossref: 70] [Cited by in RCA: 81] [Article Influence: 11.6] [Reference Citation Analysis (0)] |
| 40. | Shen Y, Liu M, He J, Wu S, Chen M, Wan Y, Gao L, Cai X, Ding J, Fu X. Comparison of Different Risk-Stratification Systems for the Diagnosis of Benign and Malignant Thyroid Nodules. Front Oncol. 2019;9:378. [RCA] [PubMed] [DOI] [Full Text] [Full Text (PDF)] [Cited by in Crossref: 47] [Cited by in RCA: 51] [Article Influence: 7.3] [Reference Citation Analysis (0)] |
| 41. | McInnes MDF, Moher D, Thombs BD, McGrath TA, Bossuyt PM; and the PRISMA-DTA Group, Clifford T, Cohen JF, Deeks JJ, Gatsonis C, Hooft L, Hunt HA, Hyde CJ, Korevaar DA, Leeflang MMG, Macaskill P, Reitsma JB, Rodin R, Rutjes AWS, Salameh JP, Stevens A, Takwoingi Y, Tonelli M, Weeks L, Whiting P, Willis BH. Preferred Reporting Items for a Systematic Review and Meta-analysis of Diagnostic Test Accuracy Studies: The PRISMA-DTA Statement. JAMA. 2018;319:388-396. [RCA] [PubMed] [DOI] [Full Text] [Cited by in Crossref: 1683] [Cited by in RCA: 2306] [Article Influence: 288.3] [Reference Citation Analysis (0)] |
| 42. | Whiting PF, Rutjes AW, Westwood ME, Mallett S, Deeks JJ, Reitsma JB, Leeflang MM, Sterne JA, Bossuyt PM; QUADAS-2 Group. QUADAS-2: a revised tool for the quality assessment of diagnostic accuracy studies. Ann Intern Med. 2011;155:529-536. [RCA] [PubMed] [DOI] [Full Text] [Cited by in Crossref: 6953] [Cited by in RCA: 10303] [Article Influence: 686.9] [Reference Citation Analysis (3)] |
| 43. | Zamora J, Abraira V, Muriel A, Khan K, Coomarasamy A. Meta-DiSc: a software for meta-analysis of test accuracy data. BMC Med Res Methodol. 2006;6:31. [RCA] [PubMed] [DOI] [Full Text] [Full Text (PDF)] [Cited by in Crossref: 1446] [Cited by in RCA: 1609] [Article Influence: 80.5] [Reference Citation Analysis (13)] |
| 44. | Yeh MW, Bauer AJ, Bernet VA, Ferris RL, Loevner LA, Mandel SJ, Orloff LA, Randolph GW, Steward DL; American Thyroid Association Surgical Affairs Committee Writing Task Force. American Thyroid Association statement on preoperative imaging for thyroid cancer surgery. Thyroid. 2015;25:3-14. [RCA] [PubMed] [DOI] [Full Text] [Cited by in Crossref: 137] [Cited by in RCA: 160] [Article Influence: 14.5] [Reference Citation Analysis (0)] |
| 45. | Francis DO, Pearce EC, Ni S, Garrett CG, Penson DF. Epidemiology of vocal fold paralyses after total thyroidectomy for well-differentiated thyroid cancer in a Medicare population. Otolaryngol Head Neck Surg. 2014;150:548-557. [RCA] [PubMed] [DOI] [Full Text] [Cited by in Crossref: 64] [Cited by in RCA: 71] [Article Influence: 5.9] [Reference Citation Analysis (0)] |
| 46. | Onoda N, Noda S, Tauchi Y, Asano Y, Kusunoki Y, Ishihara S, Morisaki T, Kashiwagi S, Takashima T, Ohira M. Continuous intraoperative neuromonitoring for thyroid cancer surgery: A prospective study. Laryngoscope Investig Otolaryngol. 2019;4:455-459. [RCA] [PubMed] [DOI] [Full Text] [Full Text (PDF)] [Cited by in Crossref: 4] [Cited by in RCA: 6] [Article Influence: 0.9] [Reference Citation Analysis (0)] |
| 47. | Caulley L, Johnson-Obaseki S, Luo L, Javidnia H. Risk factors for postoperative complications in total thyroidectomy: A retrospective, risk-adjusted analysis from the National Surgical Quality Improvement Program. Medicine (Baltimore). 2017;96:e5752. [RCA] [PubMed] [DOI] [Full Text] [Full Text (PDF)] [Cited by in Crossref: 52] [Cited by in RCA: 71] [Article Influence: 7.9] [Reference Citation Analysis (0)] |
| 48. | Chen HC, Pei YC, Fang TJ. Risk factors for thyroid surgery-related unilateral vocal fold paralysis. Laryngoscope. 2019;129:275-283. [RCA] [PubMed] [DOI] [Full Text] [Full Text (PDF)] [Cited by in Crossref: 10] [Cited by in RCA: 15] [Article Influence: 1.9] [Reference Citation Analysis (0)] |
| 49. | Hurtado-Lopez LM, Pacheco-Alvarez MI, Montes-Castillo Mde L, Zaldivar-Ramirez FR. Importance of the intraoperative identification of the external branch of the superior laryngeal nerve during thyroidectomy: electromyographic evaluation. Thyroid. 2005;15:449-454. [RCA] [PubMed] [DOI] [Full Text] [Cited by in Crossref: 44] [Cited by in RCA: 36] [Article Influence: 1.7] [Reference Citation Analysis (0)] |
| 50. | Eismontas V, Slepavicius A, Janusonis V, Zeromskas P, Beisa V, Strupas K, Dambrauskas Z, Gulbinas A, Martinkenas A. Predictors of postoperative hypocalcemia occurring after a total thyroidectomy: results of prospective multicenter study. BMC Surg. 2018;18:55. [RCA] [PubMed] [DOI] [Full Text] [Full Text (PDF)] [Cited by in Crossref: 51] [Cited by in RCA: 51] [Article Influence: 6.4] [Reference Citation Analysis (0)] |
| 51. | Rosato L, Avenia N, Bernante P, De Palma M, Gulino G, Nasi PG, Pelizzo MR, Pezzullo L. Complications of thyroid surgery: analysis of a multicentric study on 14,934 patients operated on in Italy over 5 years. World J Surg. 2004;28:271-276. [RCA] [PubMed] [DOI] [Full Text] [Cited by in Crossref: 552] [Cited by in RCA: 551] [Article Influence: 25.0] [Reference Citation Analysis (0)] |
| 52. | Wilson RB, Erskine C, Crowe PJ. Hypomagnesemia and hypocalcemia after thyroidectomy: prospective study. World J Surg. 2000;24:722-726. [RCA] [PubMed] [DOI] [Full Text] [Cited by in Crossref: 84] [Cited by in RCA: 93] [Article Influence: 3.6] [Reference Citation Analysis (0)] |
| 53. | Bai B, Chen Z, Chen W. Risk factors and outcomes of incidental parathyroidectomy in thyroidectomy: A systematic review and meta-analysis. PLoS One. 2018;13:e0207088. [RCA] [PubMed] [DOI] [Full Text] [Full Text (PDF)] [Cited by in Crossref: 16] [Cited by in RCA: 44] [Article Influence: 5.5] [Reference Citation Analysis (0)] |
| 54. | Fan C, Zhou X, Su G, Zhou Y, Su J, Luo M, Li H. Risk factors for neck hematoma requiring surgical re-intervention after thyroidectomy: a systematic review and meta-analysis. BMC Surg. 2019;19:98. [RCA] [PubMed] [DOI] [Full Text] [Full Text (PDF)] [Cited by in Crossref: 20] [Cited by in RCA: 48] [Article Influence: 6.9] [Reference Citation Analysis (0)] |
| 55. | Reeve T, Thompson NW. Complications of thyroid surgery: how to avoid them, how to manage them, and observations on their possible effect on the whole patient. World J Surg. 2000;24:971-975. [RCA] [PubMed] [DOI] [Full Text] [Cited by in Crossref: 257] [Cited by in RCA: 231] [Article Influence: 8.9] [Reference Citation Analysis (0)] |
| 56. | Shin JJ, Caragacianu D, Randolph GW. Impact of thyroid nodule size on prevalence and post-test probability of malignancy: a systematic review. Laryngoscope. 2015;125:263-272. [RCA] [PubMed] [DOI] [Full Text] [Cited by in Crossref: 60] [Cited by in RCA: 69] [Article Influence: 5.8] [Reference Citation Analysis (0)] |
| 57. | Brito JP, Singh-Ospina N, Gionfriddo MR, Maraka S, Espinosa De Ycaza A, Rodriguez-Gutierrez R, Morris JC, Montori VM, Tuttle RM. Restricting ultrasound thyroid fine needle aspiration biopsy by nodule size: which tumors are we missing? Endocrine. 2016;51:499-505. [RCA] [PubMed] [DOI] [Full Text] [Cited by in Crossref: 5] [Cited by in RCA: 7] [Article Influence: 0.7] [Reference Citation Analysis (0)] |
| 58. | Hong MJ, Na DG, Baek JH, Sung JY, Kim JH. Impact of Nodule Size on Malignancy Risk Differs according to the Ultrasonography Pattern of Thyroid Nodules. Korean J Radiol. 2018;19:534-541. [RCA] [PubMed] [DOI] [Full Text] [Full Text (PDF)] [Cited by in Crossref: 29] [Cited by in RCA: 40] [Article Influence: 5.0] [Reference Citation Analysis (0)] |
| 59. | Cavallo A, Johnson DN, White MG, Siddiqui S, Antic T, Mathew M, Grogan RH, Angelos P, Kaplan EL, Cipriani NA. Thyroid Nodule Size at Ultrasound as a Predictor of Malignancy and Final Pathologic Size. Thyroid. 2017;27:641-650. [RCA] [PubMed] [DOI] [Full Text] [Cited by in Crossref: 64] [Cited by in RCA: 77] [Article Influence: 8.6] [Reference Citation Analysis (0)] |
| 60. | Alexander LF, Patel NJ, Caserta MP, Robbin ML. Thyroid Ultrasound: Diffuse and Nodular Disease. Radiol Clin North Am. 2020;58:1041-1057. [RCA] [PubMed] [DOI] [Full Text] [Cited by in Crossref: 12] [Cited by in RCA: 38] [Article Influence: 6.3] [Reference Citation Analysis (0)] |
| 61. | Grani G, Sponziello M, Pecce V, Ramundo V, Durante C. Contemporary Thyroid Nodule Evaluation and Management. J Clin Endocrinol Metab. 2020;105. [RCA] [PubMed] [DOI] [Full Text] [Cited by in Crossref: 81] [Cited by in RCA: 180] [Article Influence: 30.0] [Reference Citation Analysis (0)] |


