©The Author(s) 2018.
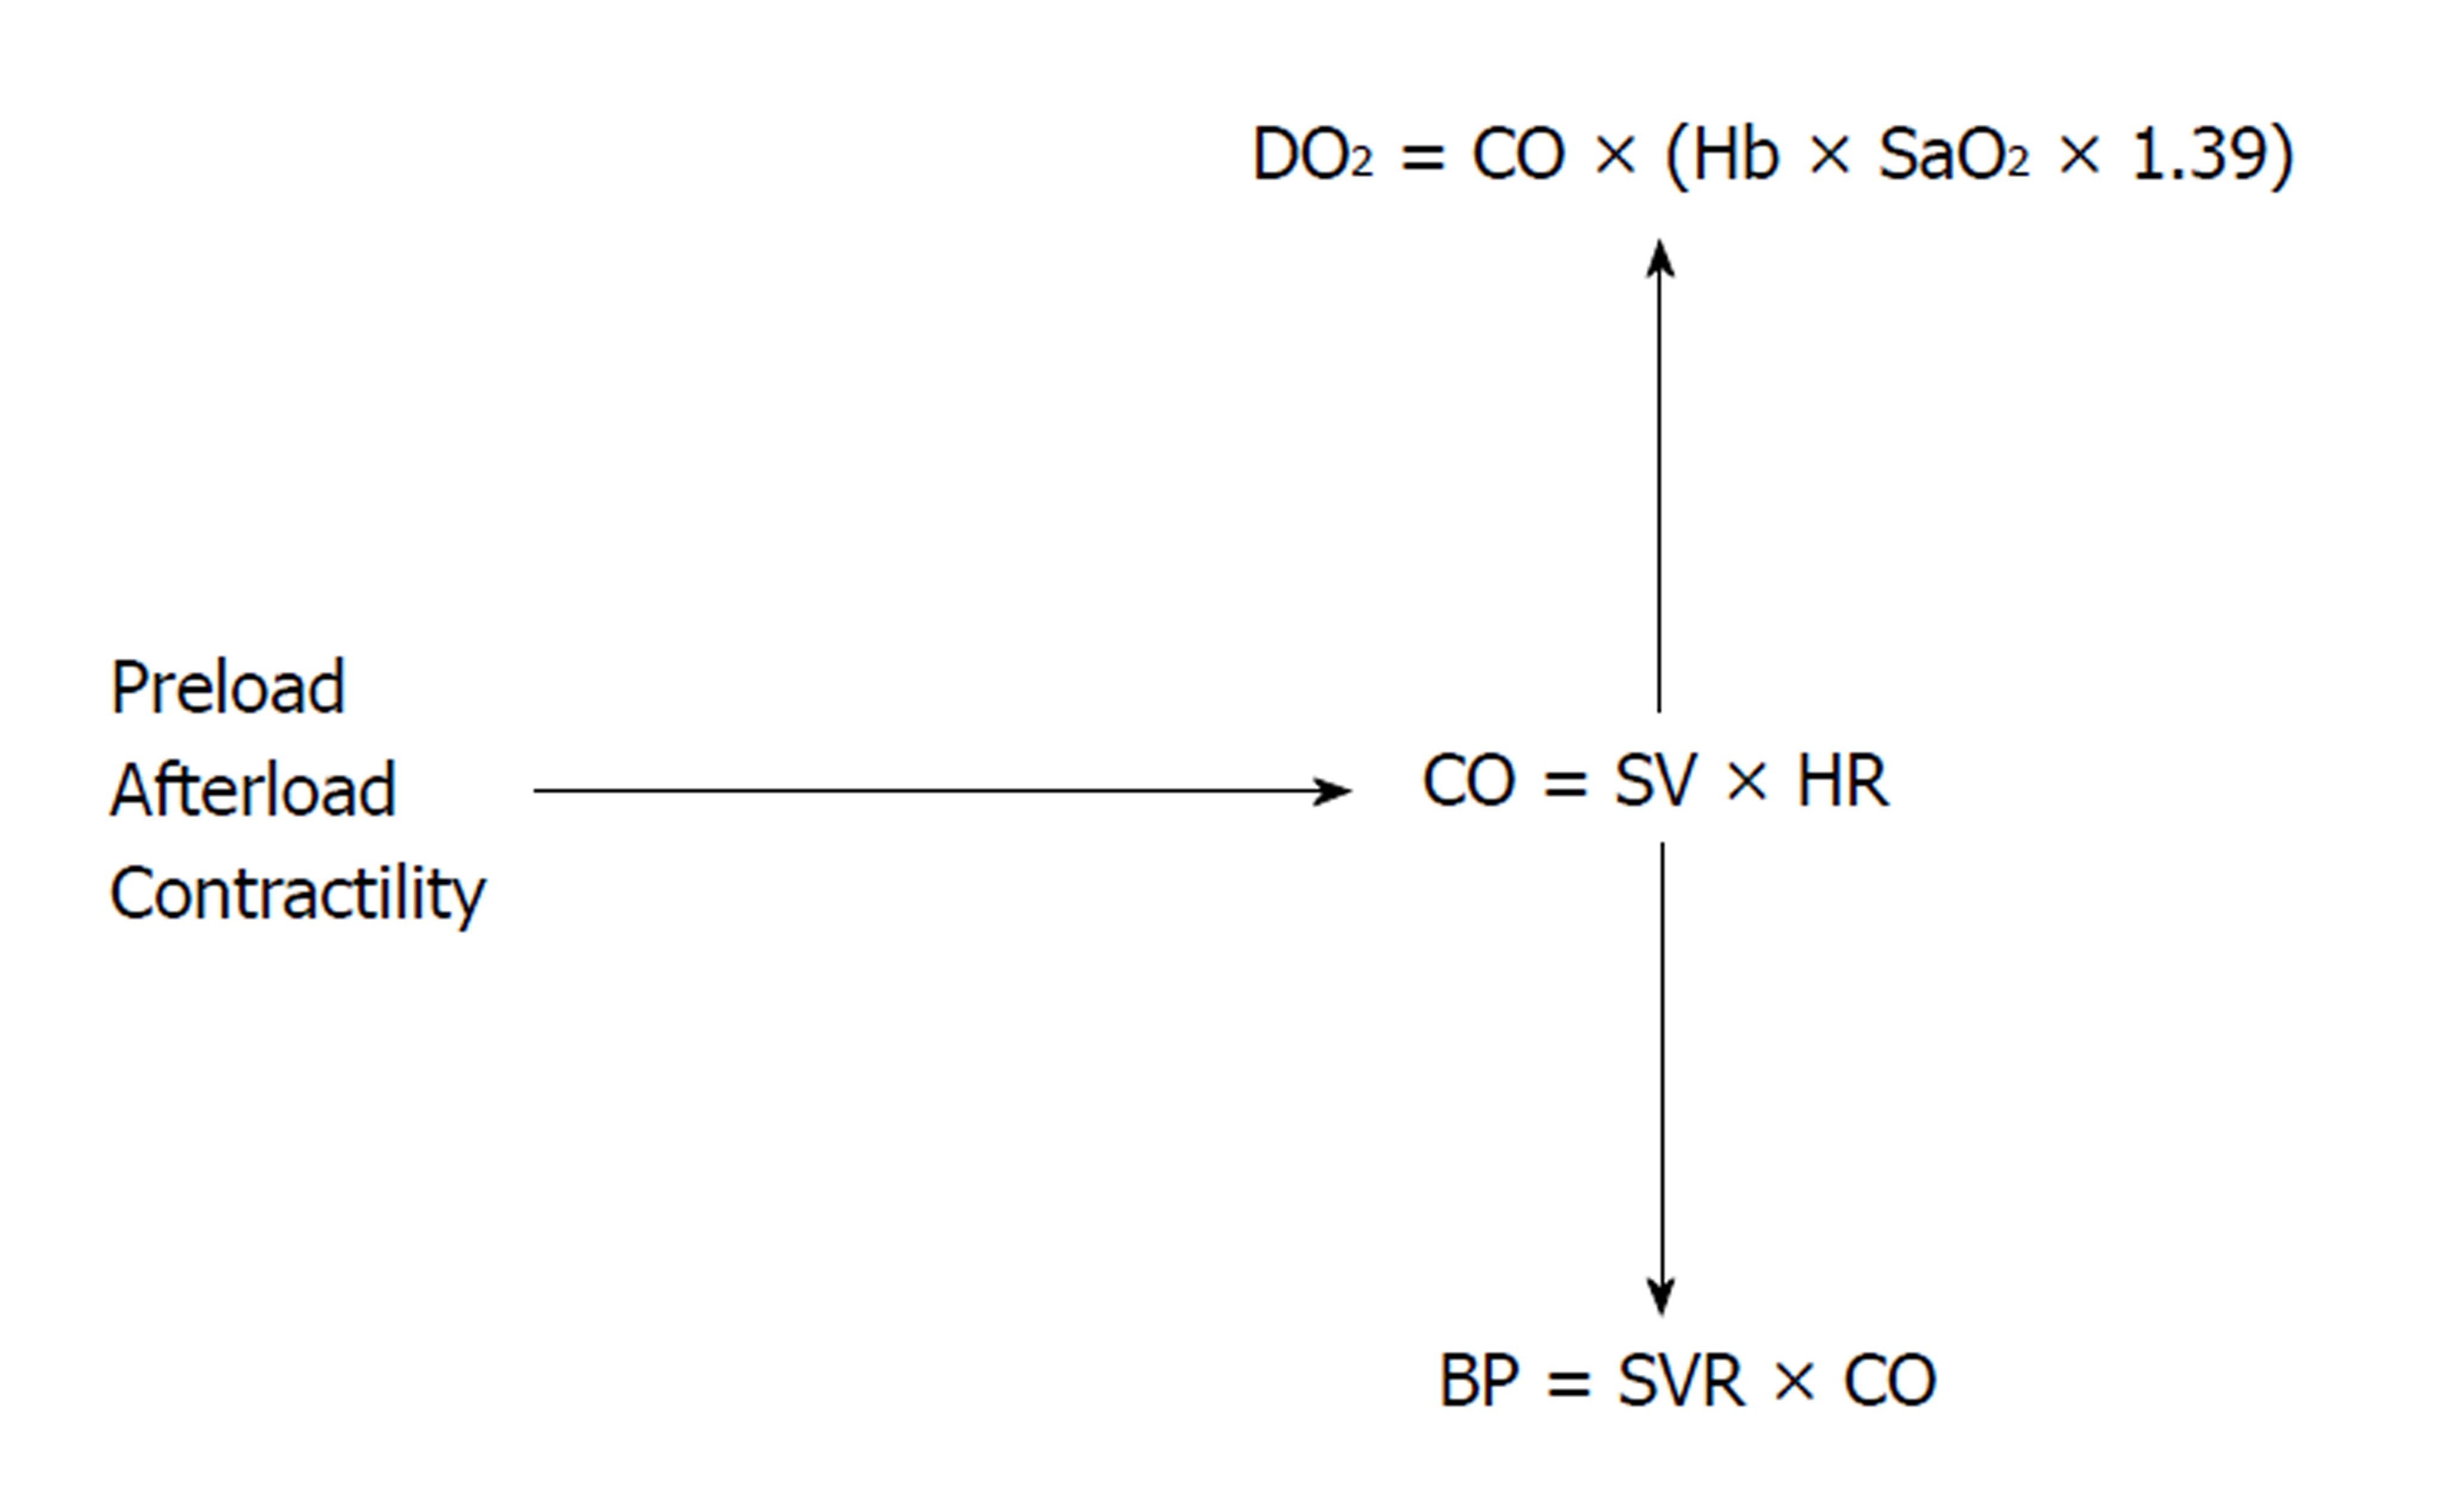
Figure 1 Interplay of hemodynamic parameters.
The interplay among the preload, the afterload and the cardiac contractility determines the CO. Cardiac output is essential to maintain a good blood pressure and tissue oxygen delivery. DO2: Systemic oxygen delivery; SaO2: Arterial oxygen saturation; Hb: Hemoglobin level; CO: Cardiac output; SV: Stroke volume; HR: Heart rate; BP: Blood pressure; SVR: Systemic vascular resistance.
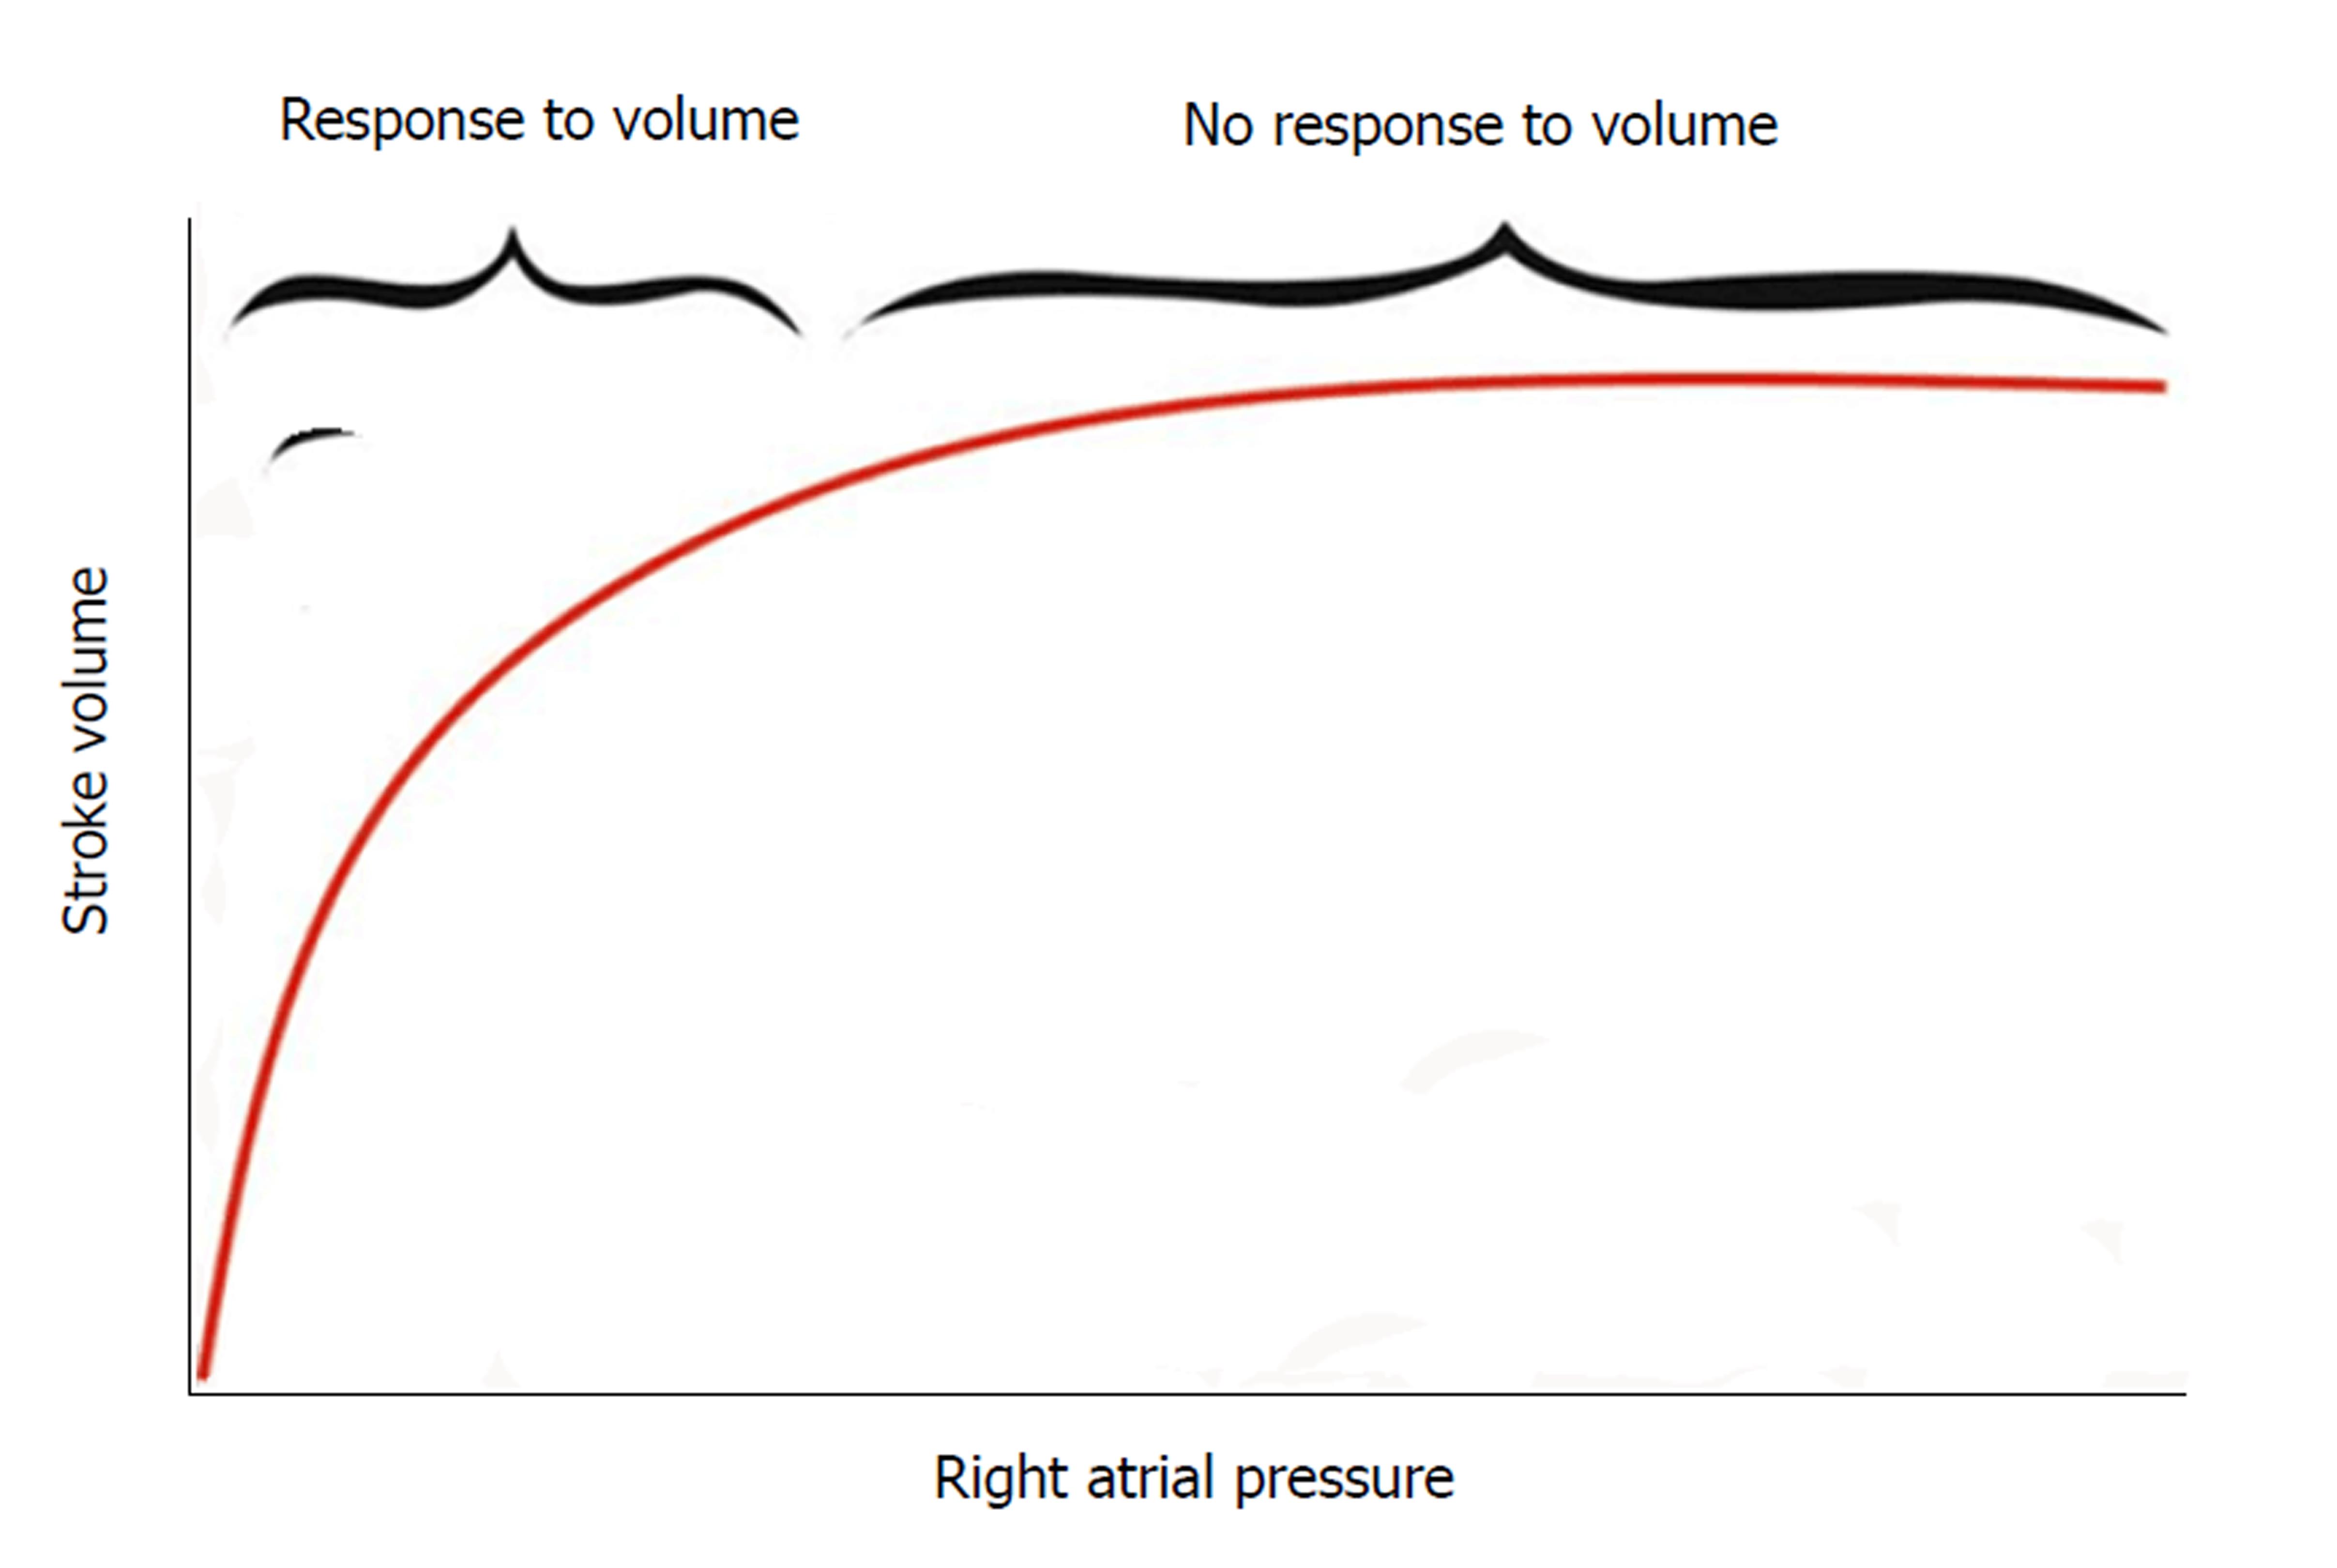
Figure 2 Frank-Starling curve depicting the relation between preload (right atrial pressure) and stroke volume.
At the the steep limb of the curve, there is improvement of stroke volume in response to fluid boluses while there is no more response to the fluid boluses at the flat limb of the curve.
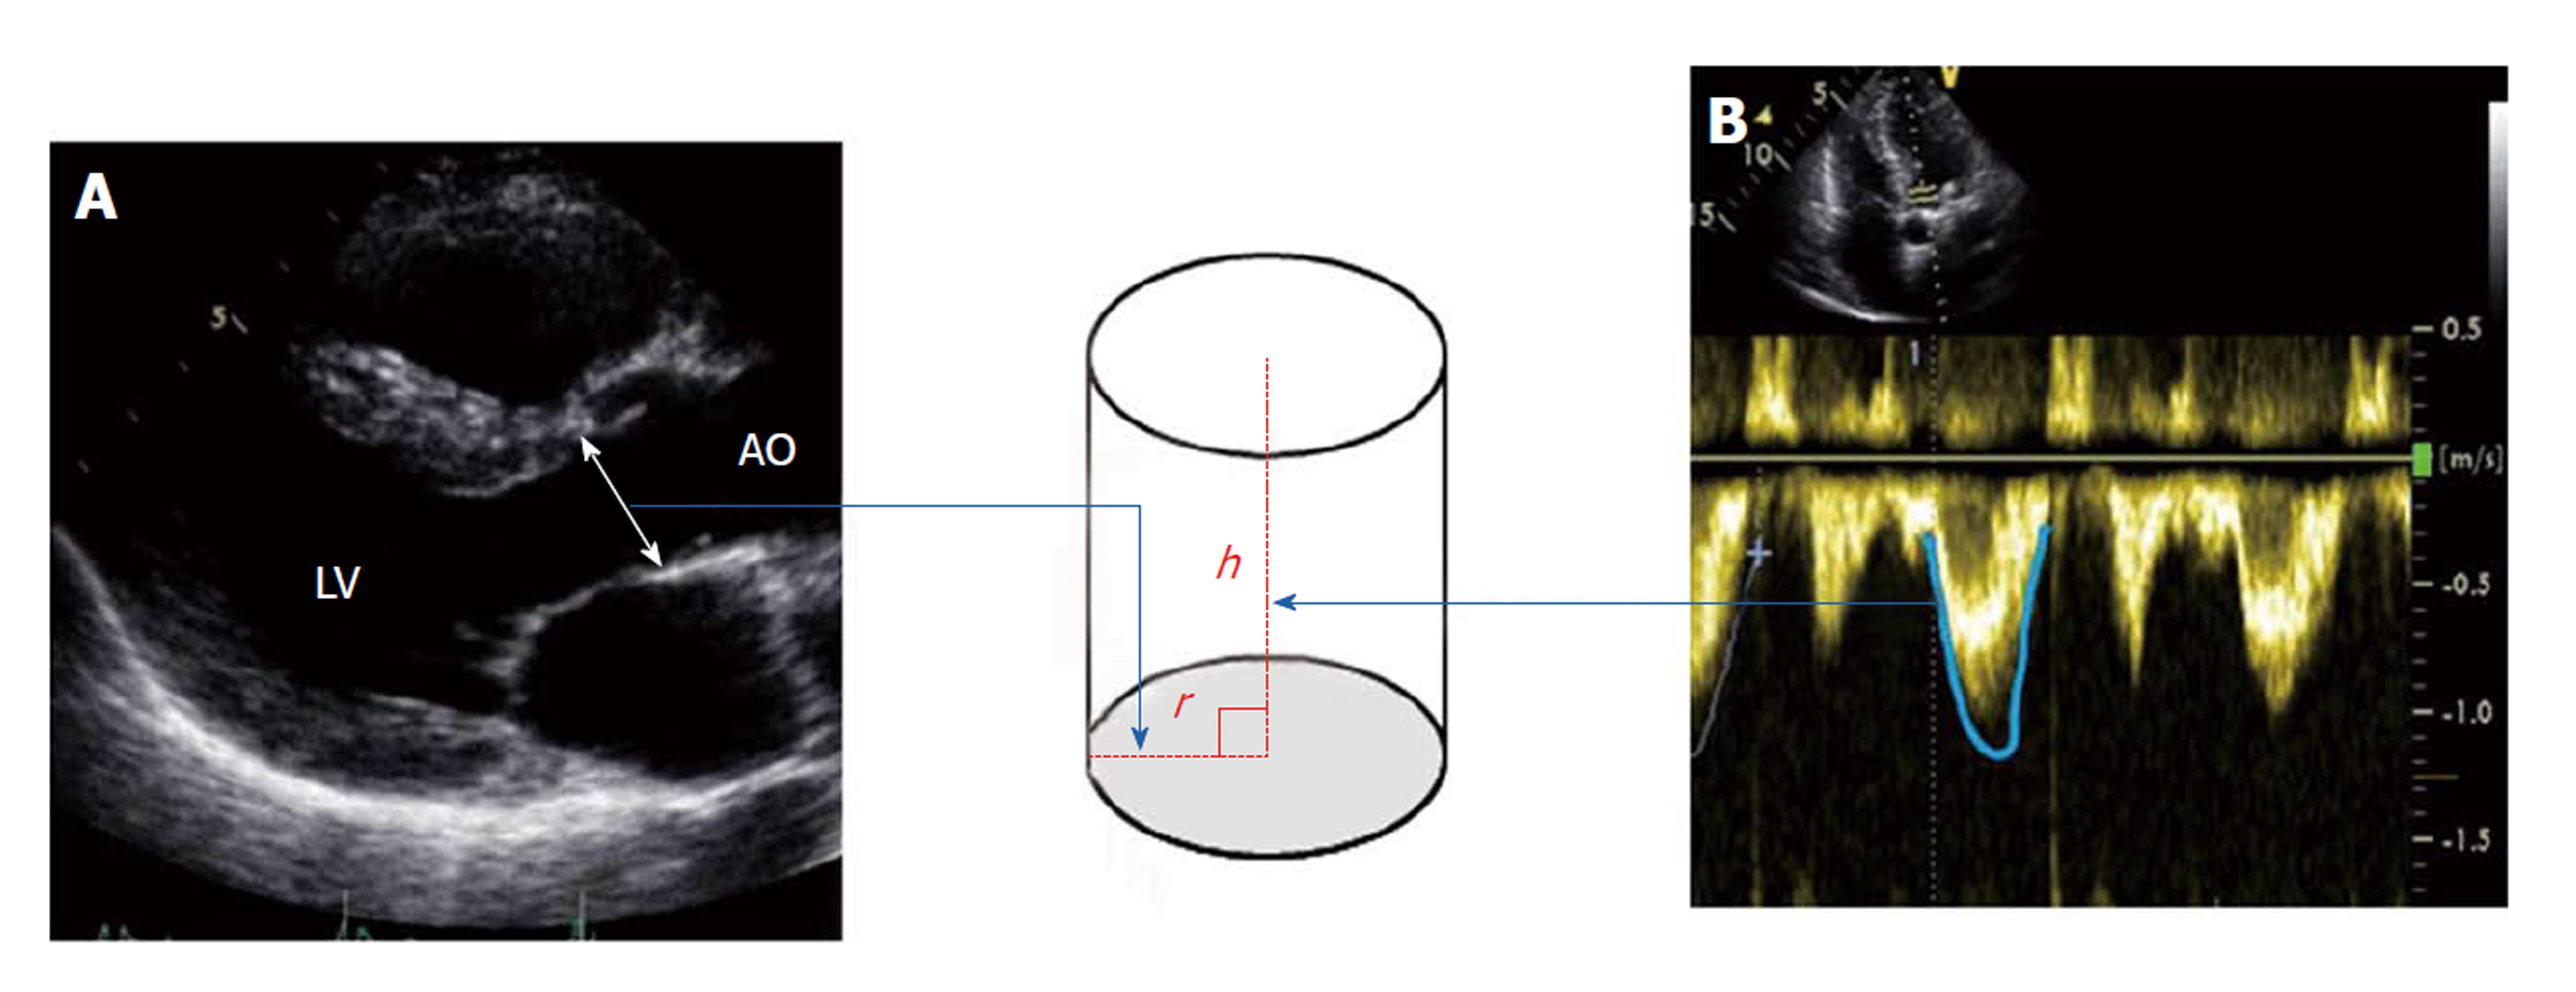
Figure 3 Stroke volume is considered as the volume of a virtual cylinder of blood ejected each beat out of the heart at its left ventricular outflow tract.
The base of this cylinder is the LVOT area (area = π.r2) π = 3.14, r is the radius and its height (h) is the velocity time integral (VTI), which is the velocity of blood in systole moving through the LVOT. So, SV will be the net result of π (LVOT diameter/2)2 × LVOT VTI. The diameter of the LVOT is measured using a parasternal long axis view during systole (A) and the VTI is measured with continuous wave Doppler (B). LVOT: Left ventricular outflow tract.
- Citation: Fathi EM, Narchi H, Chedid F. Noninvasive hemodynamic monitoring of septic shock in children. World J Methodol 2018; 8(1): 1-8
- URL: https://www.wjgnet.com/2222-0682/full/v8/i1/1.htm
- DOI: https://dx.doi.org/10.5662/wjm.v8.i1.1


