©2013 Baishideng Publishing Group Co.
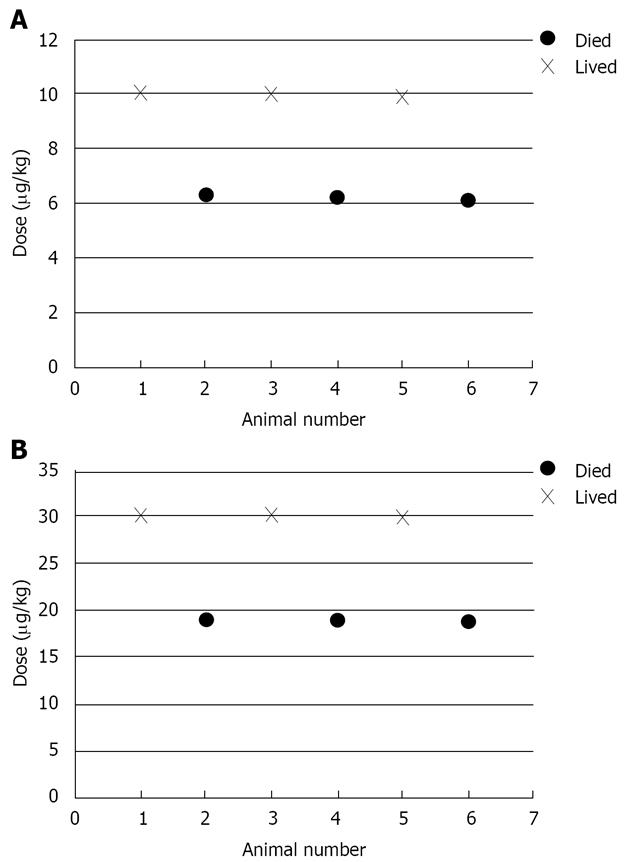
Figure 1 Graph of the dose and the outcome (lived or died) for the first (A) and second (B) experiment.
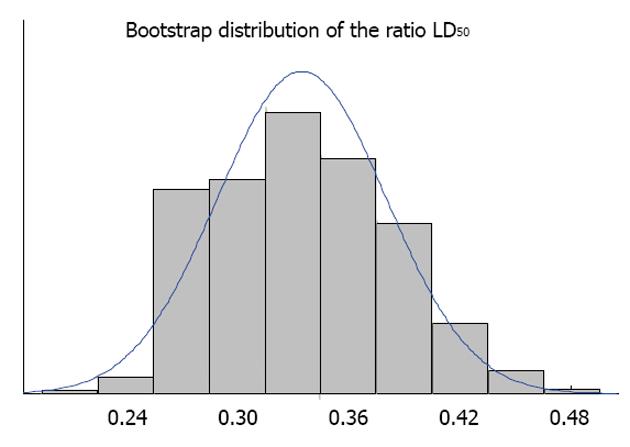
Figure 2 Bootstrap distribution of antidotal potency ratio.
LD50: Lethal dose 50.
- Citation: Manage A, Petrikovics I. Confidence limit calculation for antidotal potency ratio derived from lethal dose 50. World J Methodol 2013; 3(1): 7-10
- URL: https://www.wjgnet.com/2222-0682/full/v3/i1/7.htm
- DOI: https://dx.doi.org/10.5662/wjm.v3.i1.7


