©2012 Baishideng Publishing Group Co.
World J Methodol. Dec 26, 2012; 2(6): 42-49
Published online Dec 26, 2012. doi: 10.5662/wjm.v2.i6.42
Published online Dec 26, 2012. doi: 10.5662/wjm.v2.i6.42
Figure 1 An example of the equation used to calculate atomic forces.
The equation describes potential energy in the Assisted Model Building with Energy Refinement force field. The first summation term represents the energy between the covalently bonded atoms. Summing of the angles, second term, represents the energy due to the angle geometry. Third term represents the energy of the torsion angles. Forth term accounts for the energy of the non-bonded interactions between all pairs of atom. This term can be decomposed into van der Waals and electrostatic energies. The subscript zero represents equilibrium values. The energy terms are parameterized to fit experimental (for example, spectroscopic) data and/or quantum-mechanical calculations.
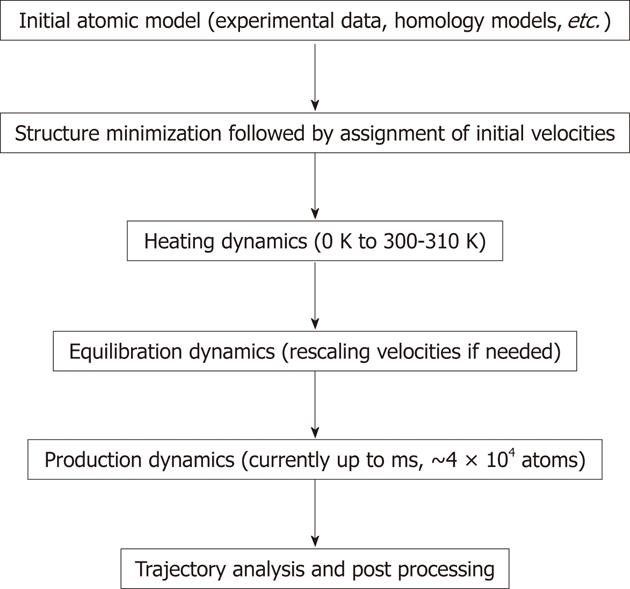
Figure 2 General steps used in molecular dynamics simulations.
During the simulations molecular focus on each atom are calculated based on the equation shown in Figure 1. During dynamics calculations (heating, equilibration and production) the positions of atoms are moved according to Newton’s law of motion. The simulation time is advanced, and the process is repeated numerous times to generate molecular dynamics rajectory. The longest trajectory is generated during the production run.
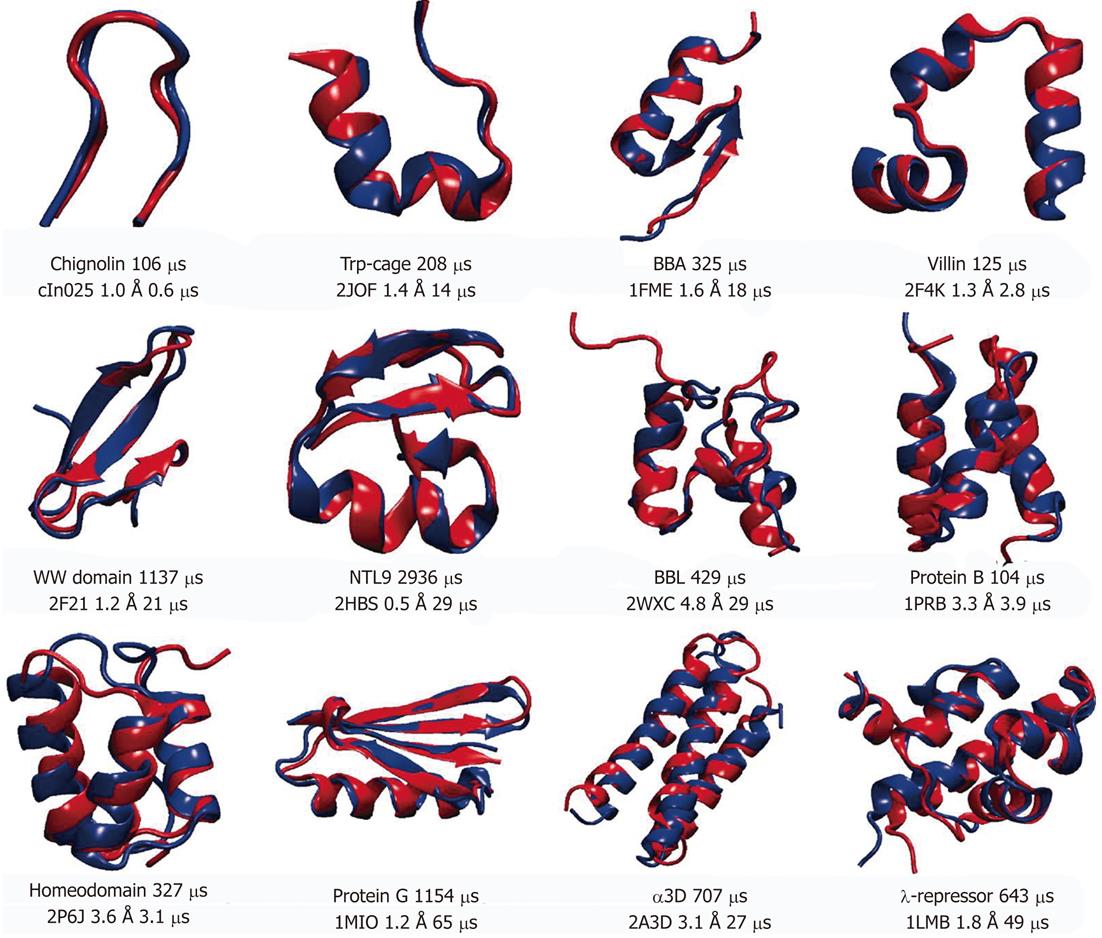
Figure 3 Representative structures of 12 proteins used in molecular dynamics simulation studies[42].
Experimentally determined structures are shown in red and superimposed onto the structures obtained from molecular dynamics simulations (shown in blue). Protein Databank (PDB) entry, root mean square deviations of Cα atoms between two structures and simulation times (total and needed for folding) are displayed for each protein under the superimposed structures. For Protein G the PDB entry was used for the closest homolog, since the structure for the simulated sequence has not been solved experimentally. Reproduced with permission (Copyright 2011, Science publishing group).
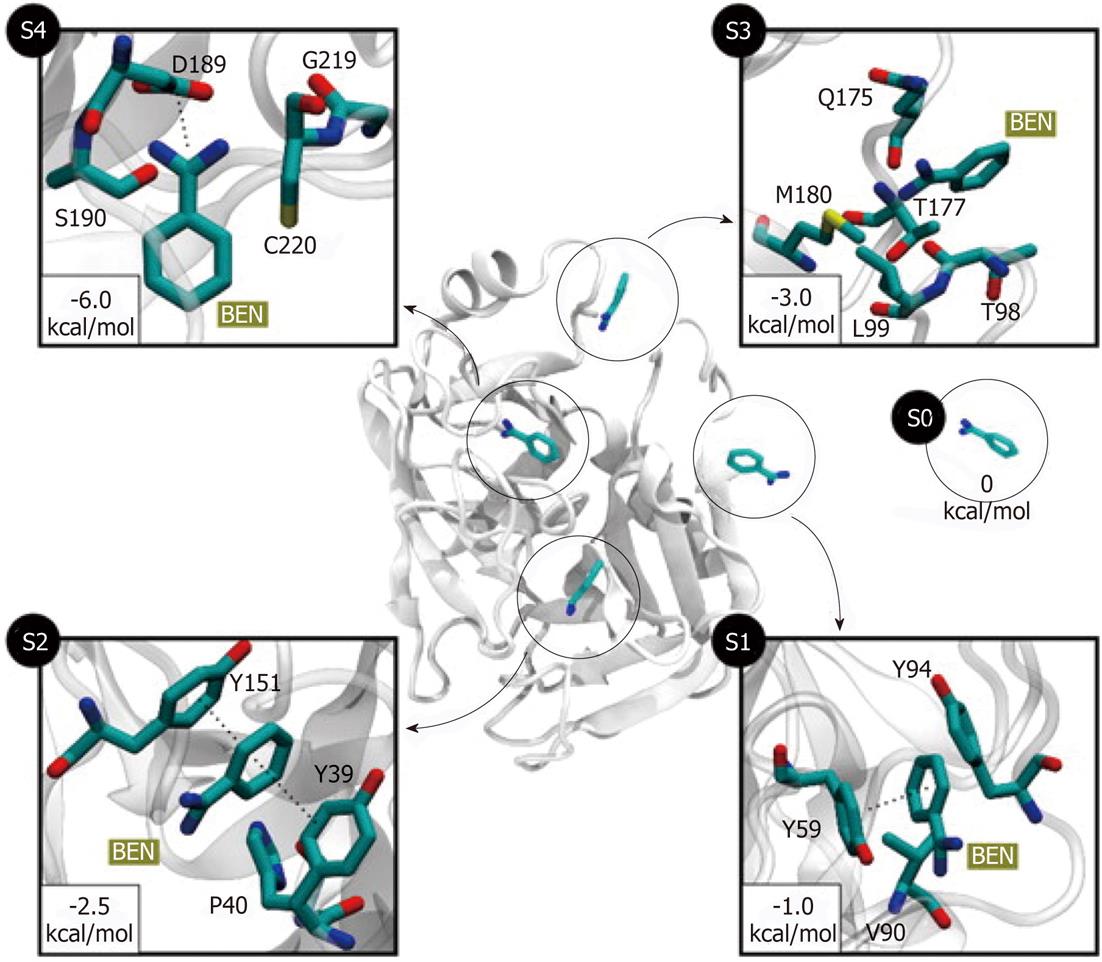
Figure 4 Five different metastable states (S0 to S4) identified for the benzamidine-trypsin complex[47].
The relative free energy between the unbound S0 and the bound S4 states is -6 kcal/mol. The most probable transition to the bound state S4 is from S3, since the barrier between two states is just 1.5 kcal/mol. In states S1 and S2, benzamidine is stabilized by π-π stacking interactions with Y151 and Y39 side chains. In S3, a hydrogen bond may be formed between the NH2 groups of benzamidine (only heavy atoms shown for clarity) and Q175 side chain, or by a cation-π interaction between the Q175 side chain and the benzamidine’s benzene ring. Reproduced with permission (Copyright 2011, PNAS).
-
Citation: Guliaev AB, Cheng S, Hang B. Protein dynamics
via computational microscope. World J Methodol 2012; 2(6): 42-49 - URL: https://www.wjgnet.com/2222-0682/full/v2/i6/42.htm
- DOI: https://dx.doi.org/10.5662/wjm.v2.i6.42


