©2012 Baishideng.
World J Methodol. Oct 26, 2012; 2(5): 33-41
Published online Oct 26, 2012. doi: 10.5662/wjm.v2.i5.33
Published online Oct 26, 2012. doi: 10.5662/wjm.v2.i5.33
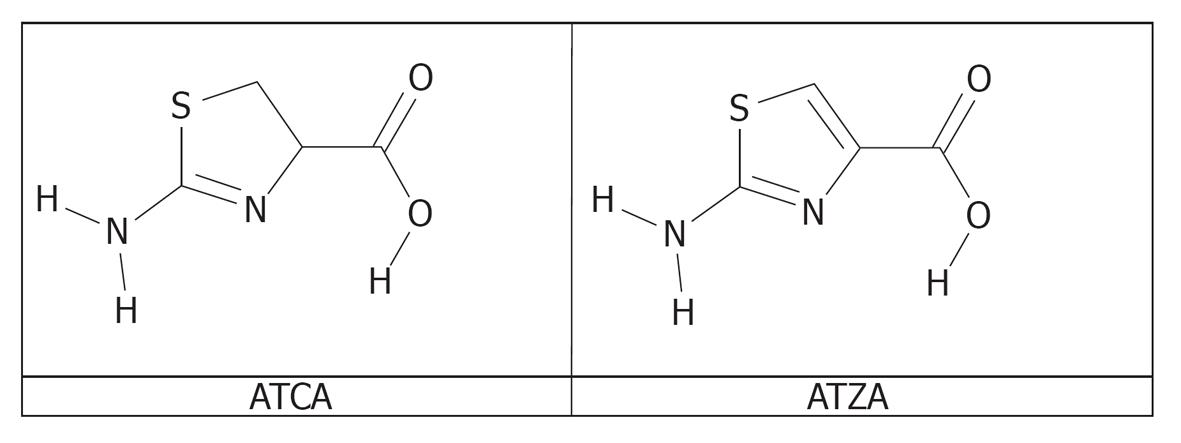
Figure 1 Molecular structures of 2-aminothiazoline-4-carboxylic acid and 2-aminothiazole-4-carboxylic acid.
2-aminothiazole-4-carboxylic acid (ATZA) served as an internal standard. ATCA: 2-aminothiazoline-4-carboxylic acid.
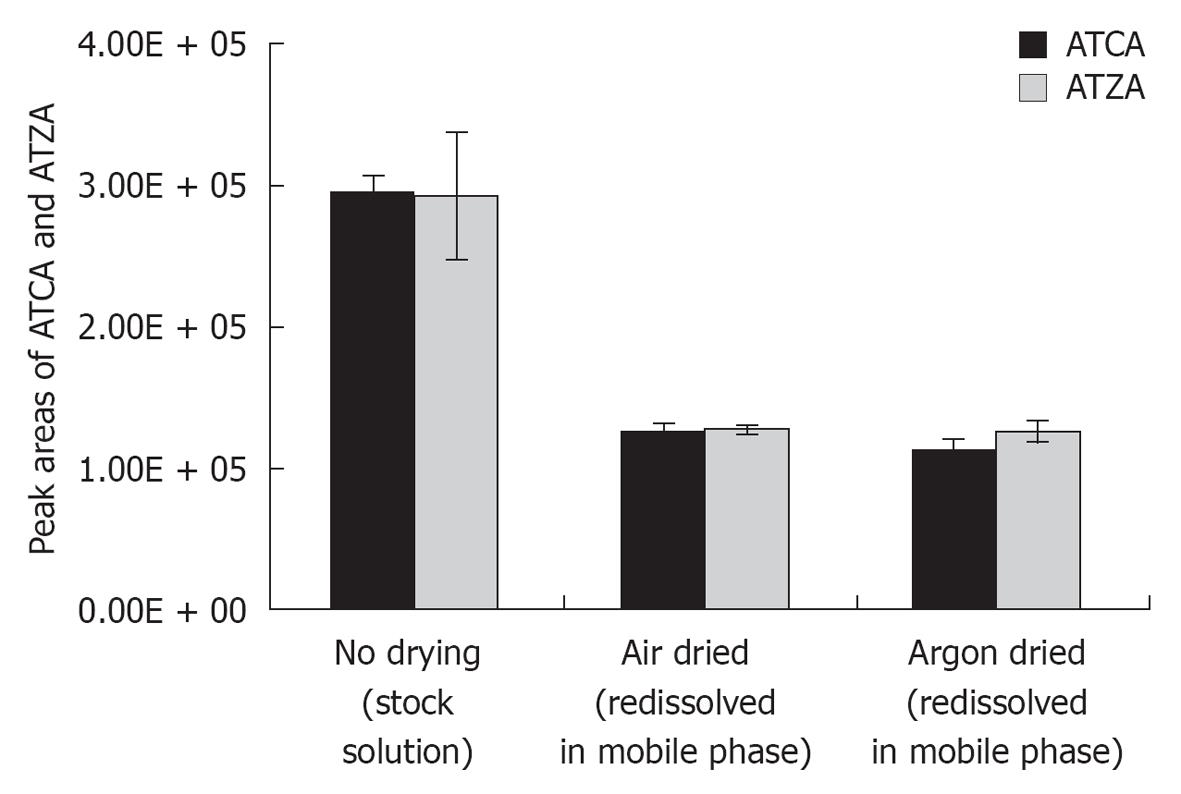
Figure 2 Comparison of 2-aminothiazoline-4-carboxylic acid and 2-aminothiazole-4-carboxylic acid signals detected by LC-MS/MS before and after evaporation of solvents by air or argon stream.
The decreased peak areas of 2-aminothiazoline-4-carboxylic acid (ATCA) and 2-aminothiazole-4-carboxylic acid (ATZA) in reconstituted solutions following air or argon drying were attributed to the variations of trifluoroacetic acid concentration in the stock solution and the freshly prepared mobile phase. Solvent evaporation with argon had similar effects to that with air. Therefore, the use of an inert gas was not needed for solvent evaporation.
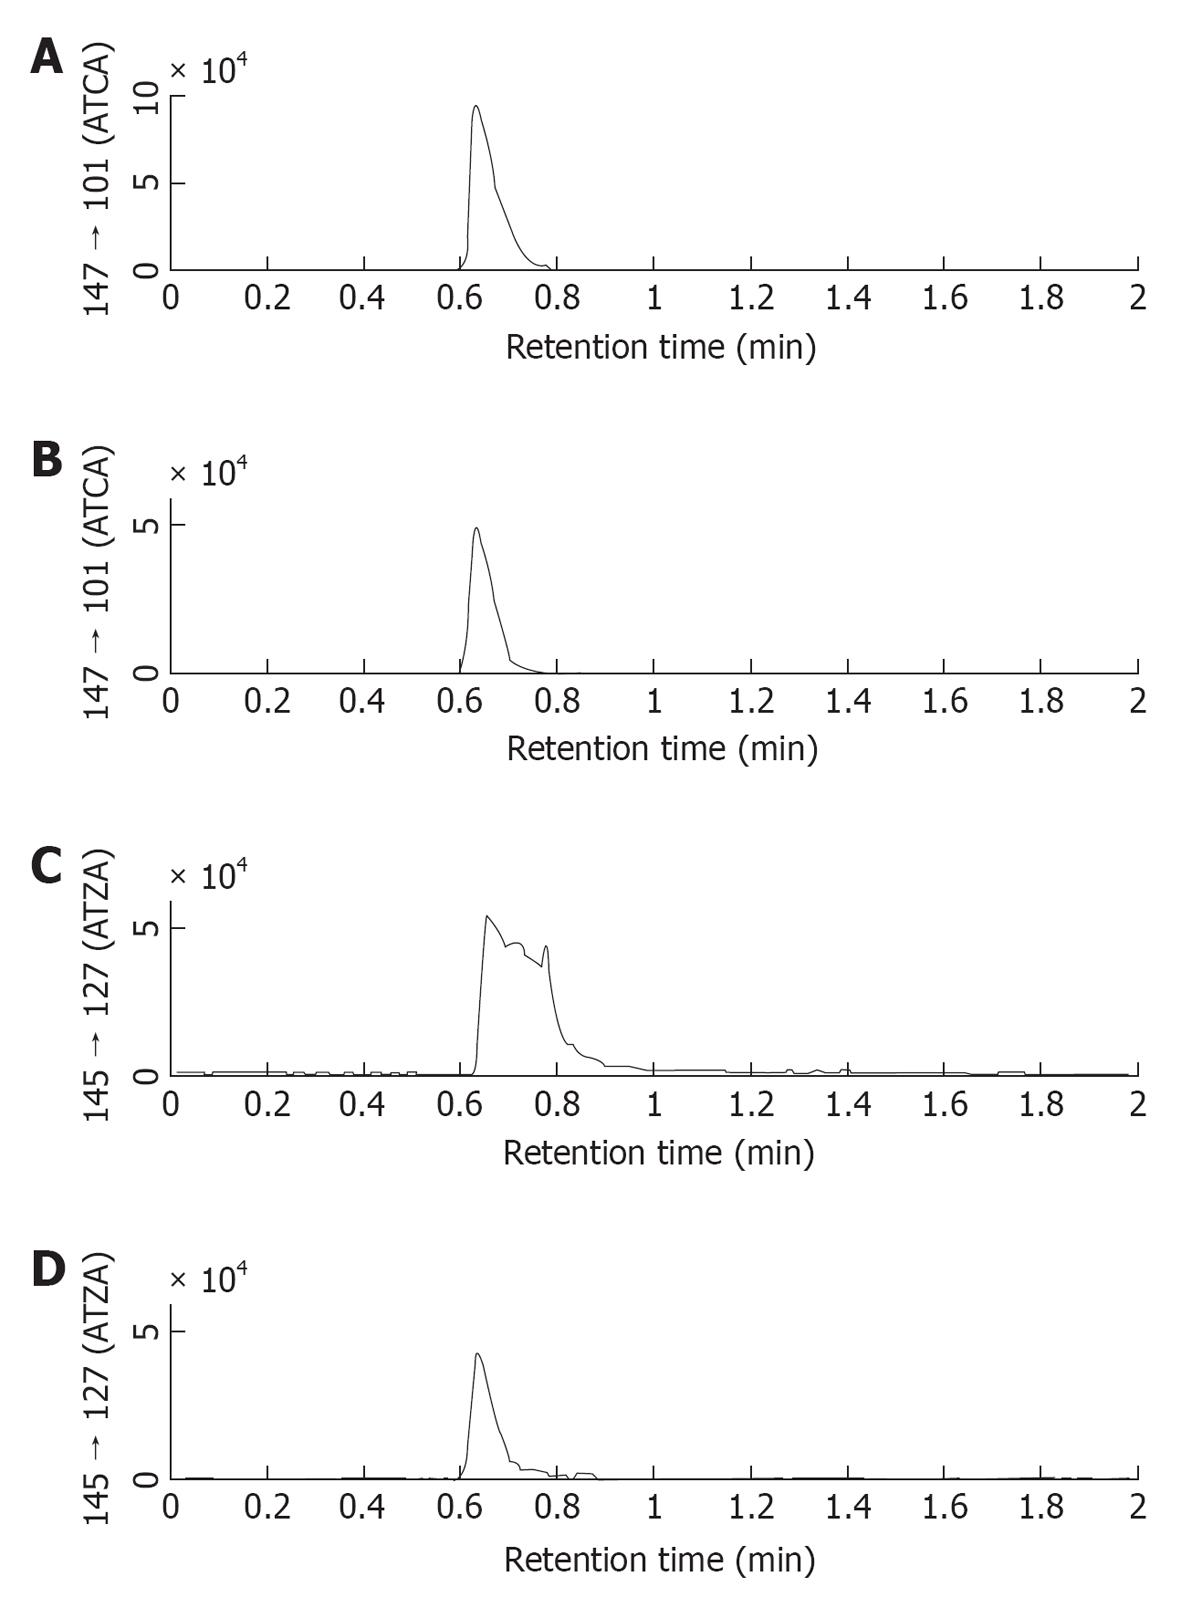
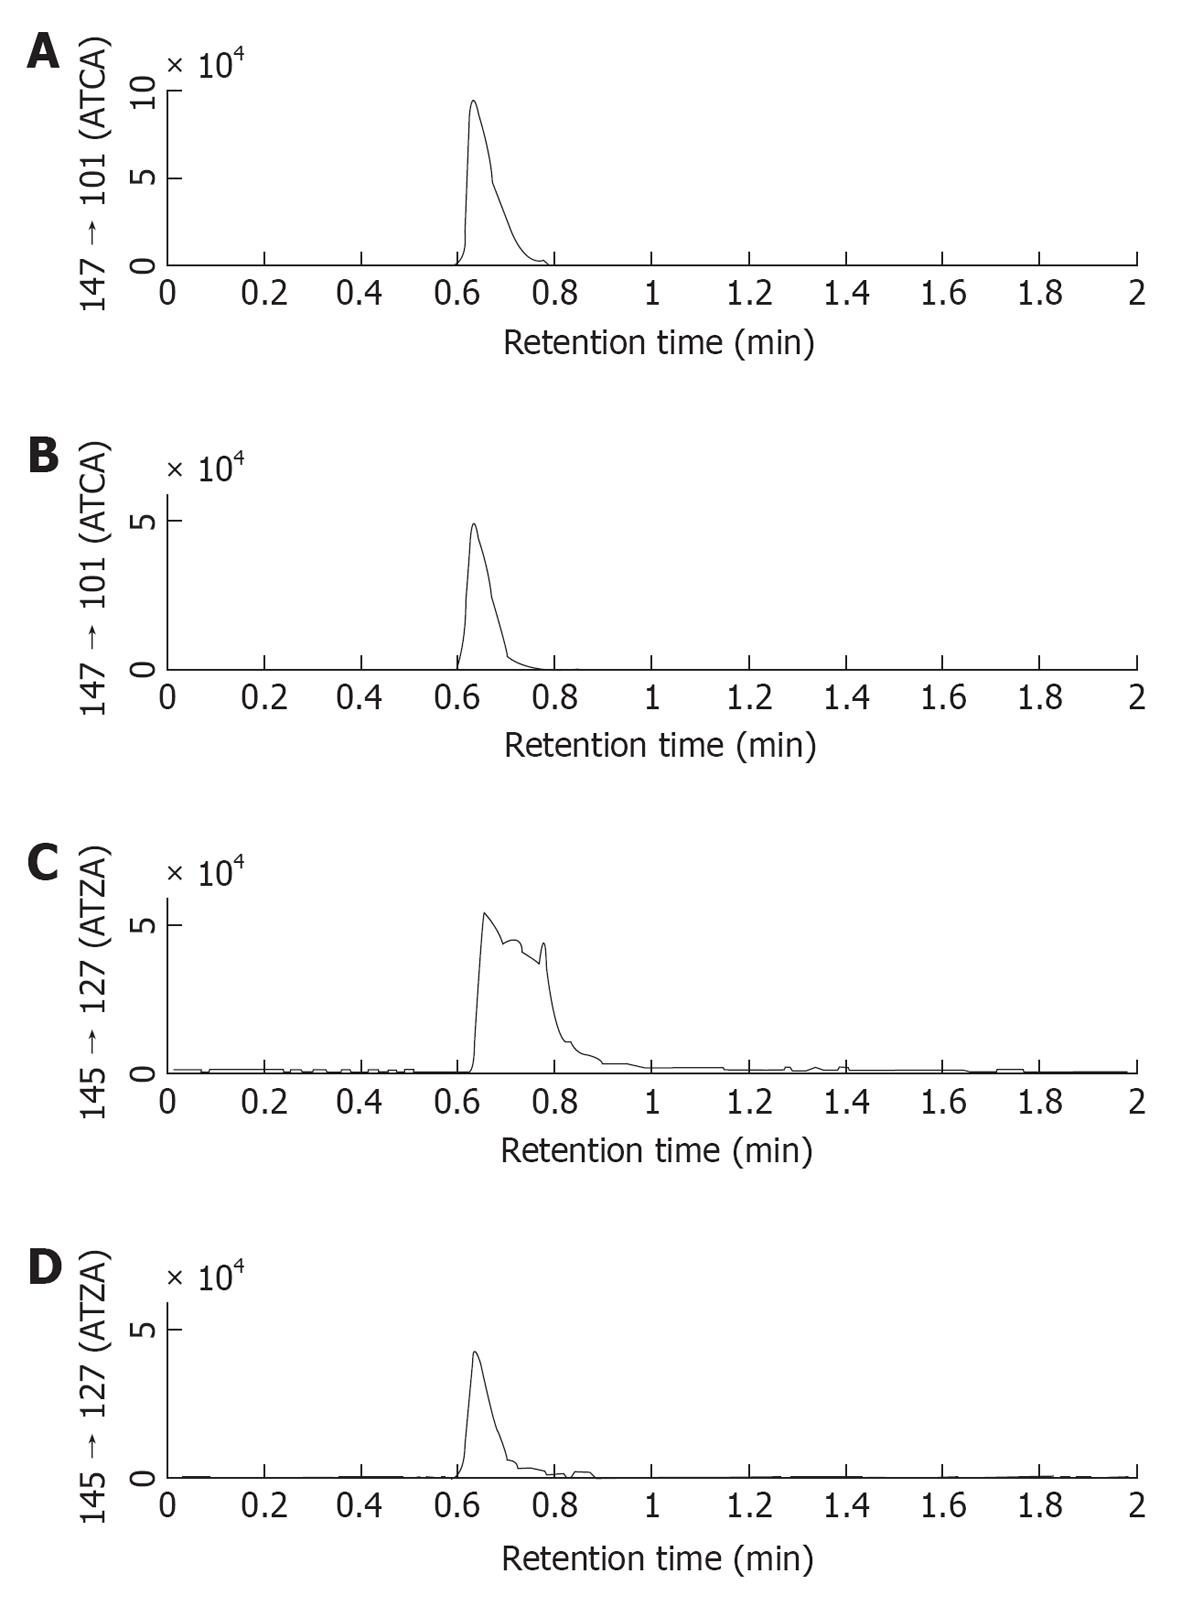
Figure 3 Comparison of chromatograms of 2-aminothiazoline-4-carboxylic acid and 2-aminothiazole-4-carboxylic acid obtained by using 0.
5% acetic acid/MeOH as mobile phase (A and C) and 0.5% trifluoroacetic acid/MeOH as mobile phases (B and D). When trifluoroacetic acid (TFA) was added to the mobile phase a good sharp 2-aminothiazole-4-carboxylic acid (ATZA) peak was detected. This result suggested that TFA was a more effective ion-paring reagent than acetic acid during the chromatography. Therefore, 0.5% TFA/MeOH was selected as the mobile phase, replacing the 0.5% acetic acid/MeOH mobile phase used in our prior work. ATCA: 2-aminothiazoline-4-carboxylic acid.
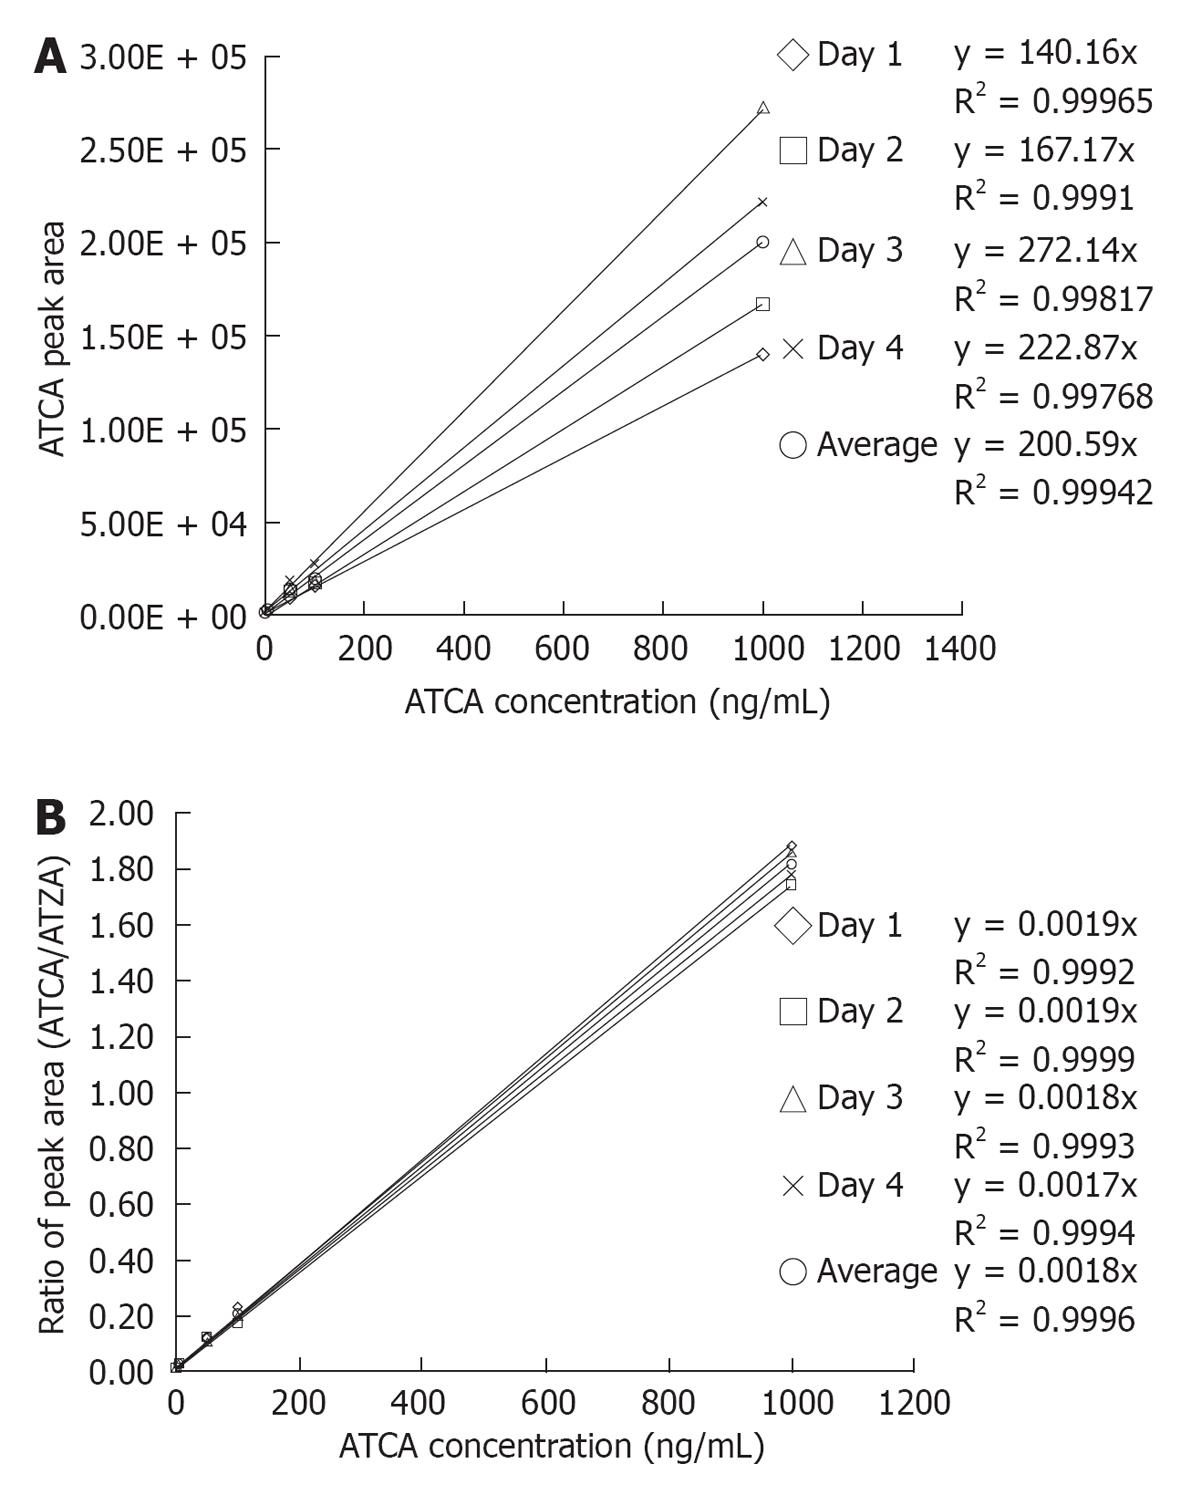
Figure 4 External calibration curves, without using 2-aminothiazole-4-carboxylic acid as the internal standard (A) and internal standard calibration curves constructed using 2-aminothiazole-4-carboxylic acid as the internal standard (B).
A: The external standard calibration curves showed good linearity over the tested 2-aminothiazoline-4-carboxylic acid (ATCA) concentration range with average R2 = 0.999 in a between-days experiment. The dashed lines show linear regression of calibration in each day. These linear regression lines yielded an average calibration equation y = (199 ± 60) × (n = 4), relative standard deviation (RSD) of calibration slopes = 30%. The high %RSD of the slopes indicated a typical ionization suppression effect of electrospray ionization. Internal calibration curves were next prepared by plotting the ratio of ATCA to 2-aminothiazole-4-carboxylic acid (ATZA) peak areas vs ATCA concentration; B: Ratioing to the internal standard peak area improved the reproducibility of the calibration curves. The dashed lines show calibration curves obtained on different days. These internal standard compensated calibration curves yielded an average calibration equation y = (0.018 ± 0.00007) × (n = 4), RSD = 4%. The decrease of the RSD from 30% (external calibration) to 4% (internal standard calibration) demonstrated that the internal standard, ATZA, enables effective compensation for ionization suppression and matrix effects, and substantially improves the precision with which ATCA can be quantified.
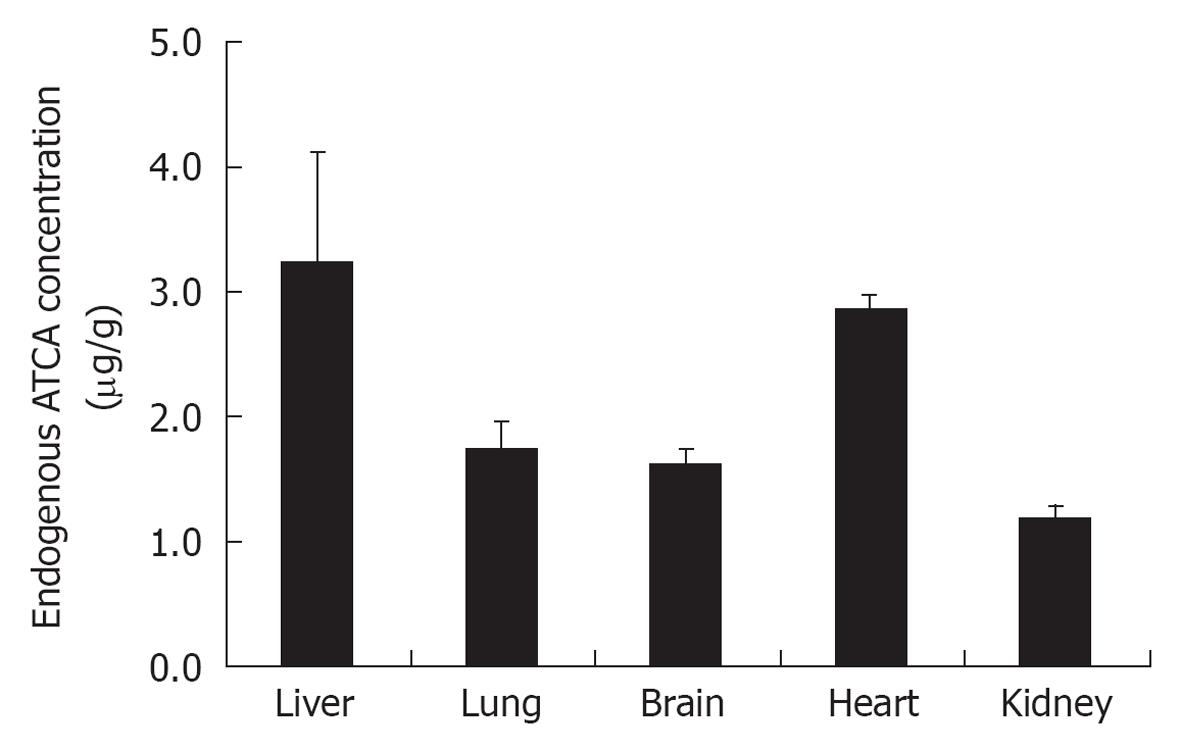
Figure 5 Endogenous level of 2-aminothiazoline-4-carboxylic acid in mice organs.
The endogenous levels of 2-aminothiazoline-4-carboxylic acid (ATCA) in different organs of mice were measured using the solid phase extraction procedure and LC-MS/MS conditions outlined above. Triplicate samples from healthy mice showed endogenous ATCA concentrations as follows: 1.2 ± 0.1 μg/g for kidney samples, 1.6 ± 0.1 μg/g for brain samples, 1.8 ± 0.2 μg/g for lung samples, 2.9 ± 0.1 μg/g for heart samples, and 3.6 ± 0.9 μg/g for liver samples.
Figure 6 2-aminothiazoline-4-carboxylic acid concentration in mice plasma after different doses of potassium cyanide (endogenous level = 0 mg/kg body weight dose of potassium cyanide).
Mice received three different sublethal doses (6, 8 and 10 mg/kg) of cyanide subcutaneously (3 mice/doses) and were terminated 15 min after cyanide exposure. A significant correlation of cyanide dose vs 2-aminothiazoline-4-carboxylic acid (ATCA) concentration in plasma samples was observed. ATCA concentration in mice plasma samples was increased from 189 ± 28 ng/mL (n = 3 mice) for endogenous level [0 mg/kg body weight dose of potassium cyanide (KCN)] to 413 ± 66 ng/mL (n = 3 mice) for 10 mg/kg body weight dose of KCN.
- Citation: Yu JC, Martin S, Nasr J, Stafford K, Thompson D, Petrikovics I. LC-MS/MS analysis of 2-aminothiazoline-4-carboxylic acid as a forensic biomarker for cyanide poisoning. World J Methodol 2012; 2(5): 33-41
- URL: https://www.wjgnet.com/2222-0682/full/v2/i5/33.htm
- DOI: https://dx.doi.org/10.5662/wjm.v2.i5.33


