©2012 Baishideng Publishing Group Co.
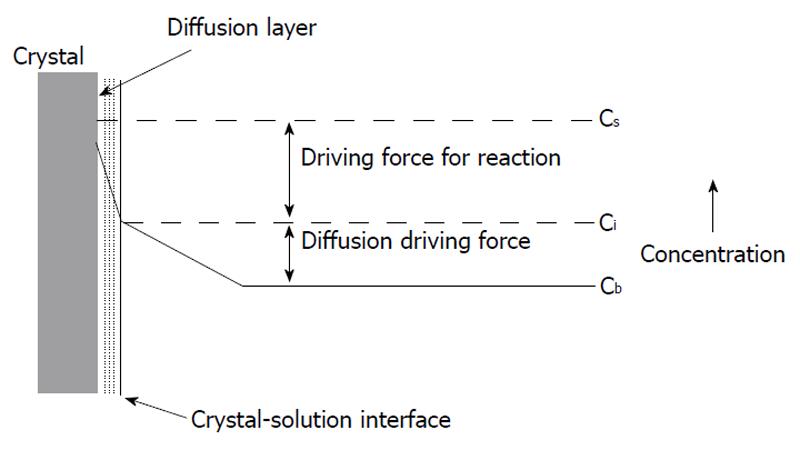
Figure 1 A dissolution process according to the diffusion and kinetically controlled models.
Cs: Solute concentration on the surface; Ci: Solute concentration on the interface; Cb: Solute concentration in bulk. Reprinted from Ref.[34] with permission.
Figure 2 A dissolution process according to the mono- and polynuclear models.
A: Mononuclear model; B: Polynuclear model in one crystal step; C: Polynuclear model in multiple steps: birth and spread; D: Spiral model. Reprinted from Ref.[34] with permission.
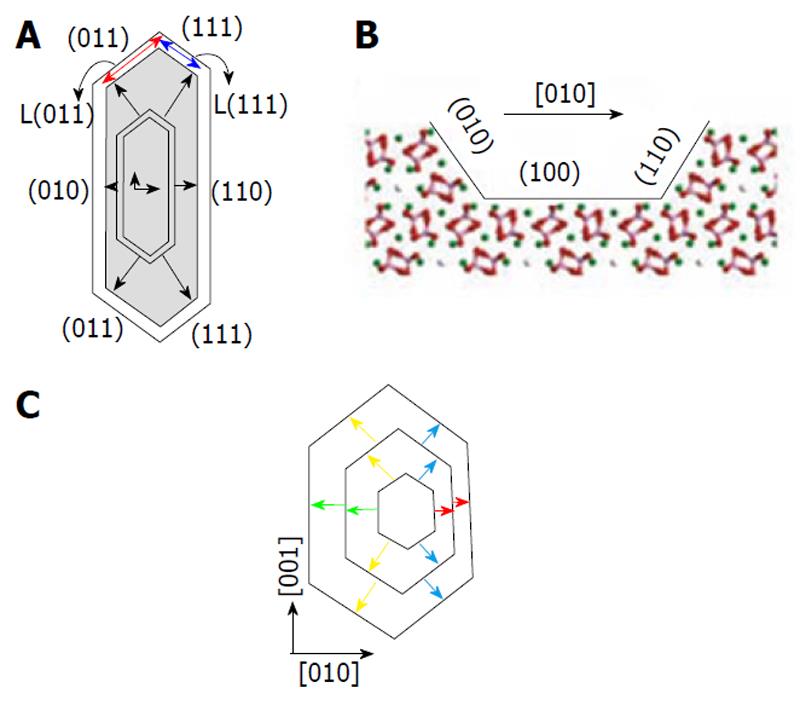
Figure 3 A typical etch pit on the surface of calcium apatites.
A: Top view and a model of its evolution during dissolution. Arrows represent relative step velocities displaying different facets; B: View through the [001] direction in the (100) surface. The exposed step faces can be seen to be un-equivalent owing to the opposite orientations of the orthophosphate groups. Reprinted from Ref. [118] with permission; C: Schematic of the evolution of hexagonal etch pits. Four differently colored arrows represent relative step velocities. Reprinted from Ref. [120] with permission.
Figure 4 A schematic representation of surface protonation of apatites at different solution pH.
Reprinted from Ref. [119] with permission.
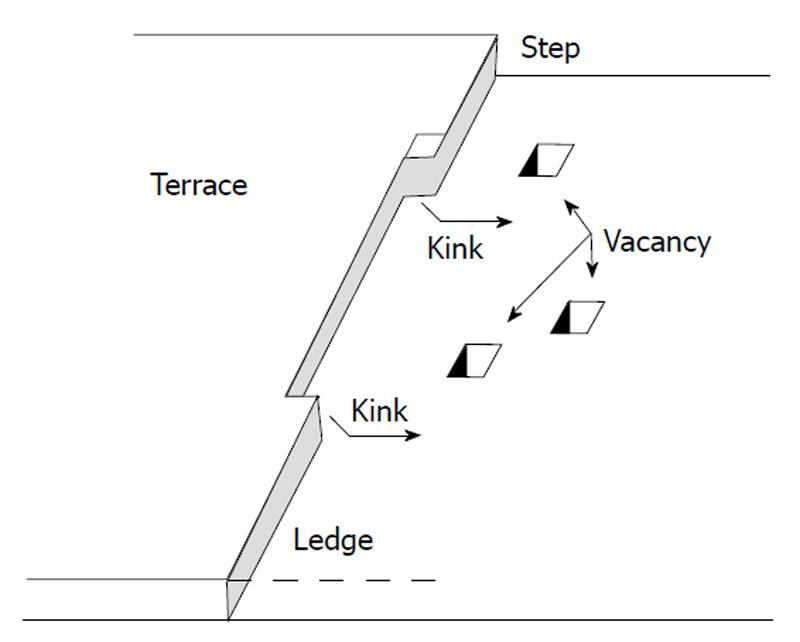
Figure 5 Surface of a crystal according to Kossel[168].
The various types of imperfections are shown. Reprinted from Ref. [34] with permission.
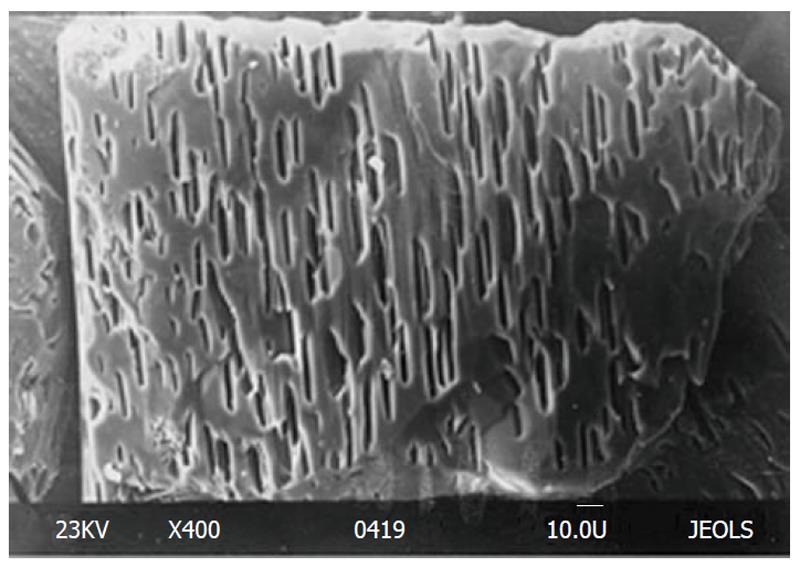
Figure 6 An example of etched crystal surface of natural fluorapatite with typical hexagonal etch pits.
Bar 10 μm
- Citation: Dorozhkin SV. Dissolution mechanism of calcium apatites in acids: A review of literature. World J Methodol 2012; 2(1): 1-17
- URL: https://www.wjgnet.com/2222-0682/full/v2/i1/1.htm
- DOI: https://dx.doi.org/10.5662/wjm.v2.i1.1


