
















Copyright: ©Author(s) 2026.
World J Methodol. Sep 20, 2026; 16(3): 117891
Published online Sep 20, 2026. doi: 10.5662/wjm.117891
Published online Sep 20, 2026. doi: 10.5662/wjm.117891
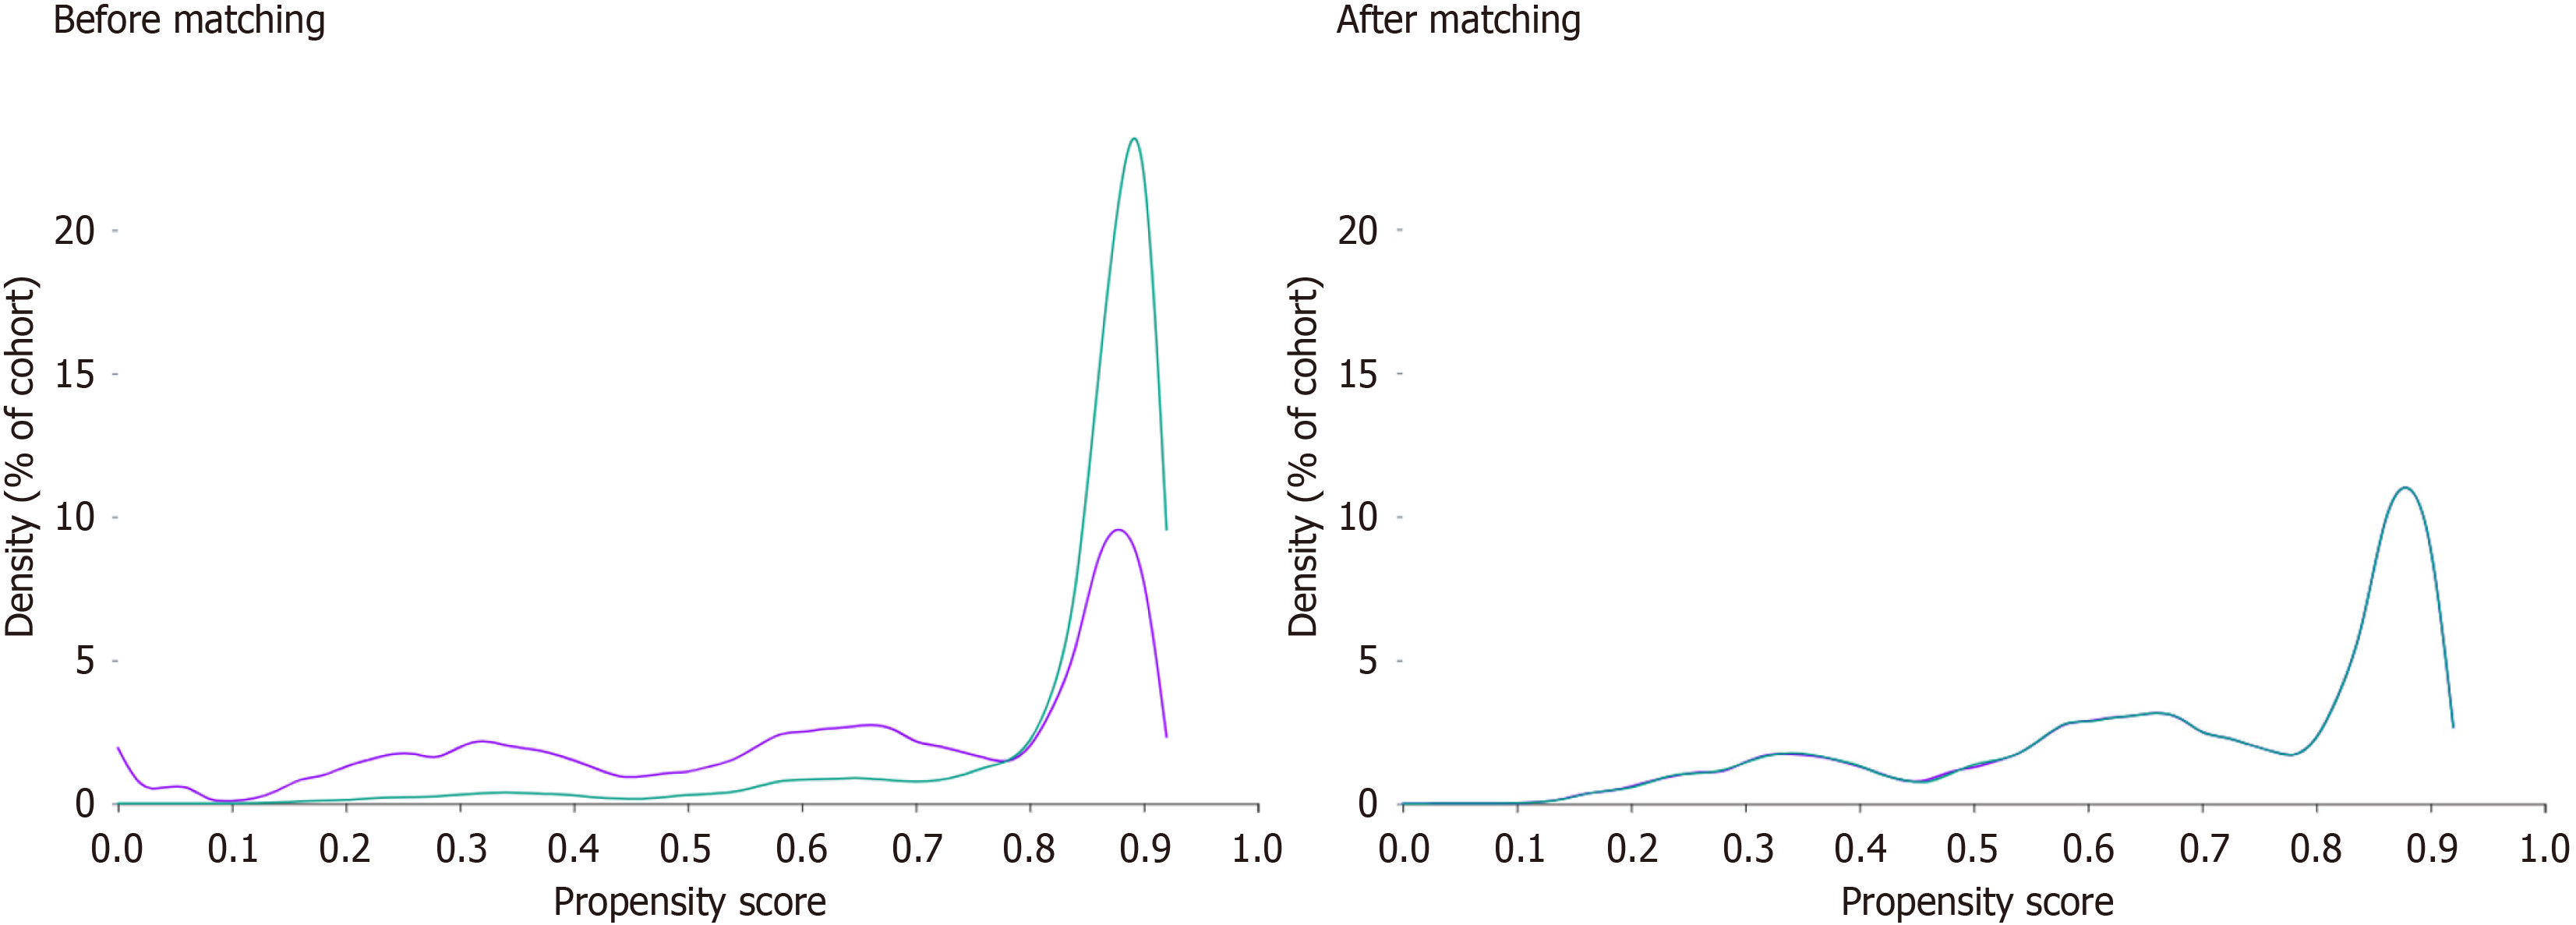
Figure 1
Propensity score density graph (before and after matching).
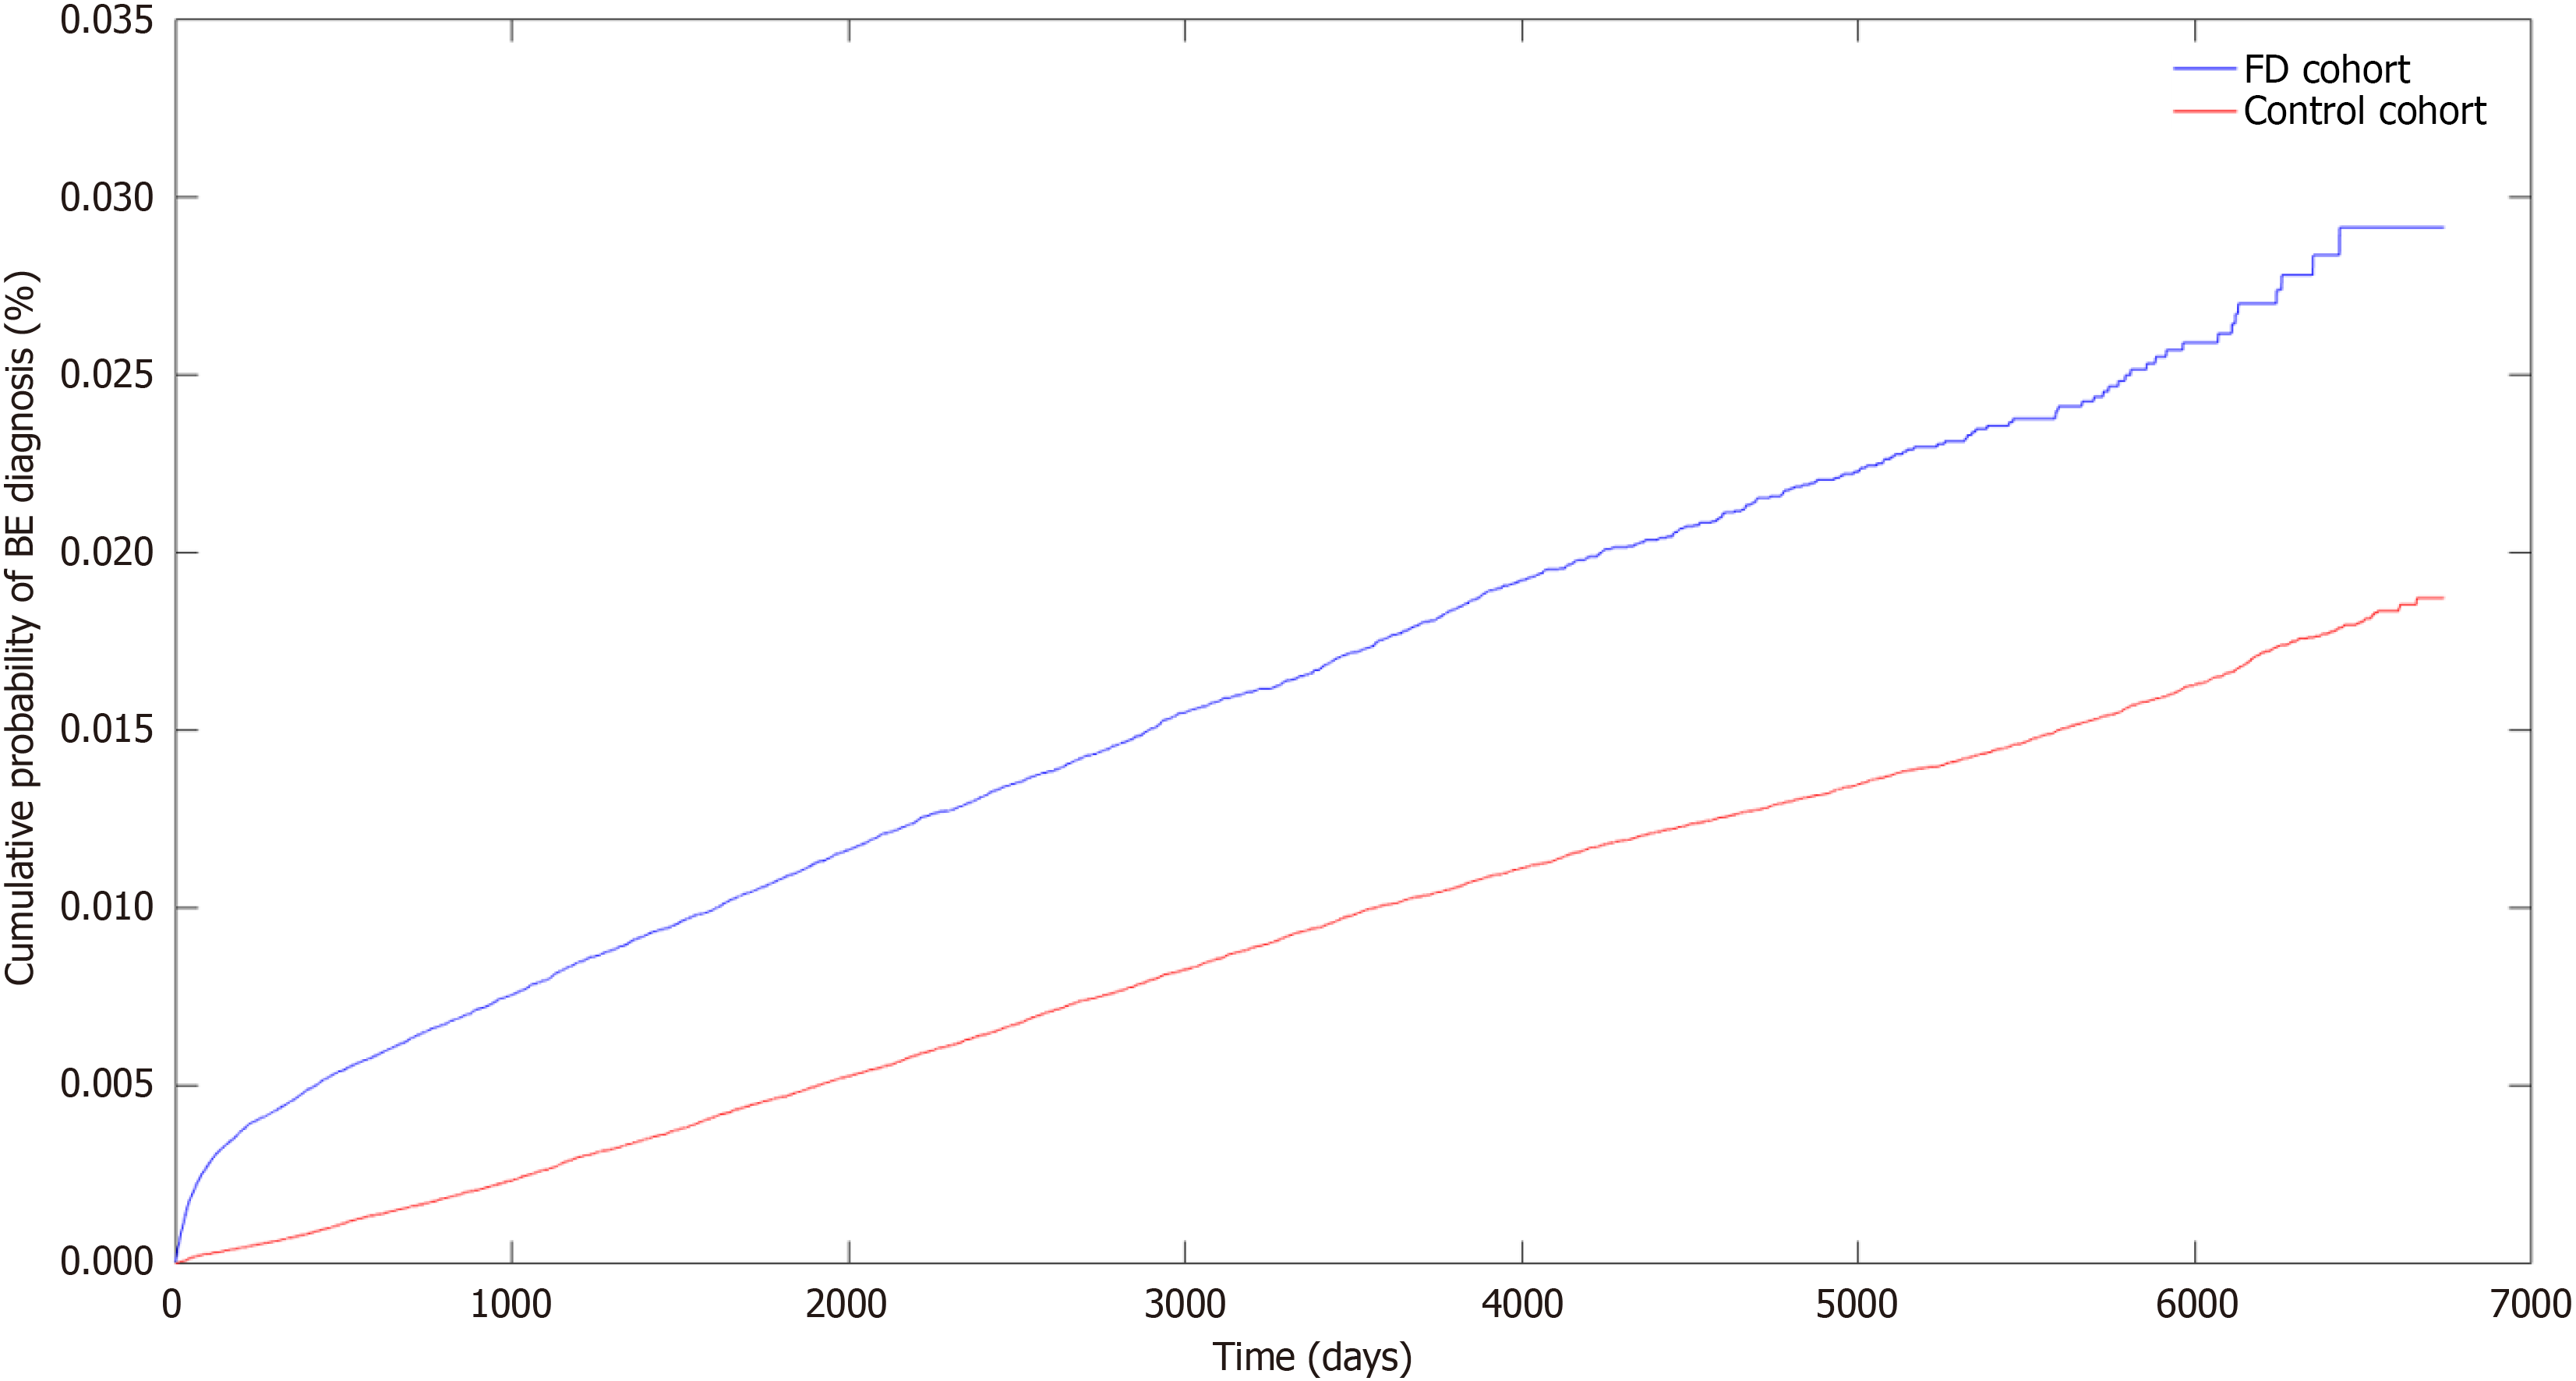
Figure 2 Kaplan-Meier curve for Barrett’s esophagus.
FD: Functional dyspepsia; BE: Barrett’s esophagus.
- Citation: Maan MHA, Maan S, Waleed M, Ahmad MM, Goyal RM, Sohail AH, Abboud Y, Khan S, Gayam S, Kupec J. Functional dyspepsia and risk of Barrett’s esophagus and dysplasia: A propensity-matched multicenter retrospective cohort study. World J Methodol 2026; 16(3): 117891
- URL: https://www.wjgnet.com/2222-0682/full/v16/i3/117891.htm
- DOI: https://dx.doi.org/10.5662/wjm.117891