
















Copyright: ©Author(s) 2026.
World J Methodol. Sep 20, 2026; 16(3): 117220
Published online Sep 20, 2026. doi: 10.5662/wjm.117220
Published online Sep 20, 2026. doi: 10.5662/wjm.117220
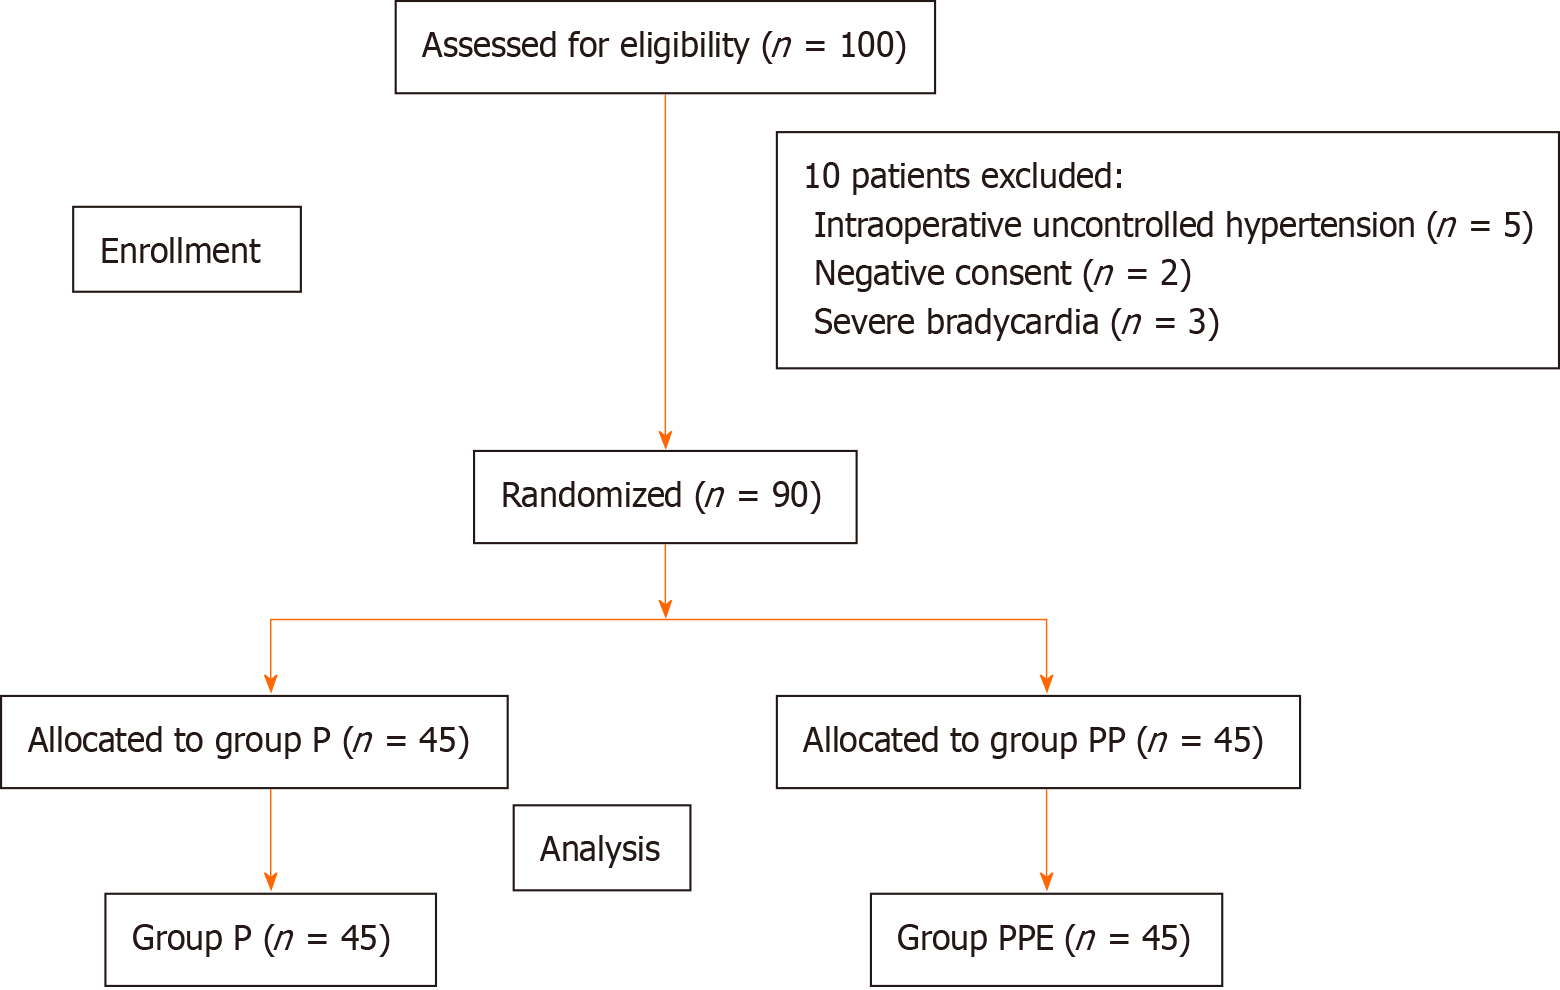
Figure 1 CONSORT flow diagram showing patient screening, exclusions, randomization, allocation, follow-up, and inclusion in the final analysis.
P: Propofol; PPE: Propofol-phenylephrine.
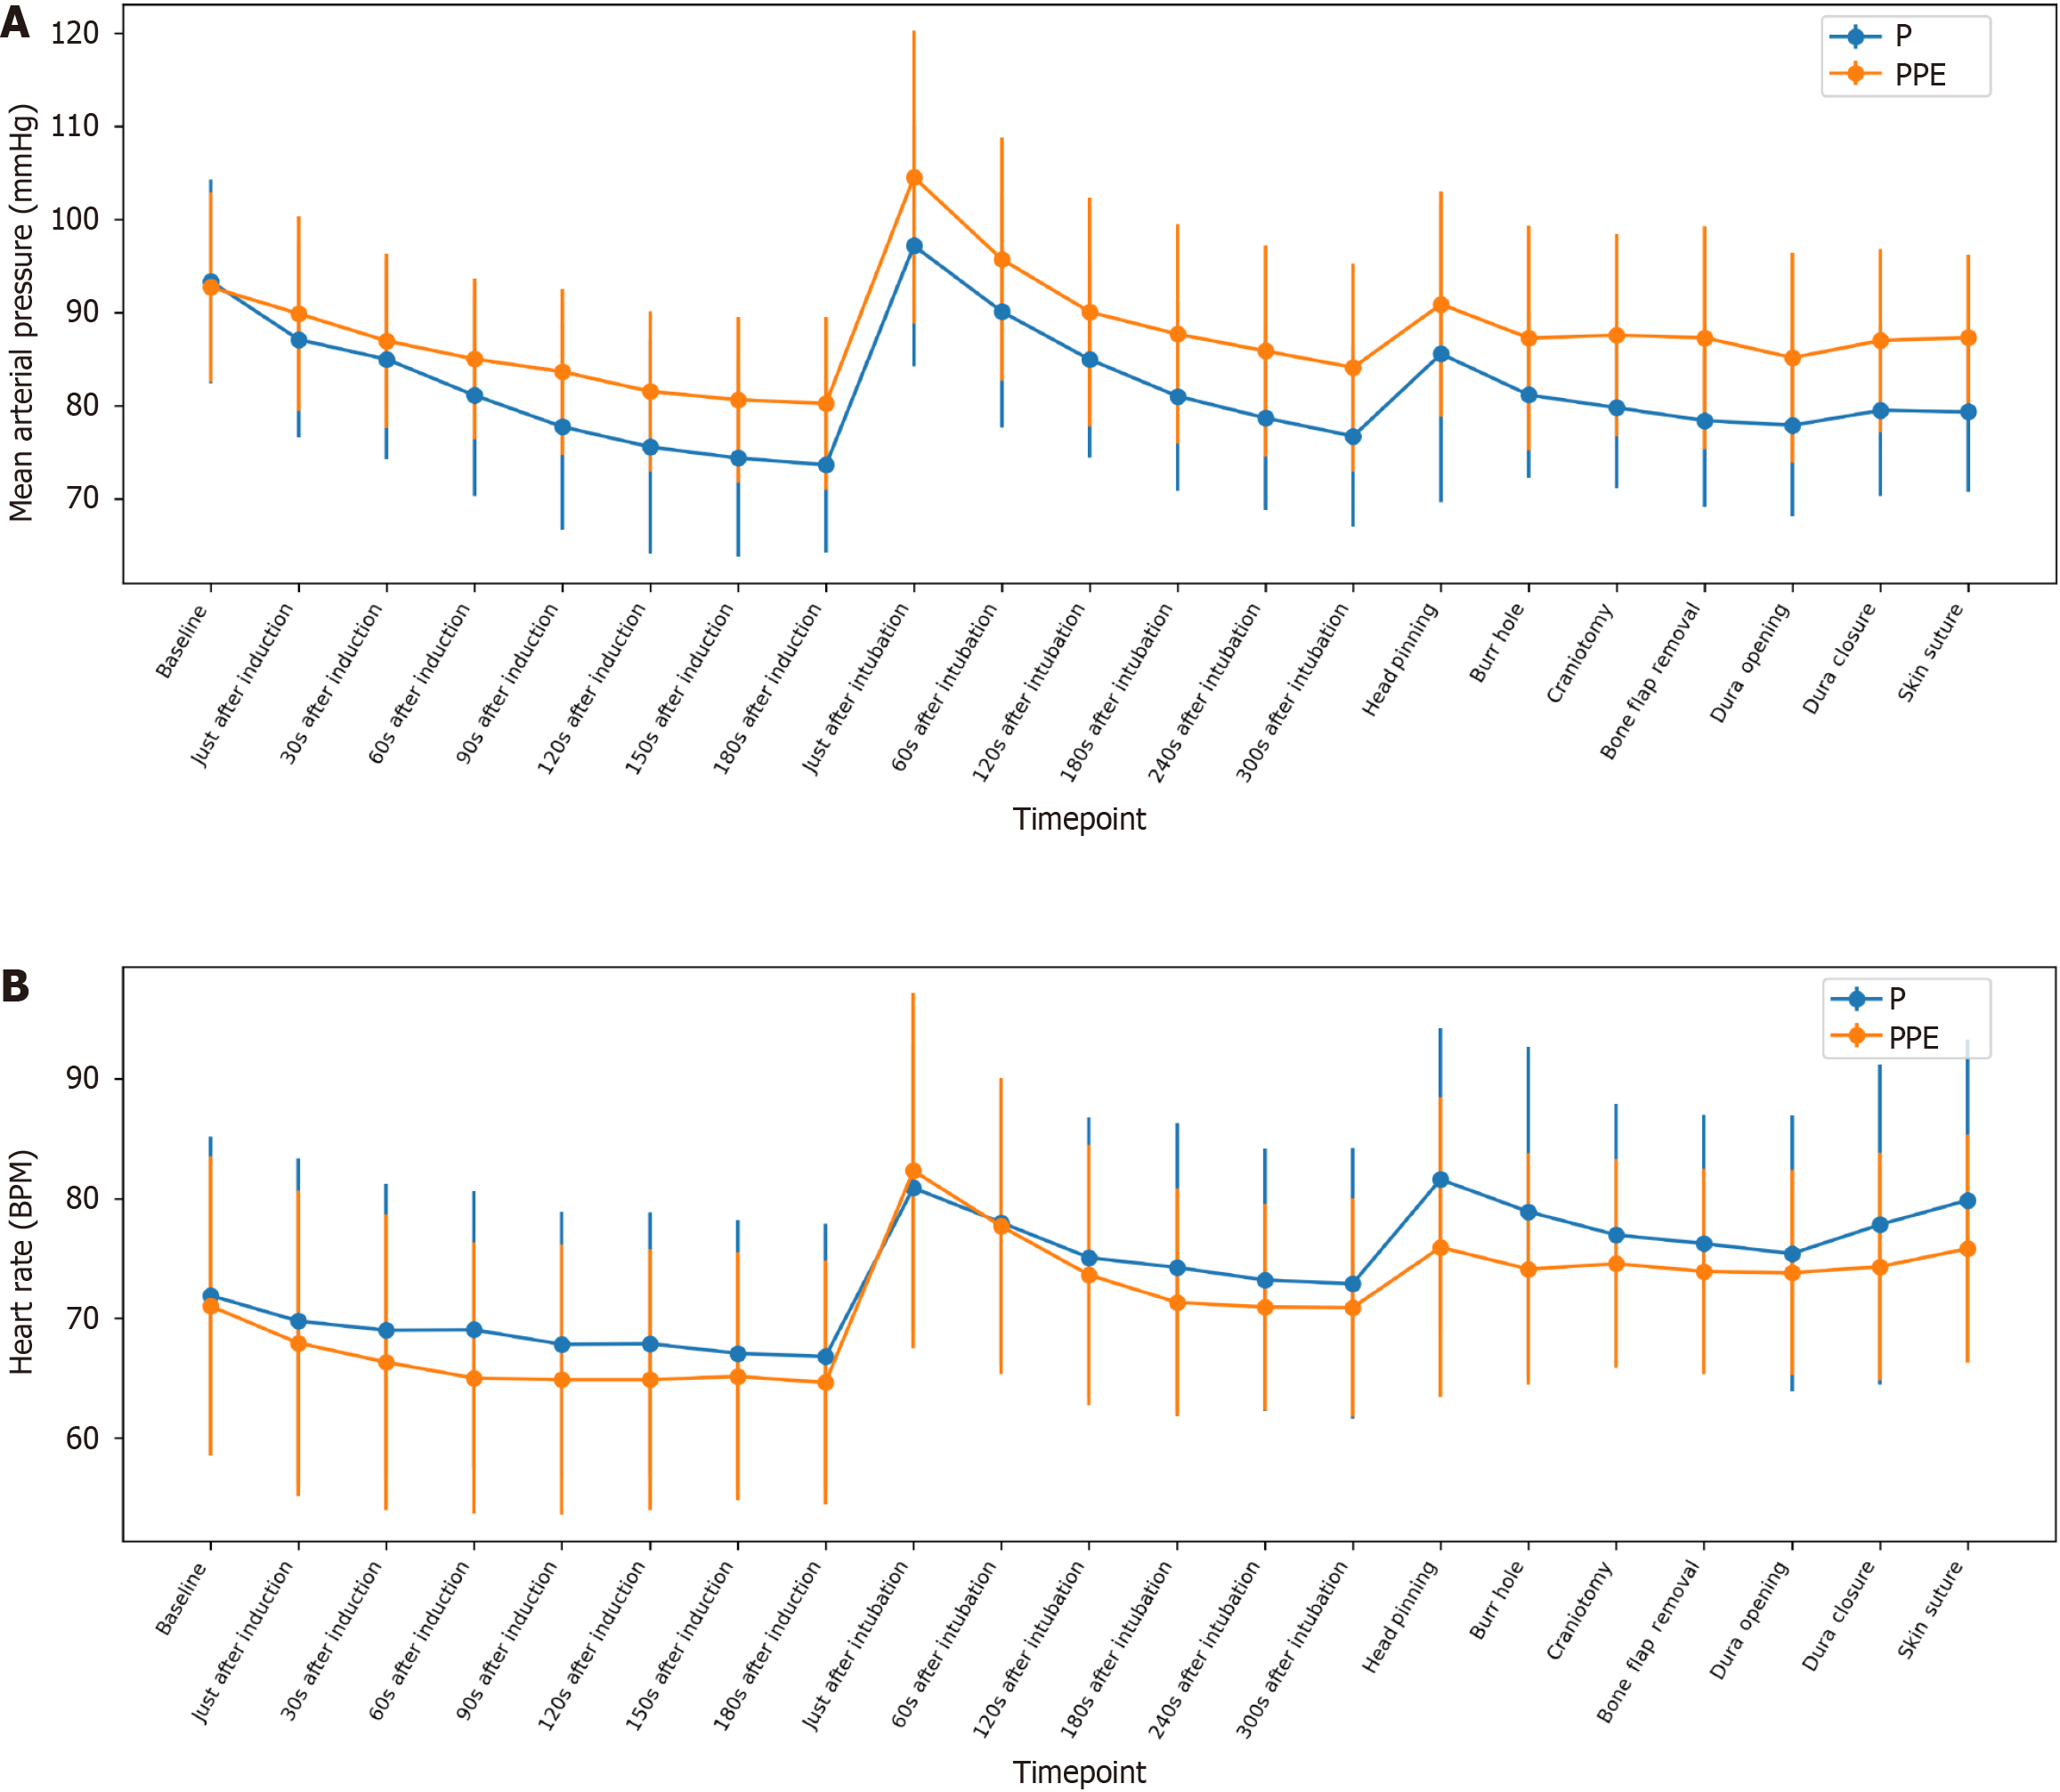
Figure 2 Line graph.
A: Line graph showing peri-induction and intraoperative trends in mean arterial pressure in group propofol and group propofol-phenylephrine; B: Line graph showing peri-induction and intraoperative trends in heart rate in group P (propofol) and group propofol-phenylephrine. P: Propofol; PPE: Propofol-phenylephrine.
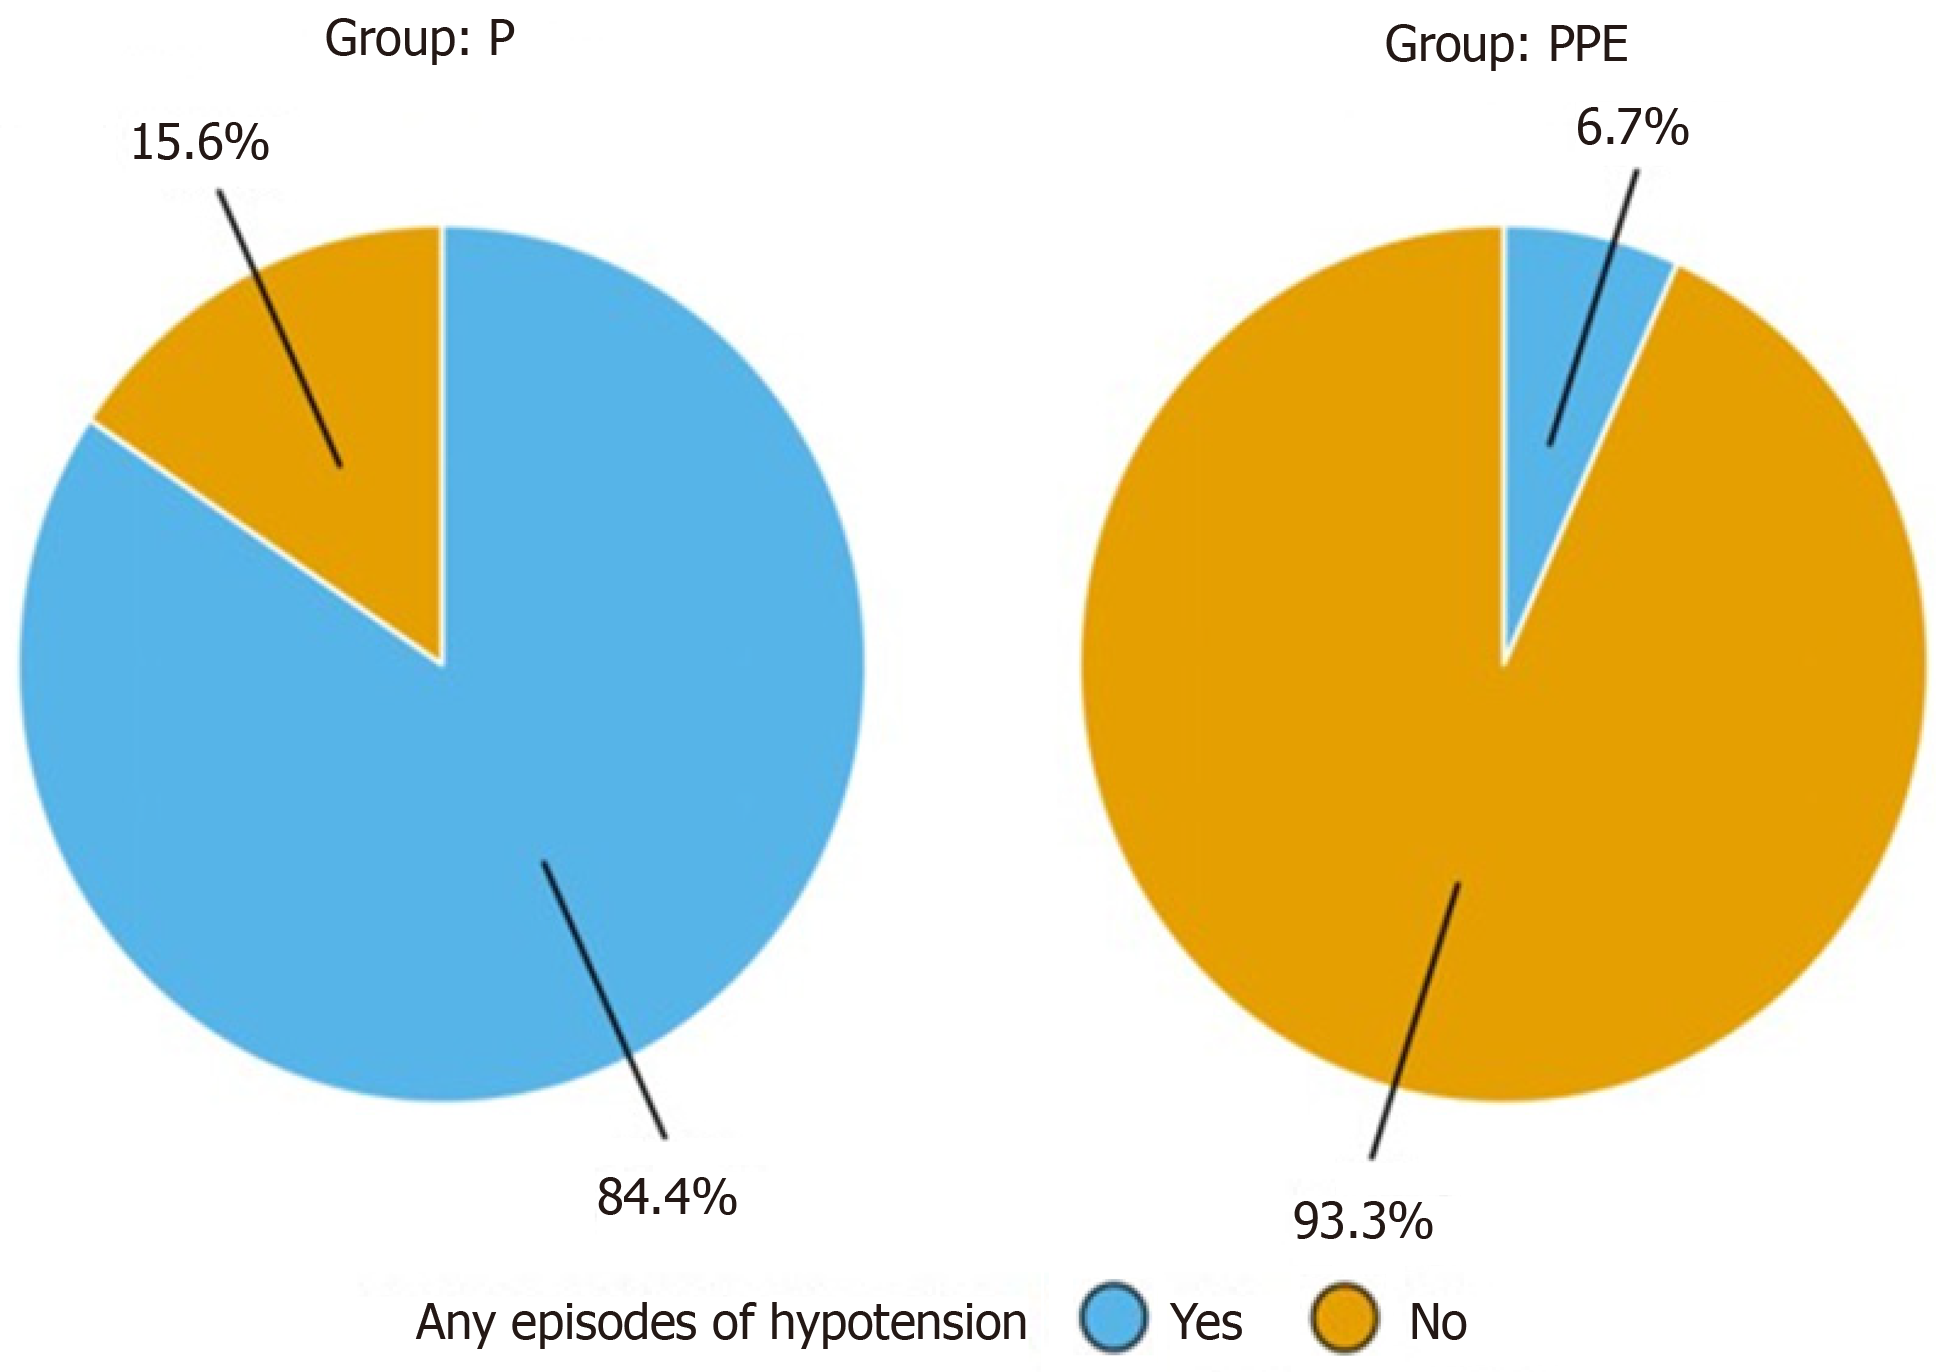
Figure 3 Pie charts showing the incidence of hypotension in group P (propofol) and group propofol-phenylephrine.
P: Propofol; PPE: Propofol-phenylephrine.
- Citation: Thotungal R, Kaushal A, Agrawal A, Jain A, Waindeskar V, Haldar R, Lokho P. Comparison of propofol alone vs propofol-phenylephrine combination for intraoperative hemodynamic stability in glioma surgery. World J Methodol 2026; 16(3): 117220
- URL: https://www.wjgnet.com/2222-0682/full/v16/i3/117220.htm
- DOI: https://dx.doi.org/10.5662/wjm.117220