Copyright
©The Author(s) 2025.
World J Methodol. Dec 20, 2025; 15(4): 107468
Published online Dec 20, 2025. doi: 10.5662/wjm.v15.i4.107468
Published online Dec 20, 2025. doi: 10.5662/wjm.v15.i4.107468
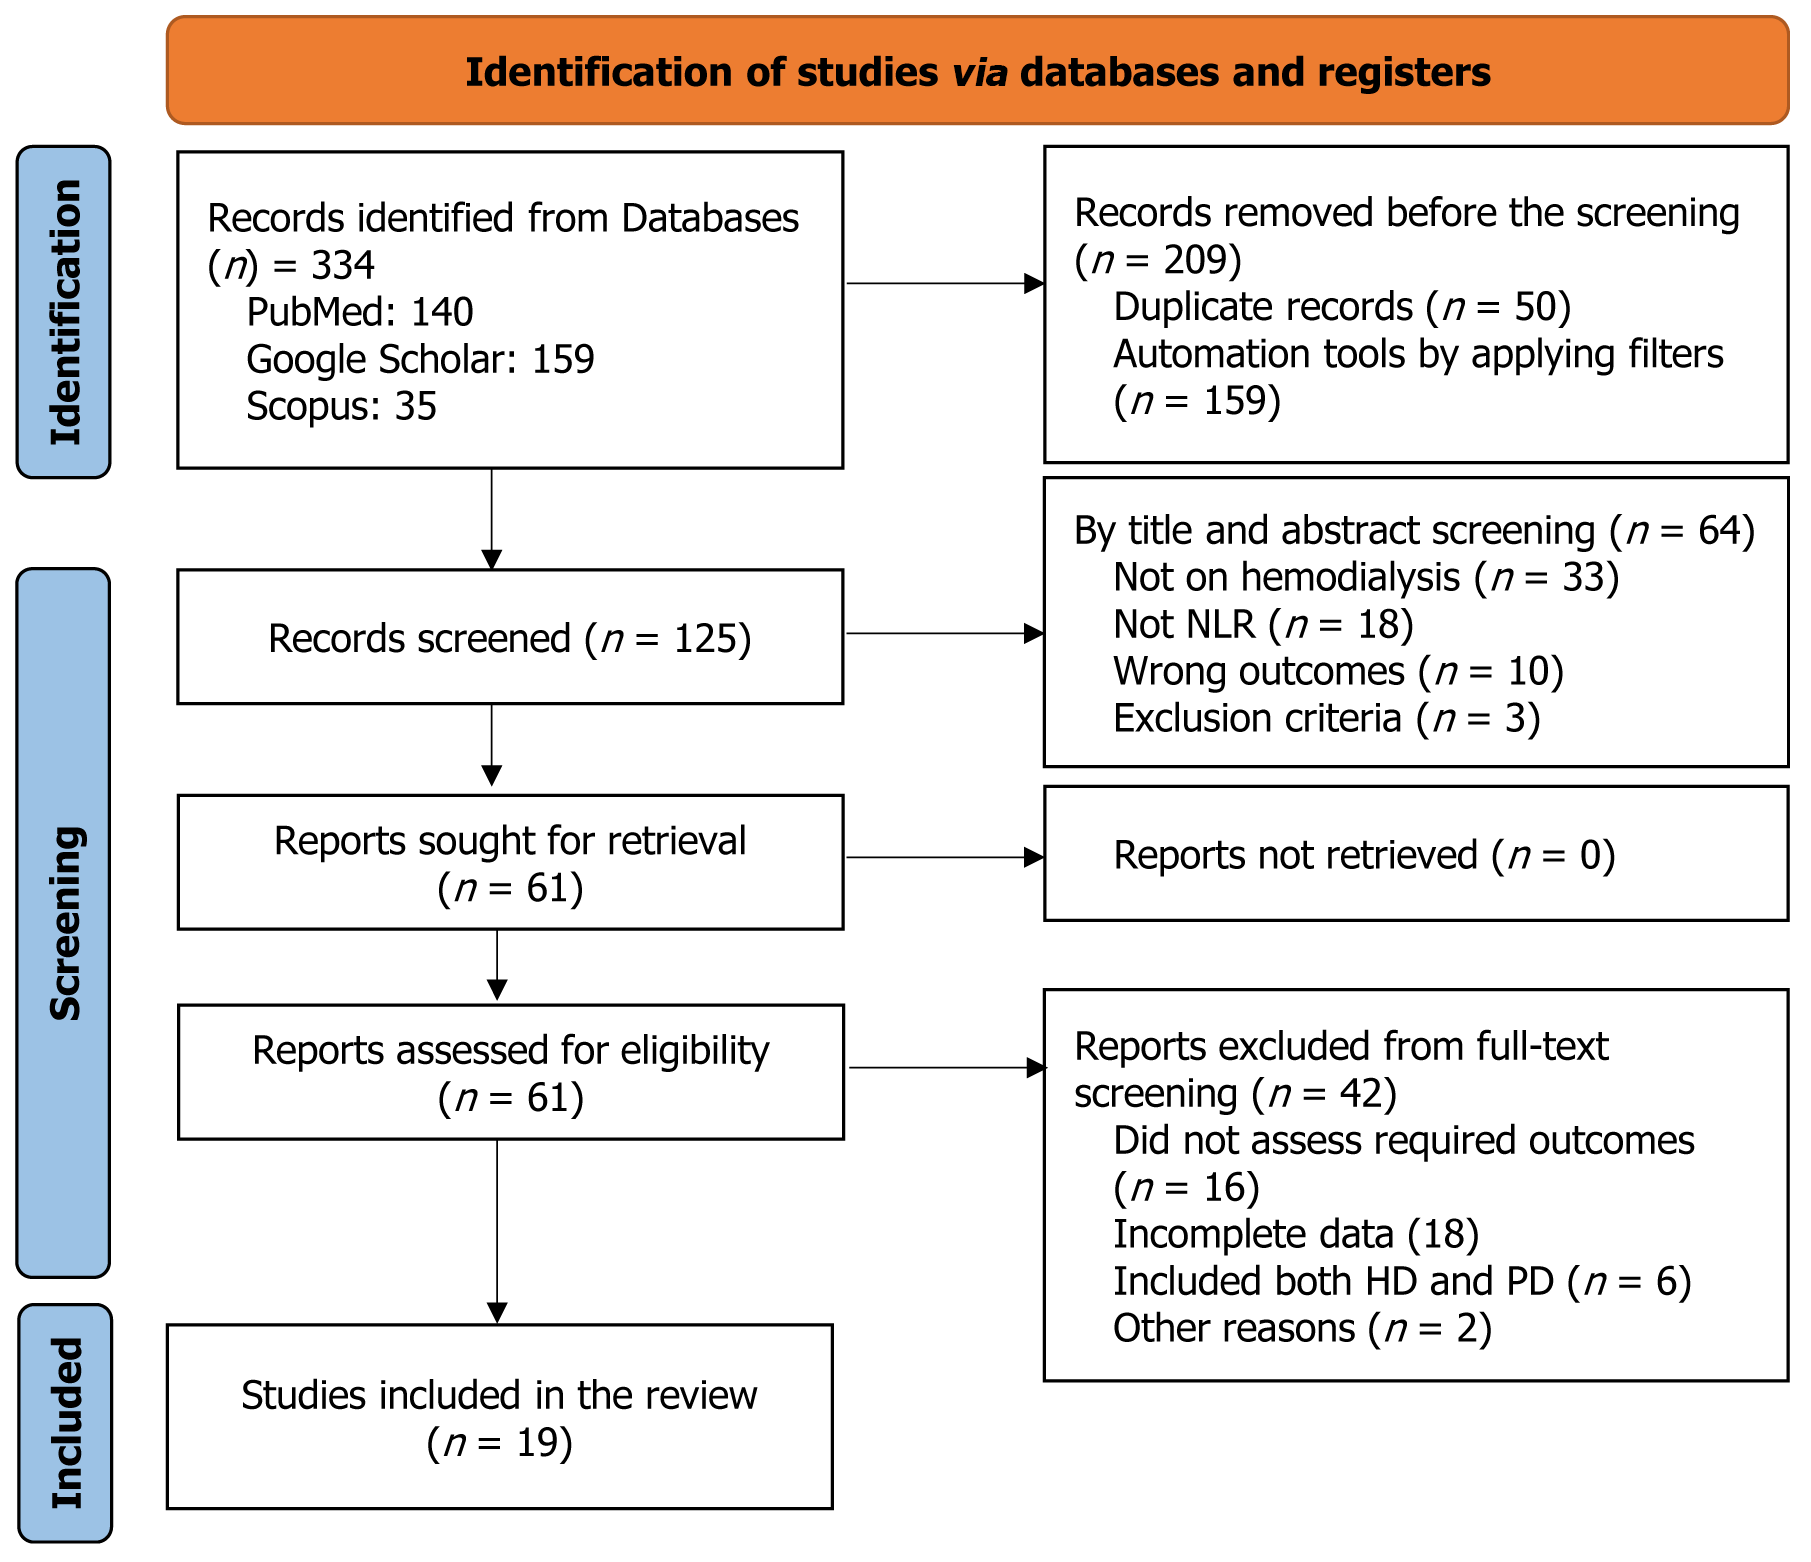
Figure 1 PRISMA flow chart.
HD: Hemodialysis; PD: Peritoneal dialysis; NLR: Neutrophil-lymphocyte ratio.
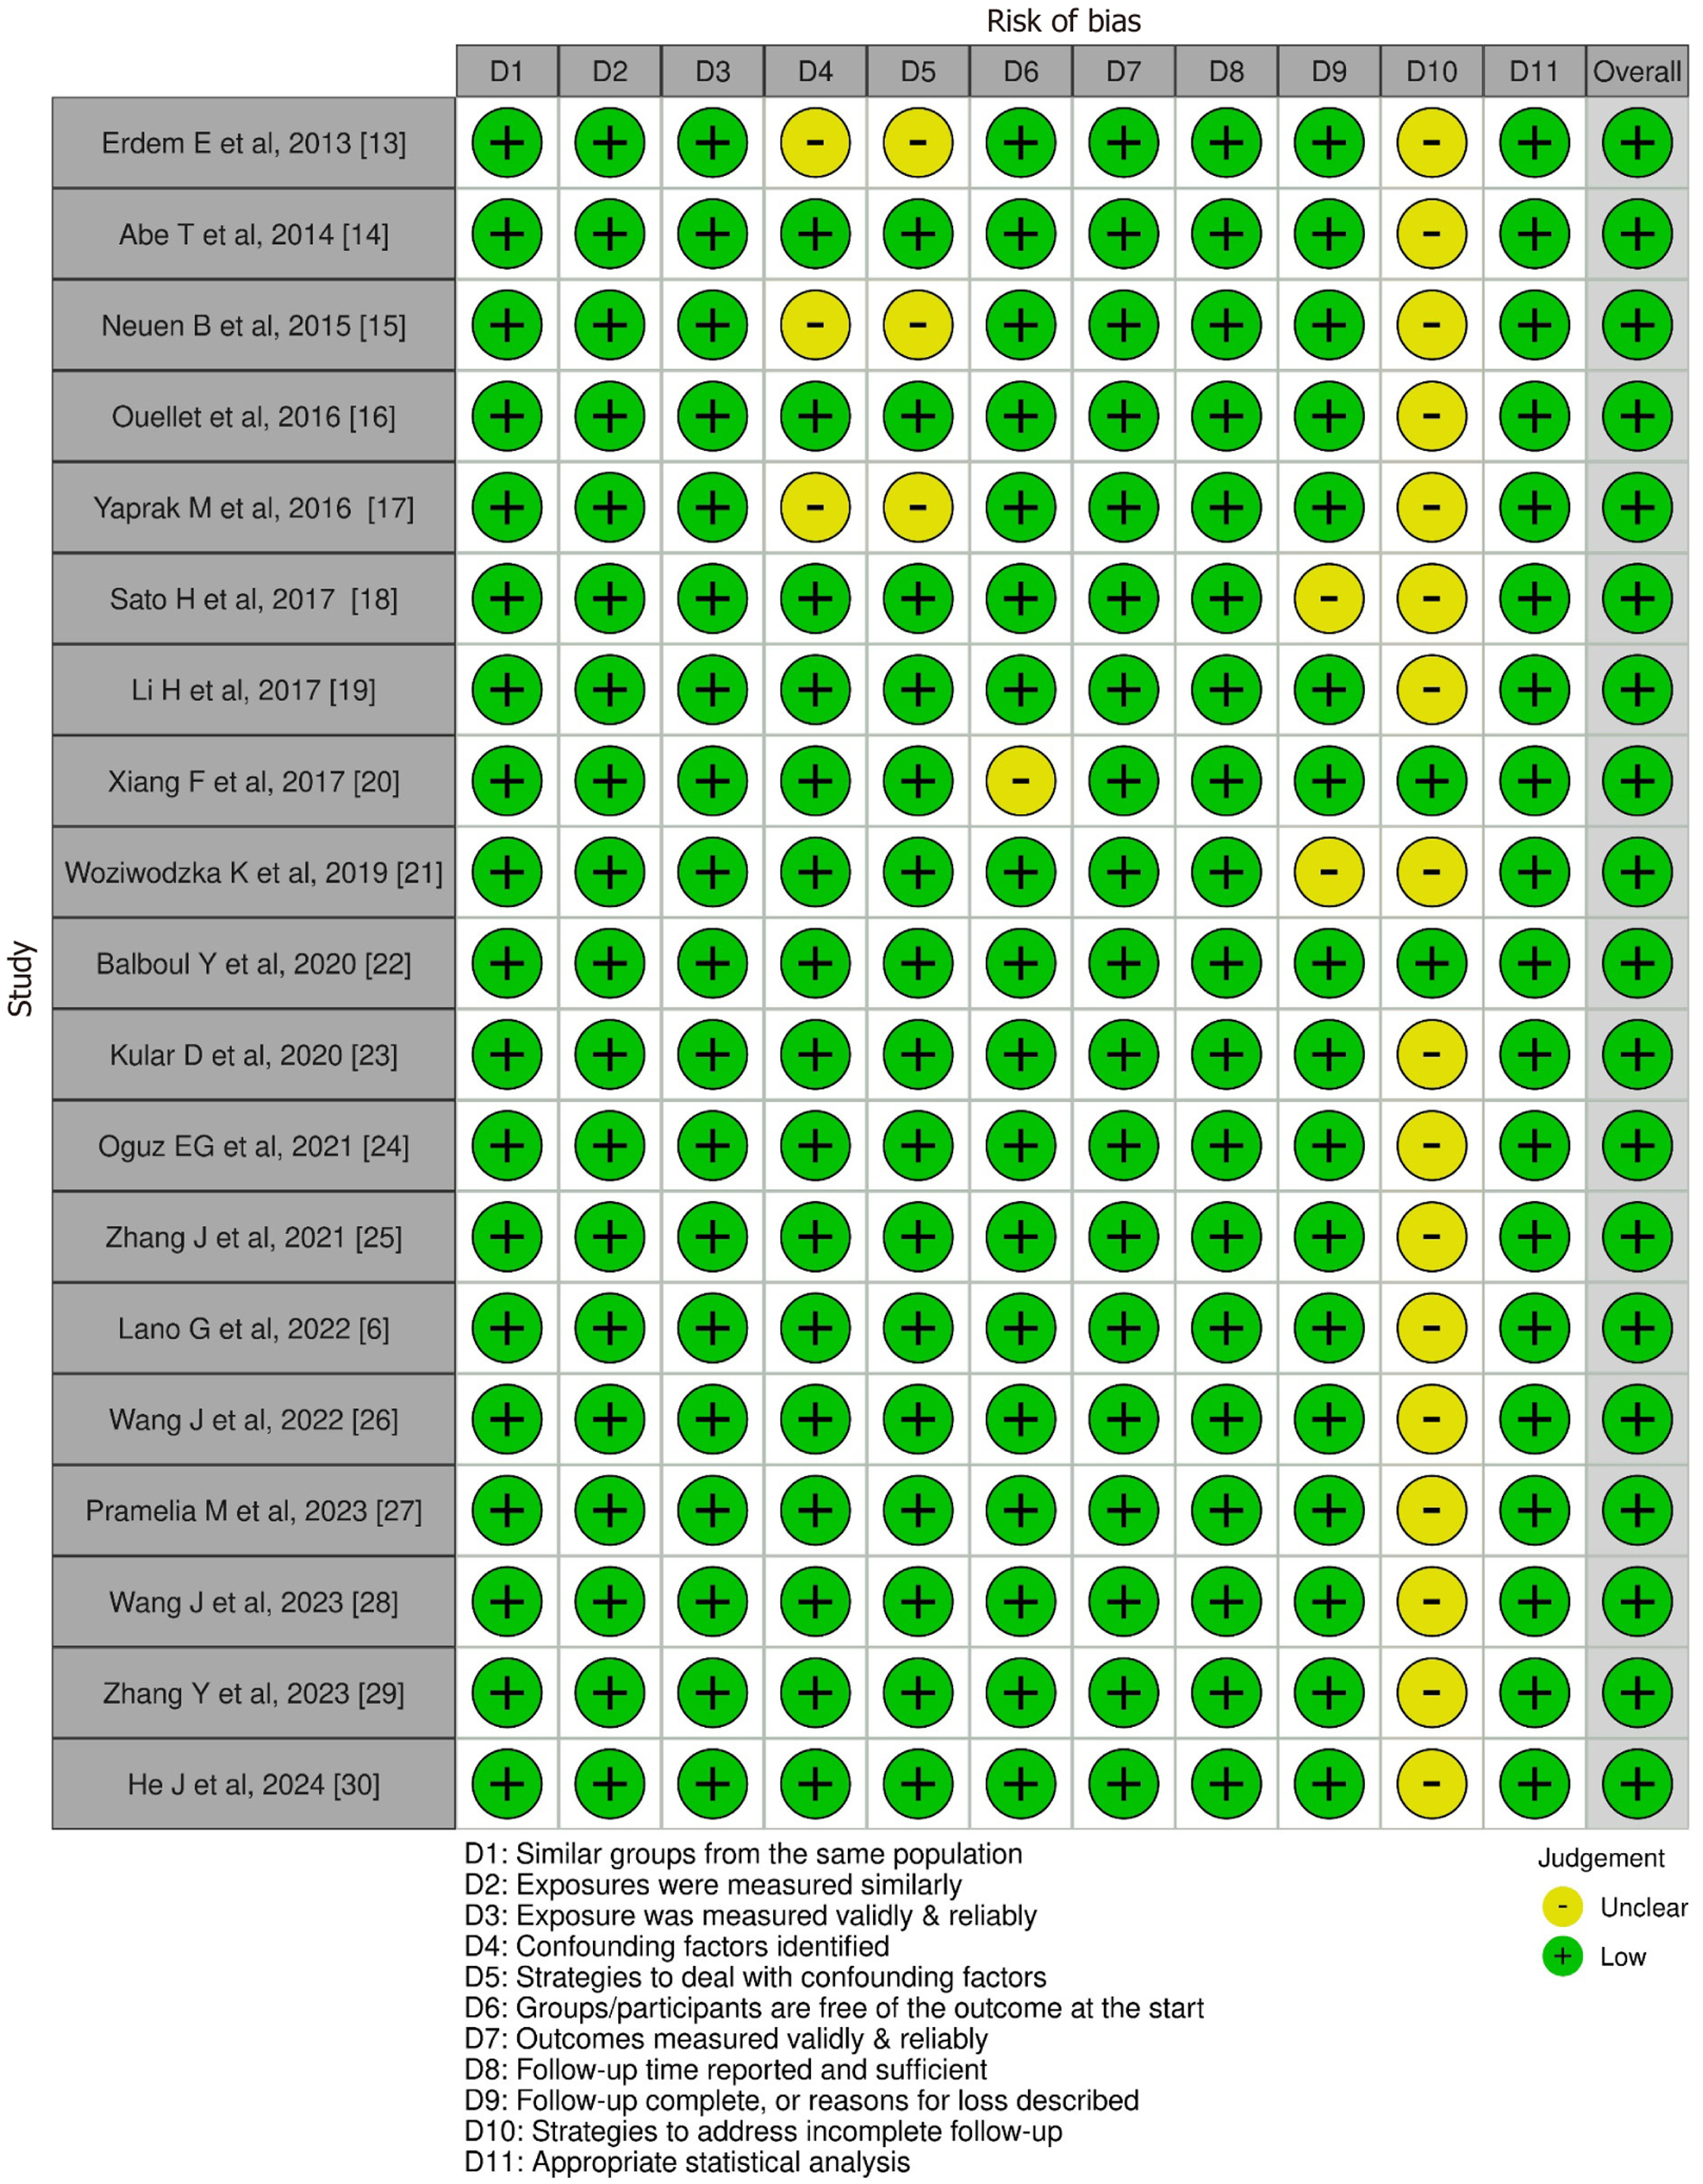
Figure 2 Risk of bias assessment was carried out using the Joanna Briggs Institute Tool and presented using Robvis software.
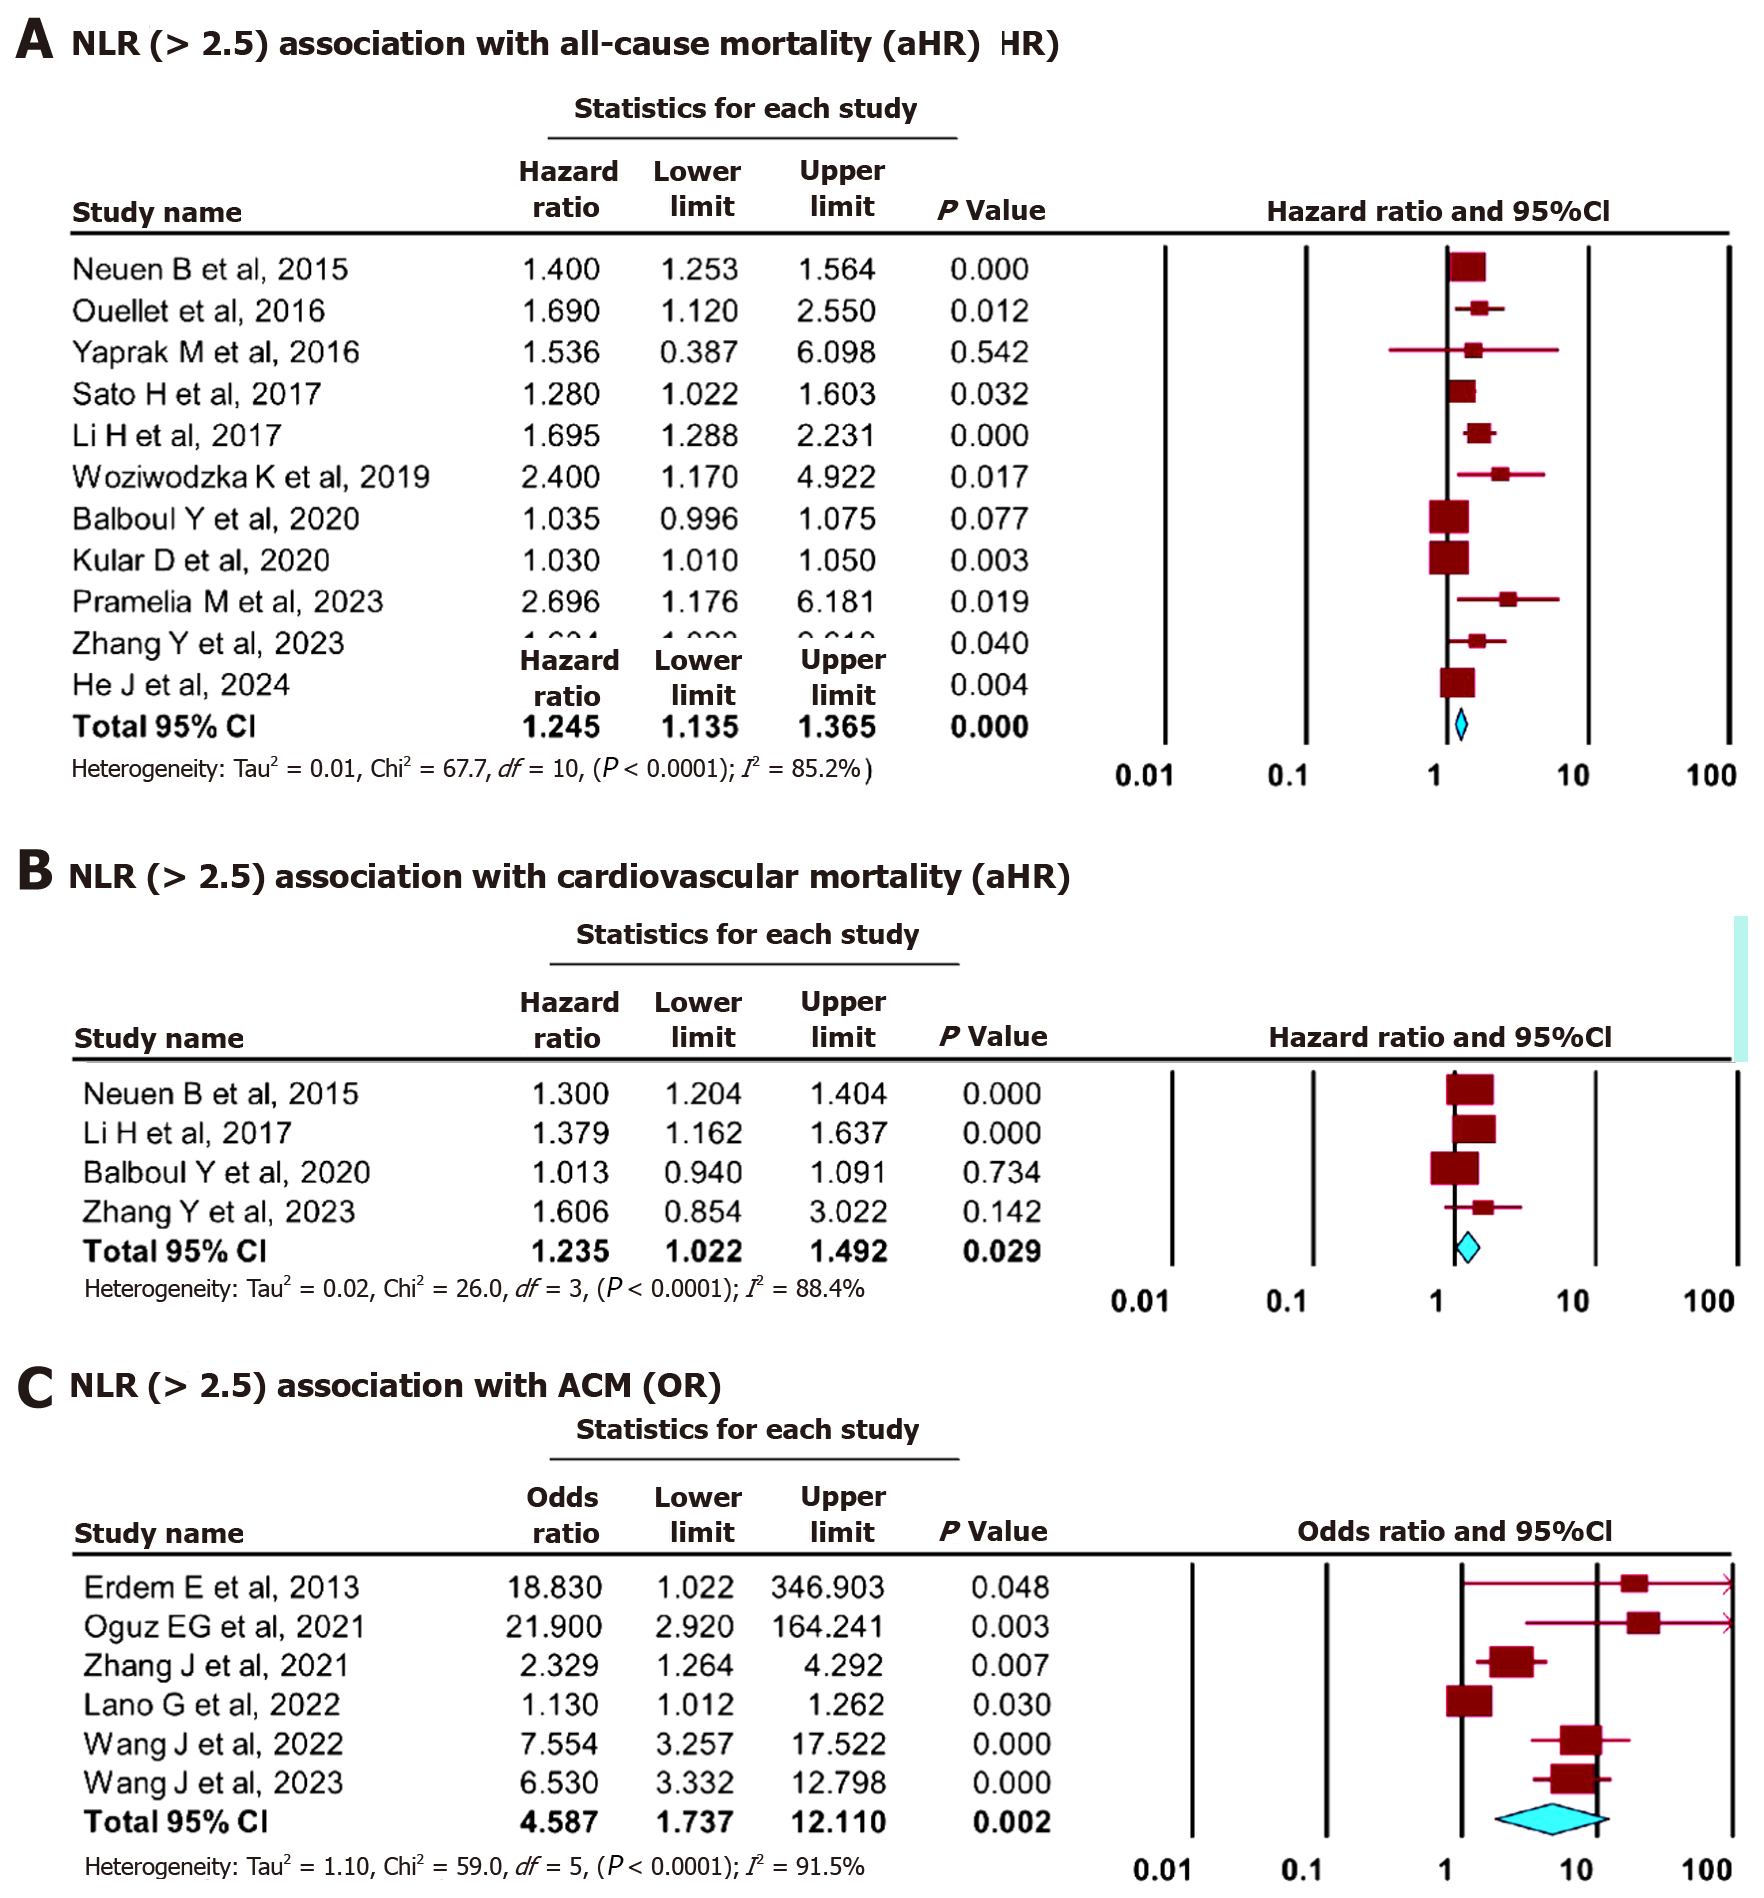
Figure 3 Forest plots illustrating the association.
A: Neutrophil-lymphocyte ratio > 2.5 with all-cause mortality (hazard ratio); B: Cardiovascular mortality (hazard ratio); C: All-cause mortality (odds ratio). ACM: All-cause mortality; CVM: Cardiovascular mortality; OR: Odds ratio; HR: Hazard ratio.
- Citation: Vempati R, Damarlapally N, Vasudevan SS, Patel V, Banda P, Mourad D, Polamarasetty H, Mathur G, Khan A, Desai R, Ratnani I, Surani S. Association of neutrophil-lymphocyte ratio with cardiovascular and all-cause mortality in patients receiving chronic hemodialysis: Systematic review and meta-analysis. World J Methodol 2025; 15(4): 107468
- URL: https://www.wjgnet.com/2222-0682/full/v15/i4/107468.htm
- DOI: https://dx.doi.org/10.5662/wjm.v15.i4.107468


