©The Author(s) 2025.
World J Methodol. Jun 20, 2025; 15(2): 96777
Published online Jun 20, 2025. doi: 10.5662/wjm.v15.i2.96777
Published online Jun 20, 2025. doi: 10.5662/wjm.v15.i2.96777
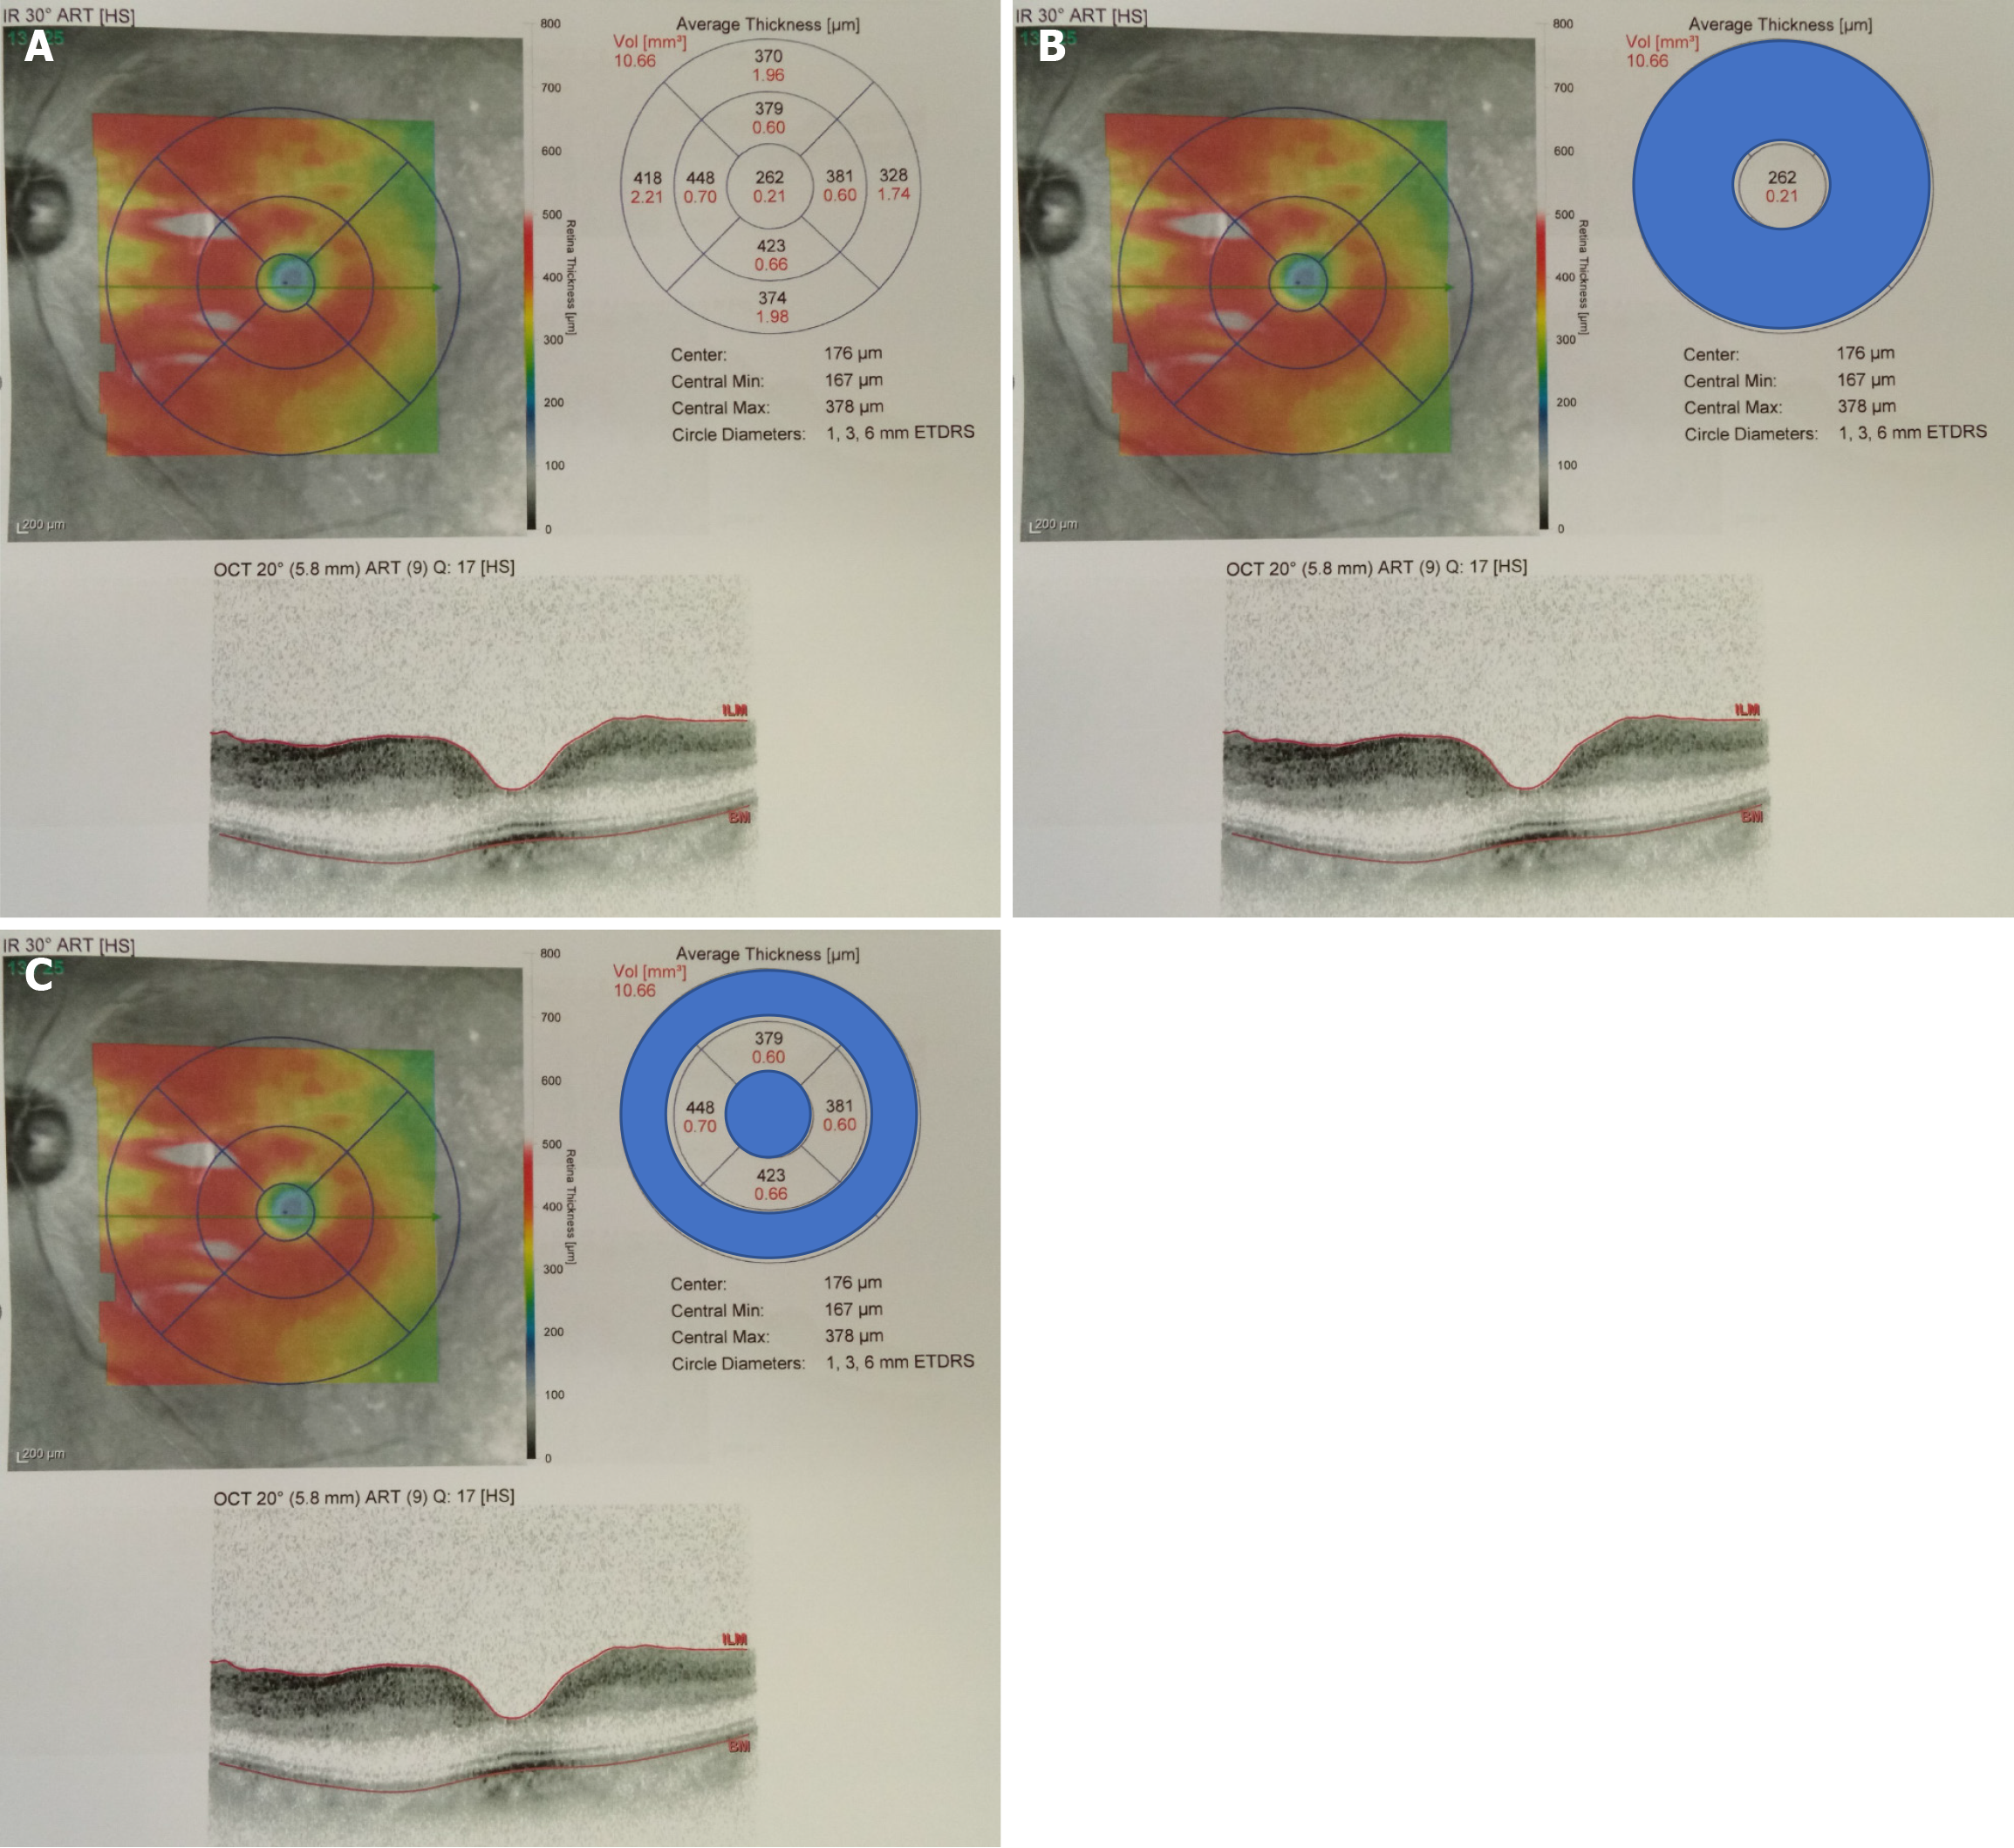
Figure 1 An optical coherence tomography scan report.
A: An optical coherence tomography scan report example with machine generated thickness map for a left eye suffering from acute central retinal artery occlusion; B: The encircled central 1 mm zone thickness data was extracted from the printout; C: The highlighted area indicates the central 1-to-3 mm zone on the thickness map.
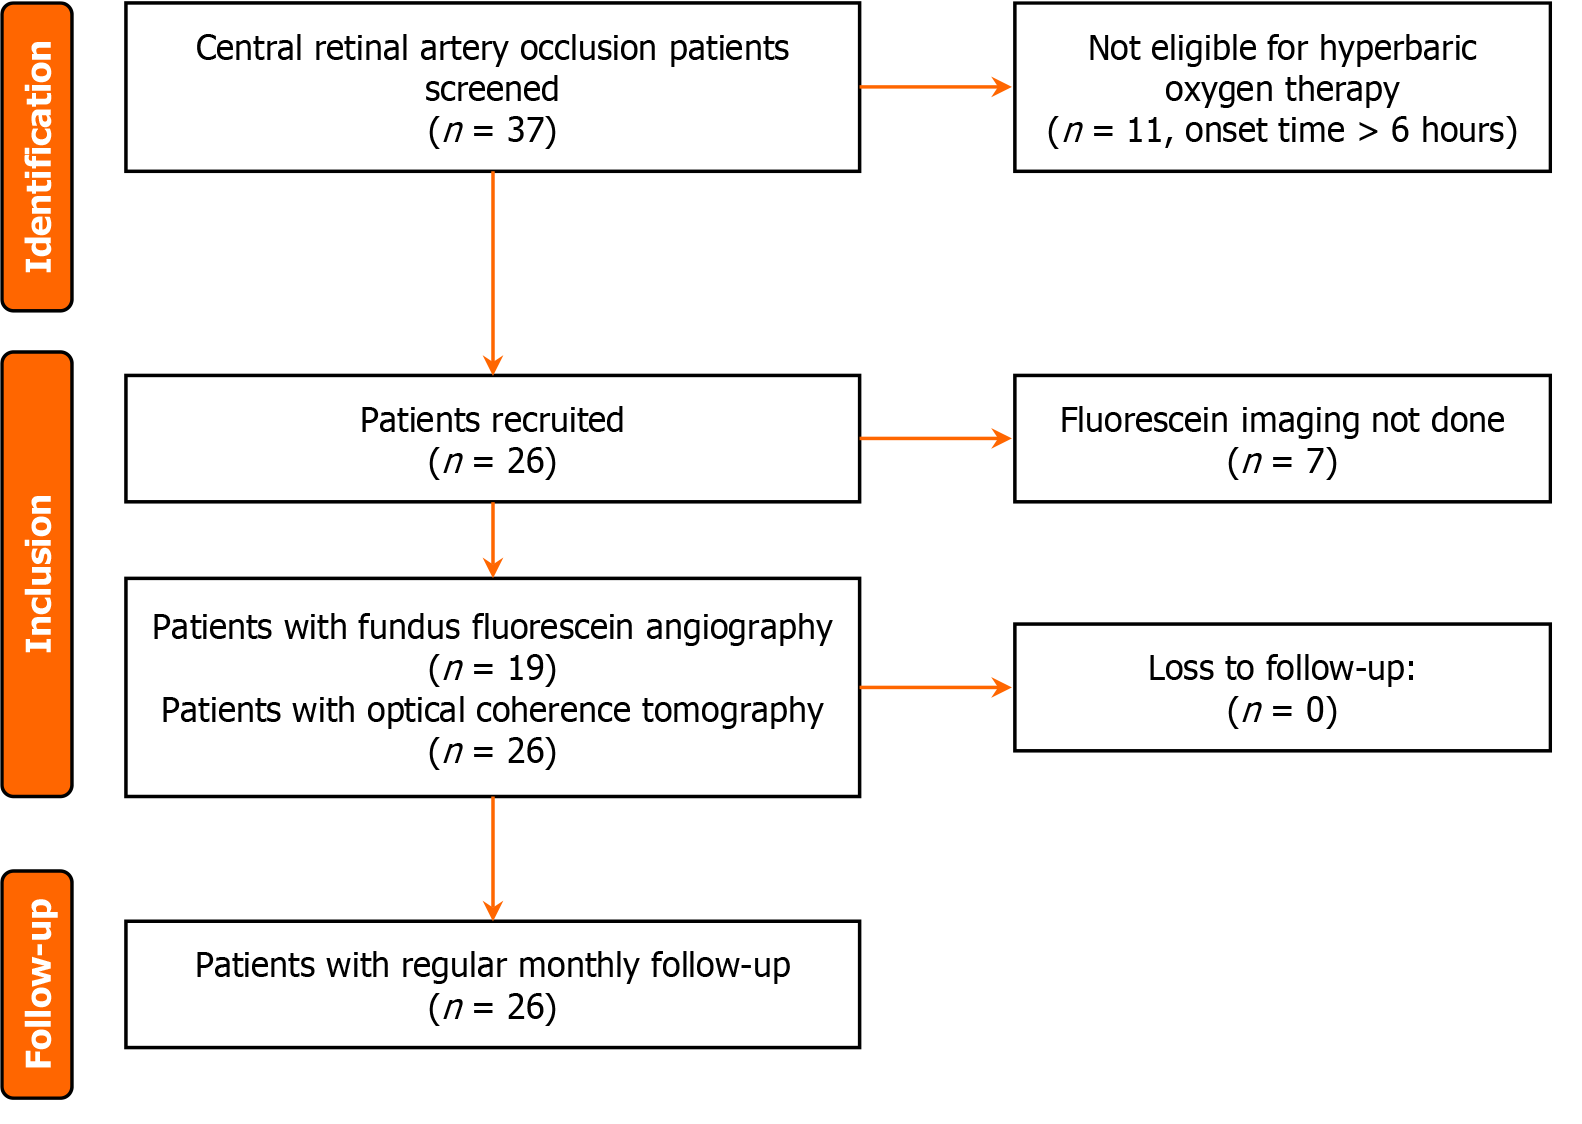
Figure 2
Flowchart of patient recruitment.
- Citation: Au SCL, Chong SSY. Prognostic factors for acute central retinal artery occlusion treated with hyperbaric oxygen: The Hong Kong study report number five. World J Methodol 2025; 15(2): 96777
- URL: https://www.wjgnet.com/2222-0682/full/v15/i2/96777.htm
- DOI: https://dx.doi.org/10.5662/wjm.v15.i2.96777


