Copyright
©The Author(s) 2023.
World J Methodol. Dec 20, 2023; 13(5): 456-465
Published online Dec 20, 2023. doi: 10.5662/wjm.v13.i5.456
Published online Dec 20, 2023. doi: 10.5662/wjm.v13.i5.456
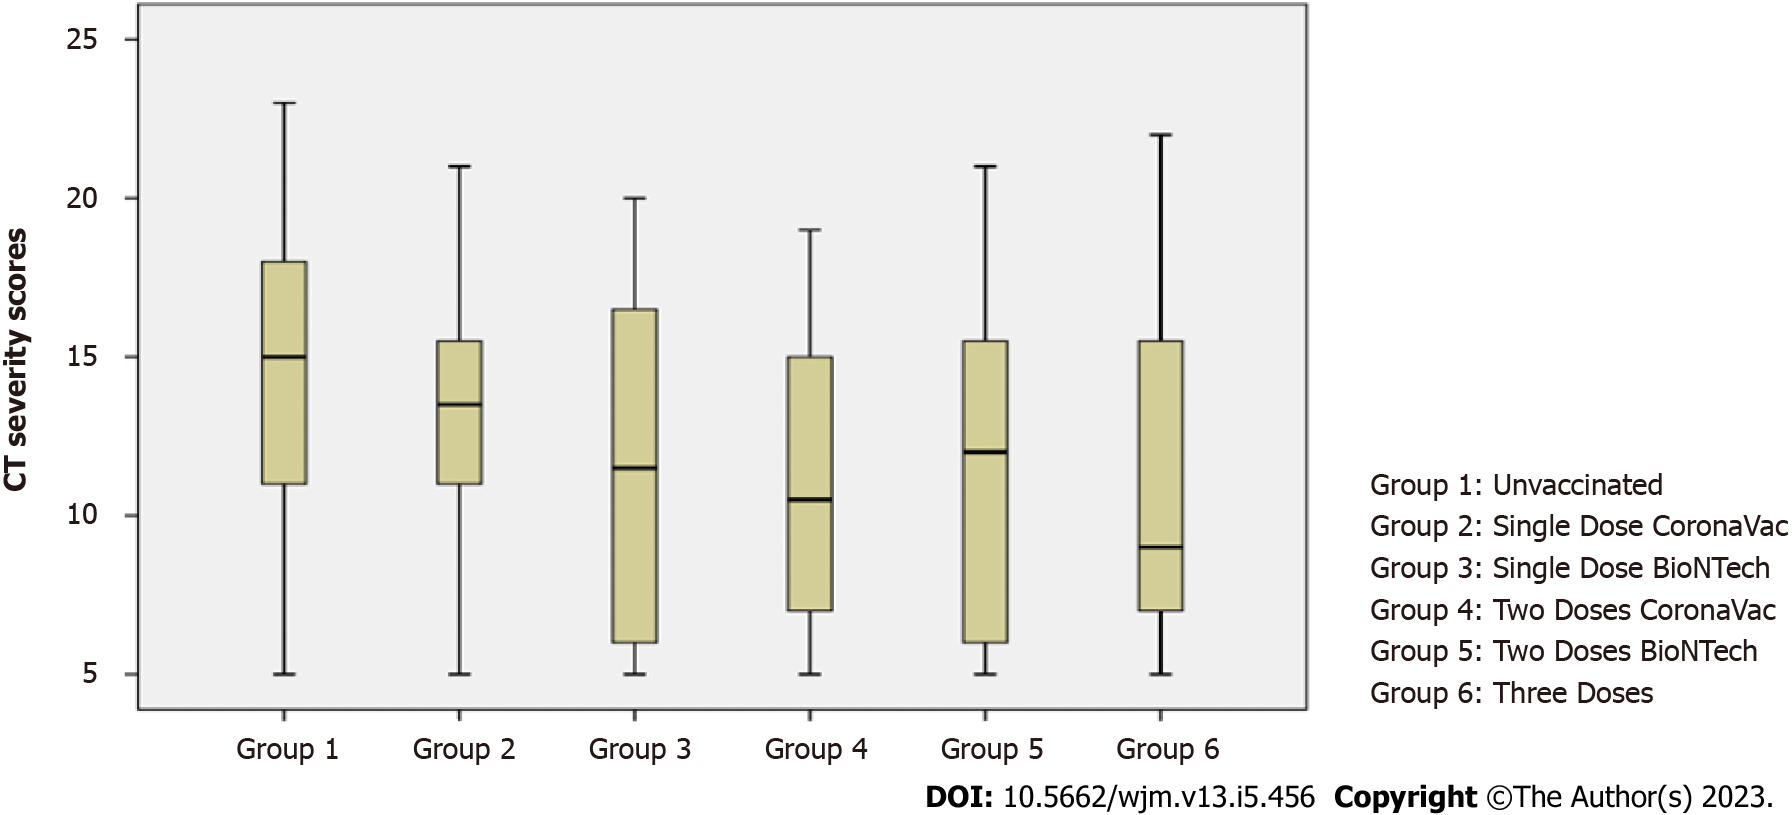
Figure 1 Distribution of computed tomography severity scores of the groups.
CT: Computed tomography.
Figure 2 Distribution of C-reactive protein levels of the groups.
CRP: C-reactive protein.
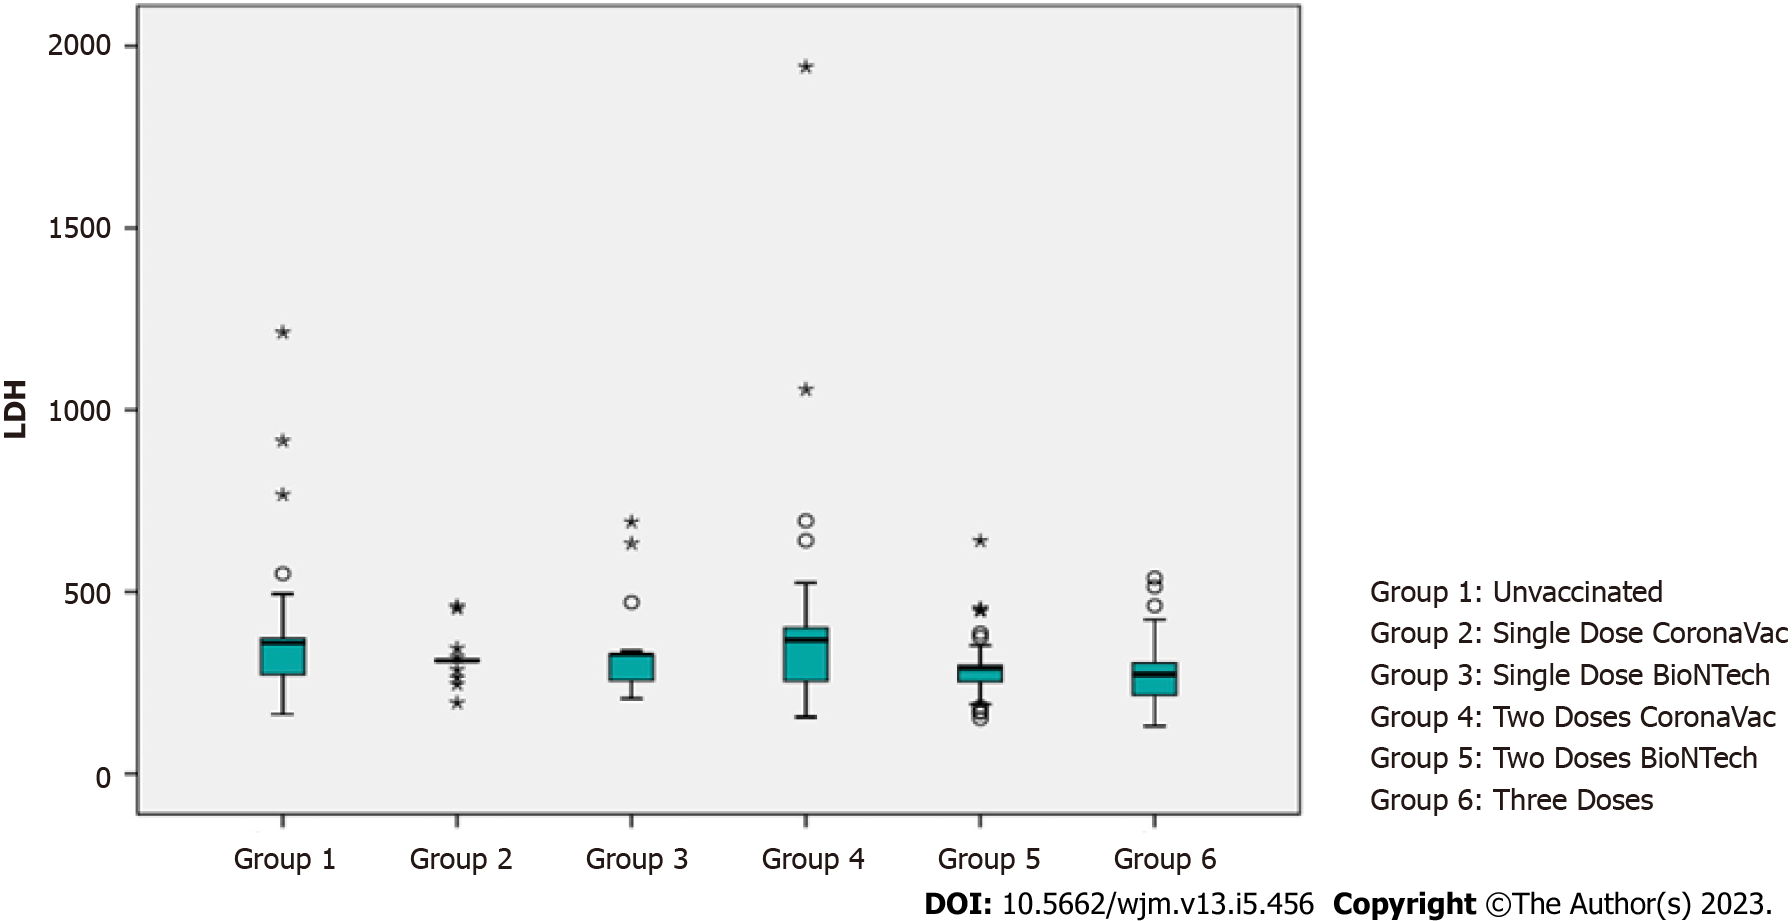
Figure 3 Distribution of lactate dehydrogenase levels of the groups.
LDH: Lactate dehydrogenase.
Figure 4 Distribution of procalcitonin levels of the groups.
- Citation: Binay UD, Karavaş E, Karakeçili F, Barkay O, Aydin S, Şenbil DC. Effect of vaccination status on CORADS and computed tomography severity score in hospitalized COVID-19 patients: A retrospective study. World J Methodol 2023; 13(5): 456-465
- URL: https://www.wjgnet.com/2222-0682/full/v13/i5/456.htm
- DOI: https://dx.doi.org/10.5662/wjm.v13.i5.456


