Copyright
©The Author(s) 2023.
World J Methodol. Sep 20, 2023; 13(4): 345-358
Published online Sep 20, 2023. doi: 10.5662/wjm.v13.i4.345
Published online Sep 20, 2023. doi: 10.5662/wjm.v13.i4.345
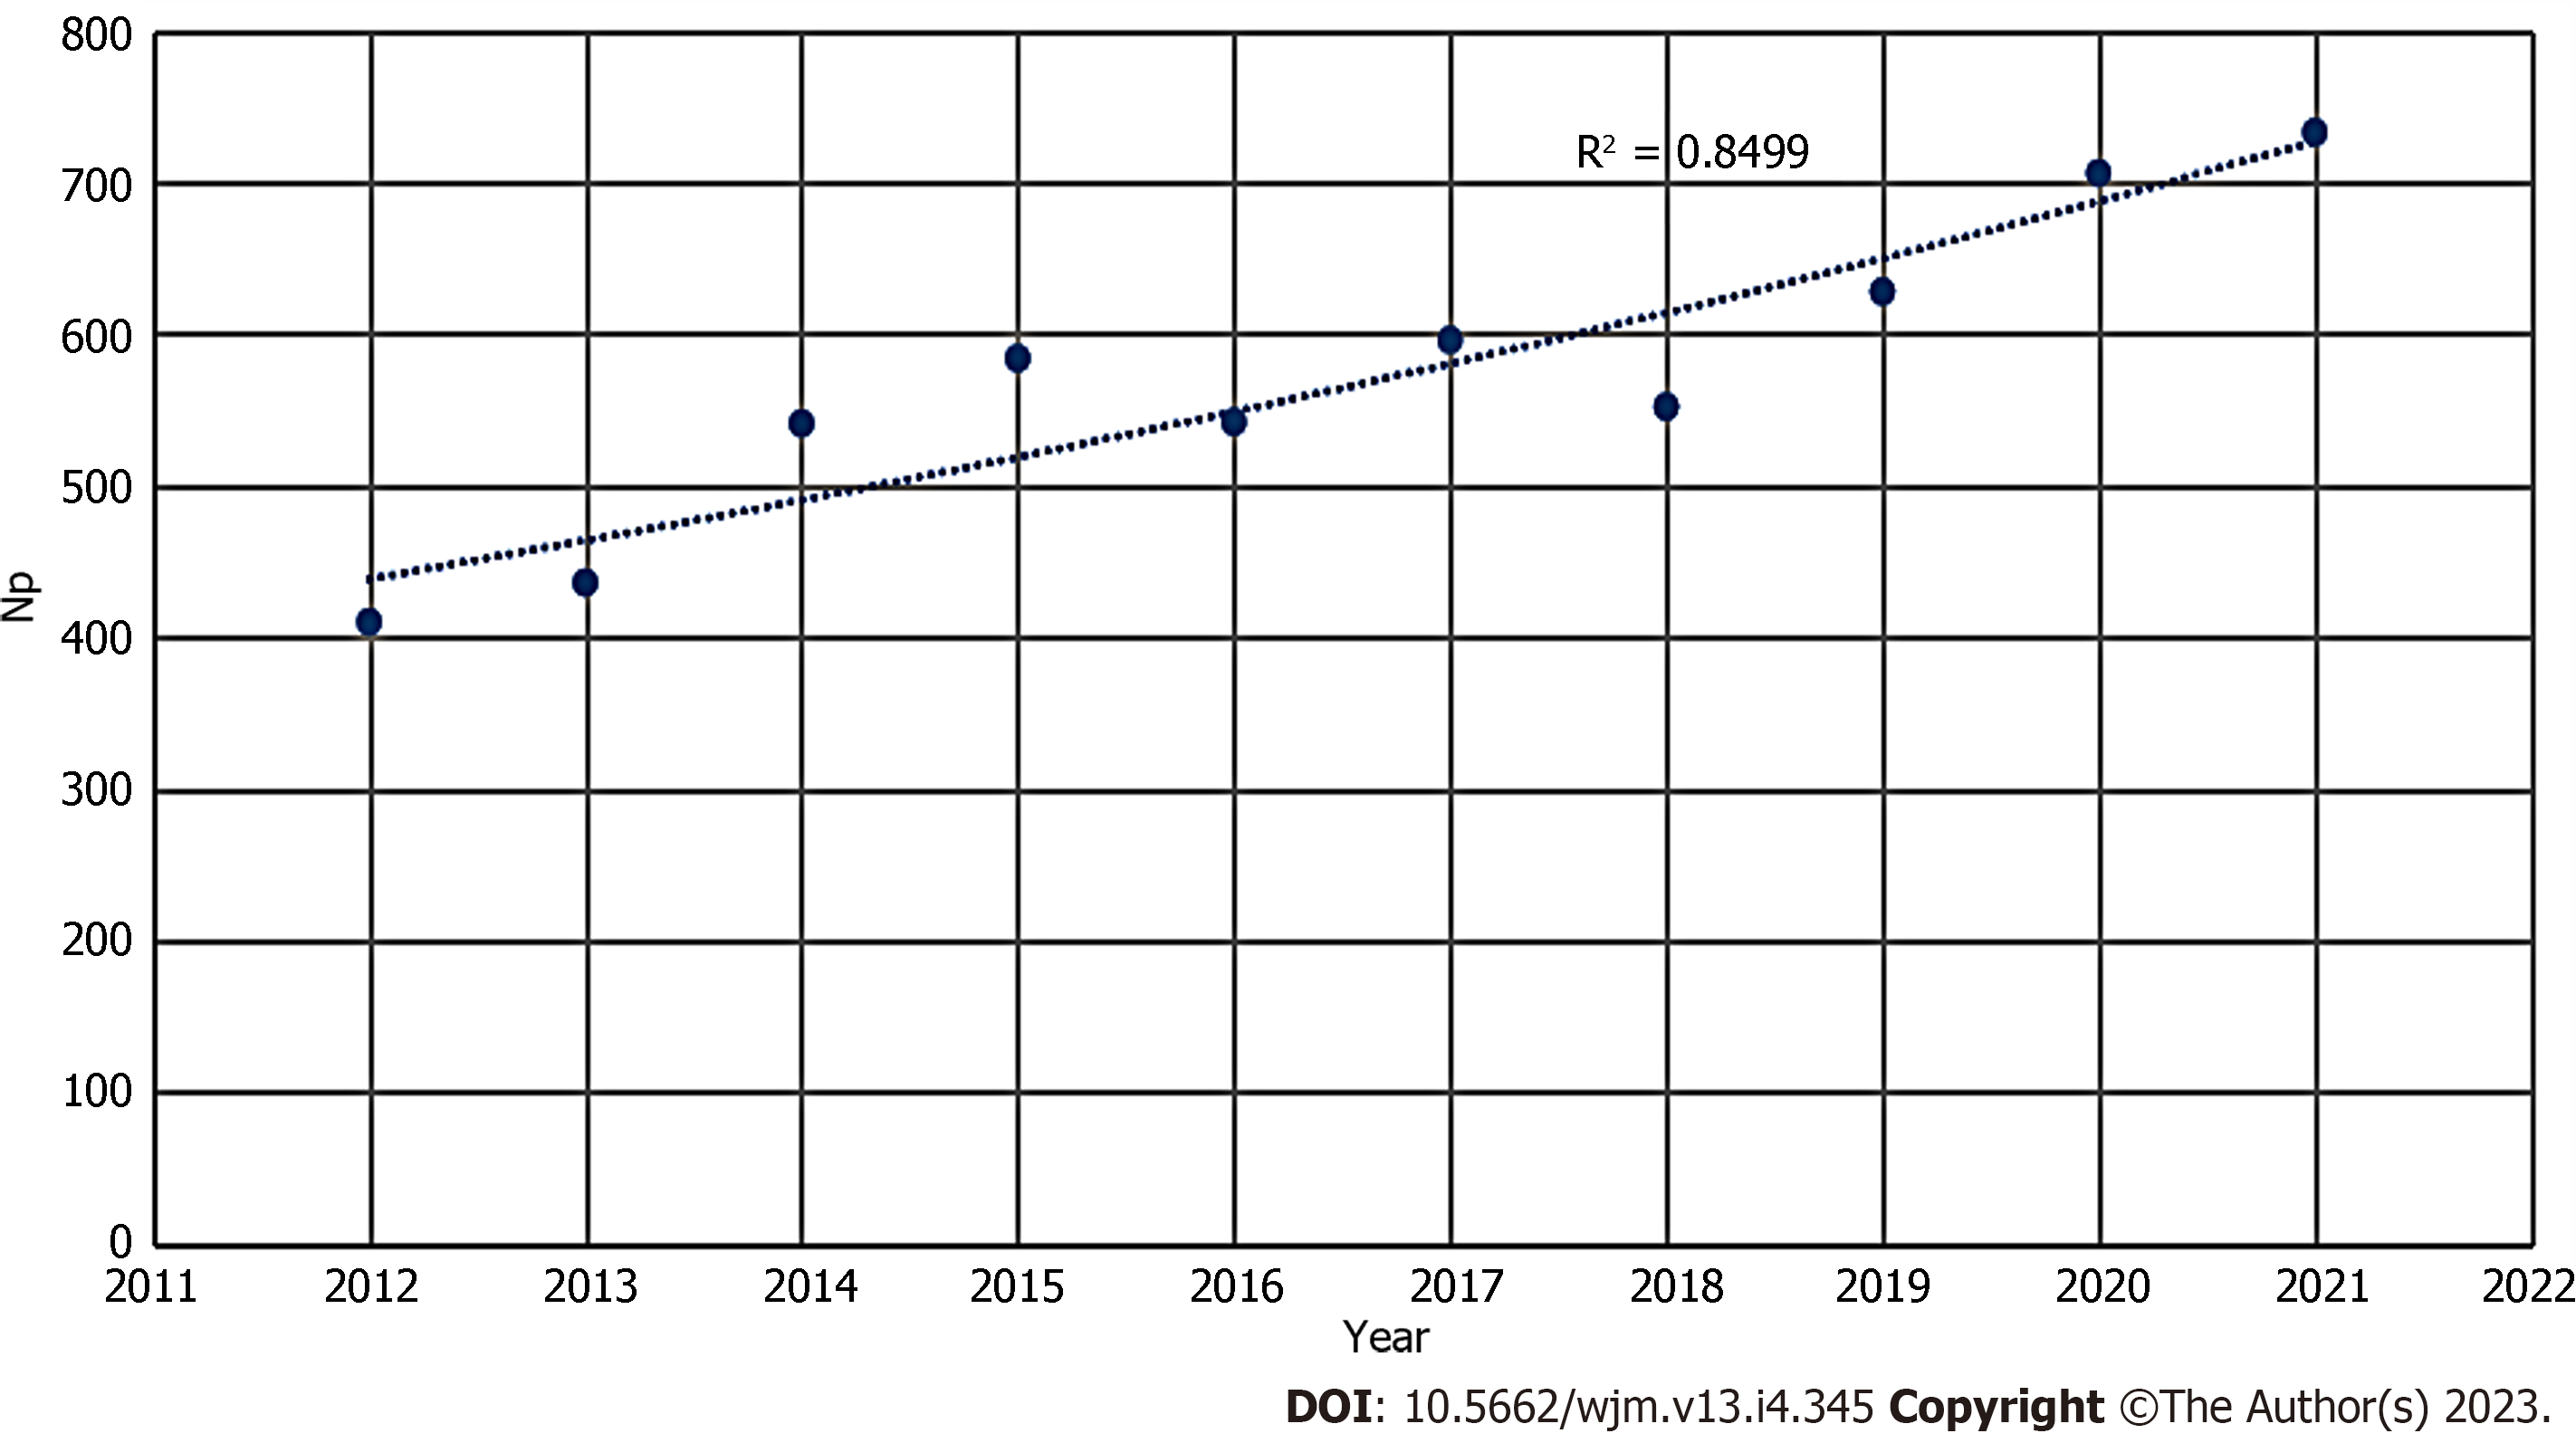
Figure 1 Curve fitting of publications’ overall yearly growth trend.
Np: Number of papers.
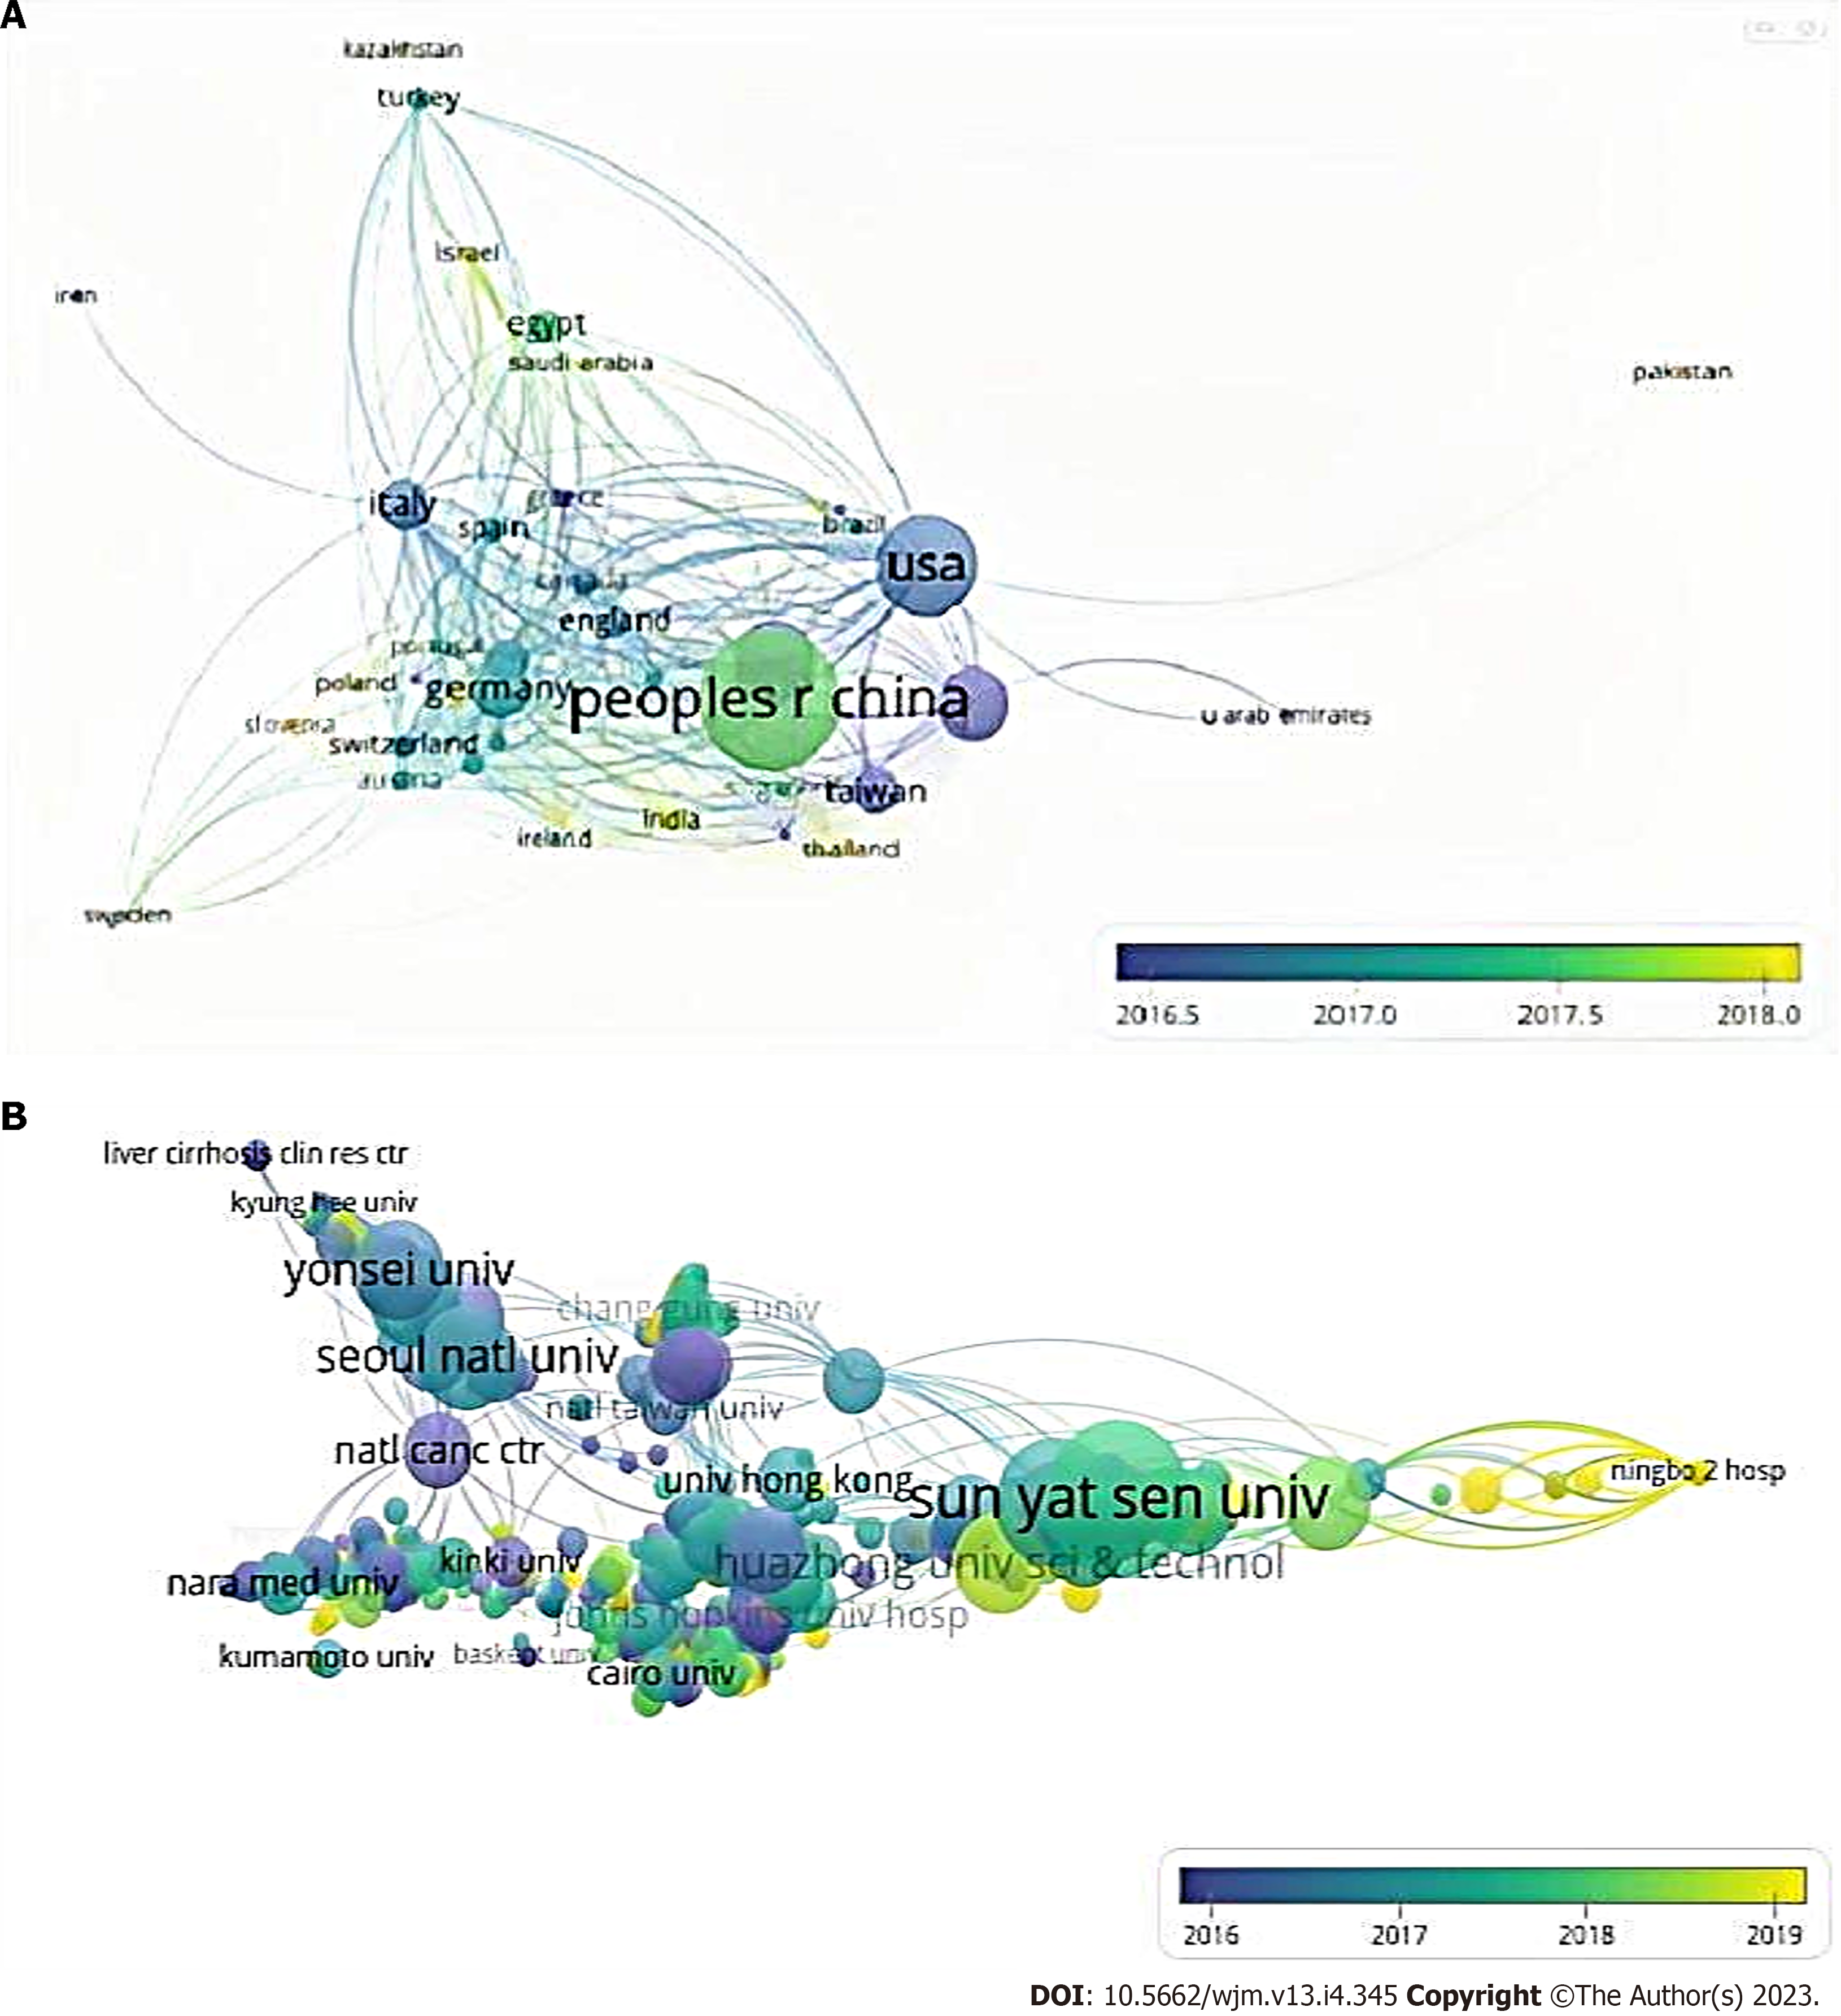
Figure 2 Shows the trend of global collaboration, the organizations are also interacting very closely.
A: Mapping of the main research countries in transarterial chemoembolization (TACE) for hepatocellular carcinoma (HCC). The minimum number of documents of a country was set at 5. Of the 80 countries that were involved in this field, 42 countries met the threshold; B: Mapping of the collaboration network of the main research organizations in TACE for HCC. The minimum number of documents of an organization was set at 15. Of the 2146 organizations that were involved in this field, 74 organizations met the threshold.
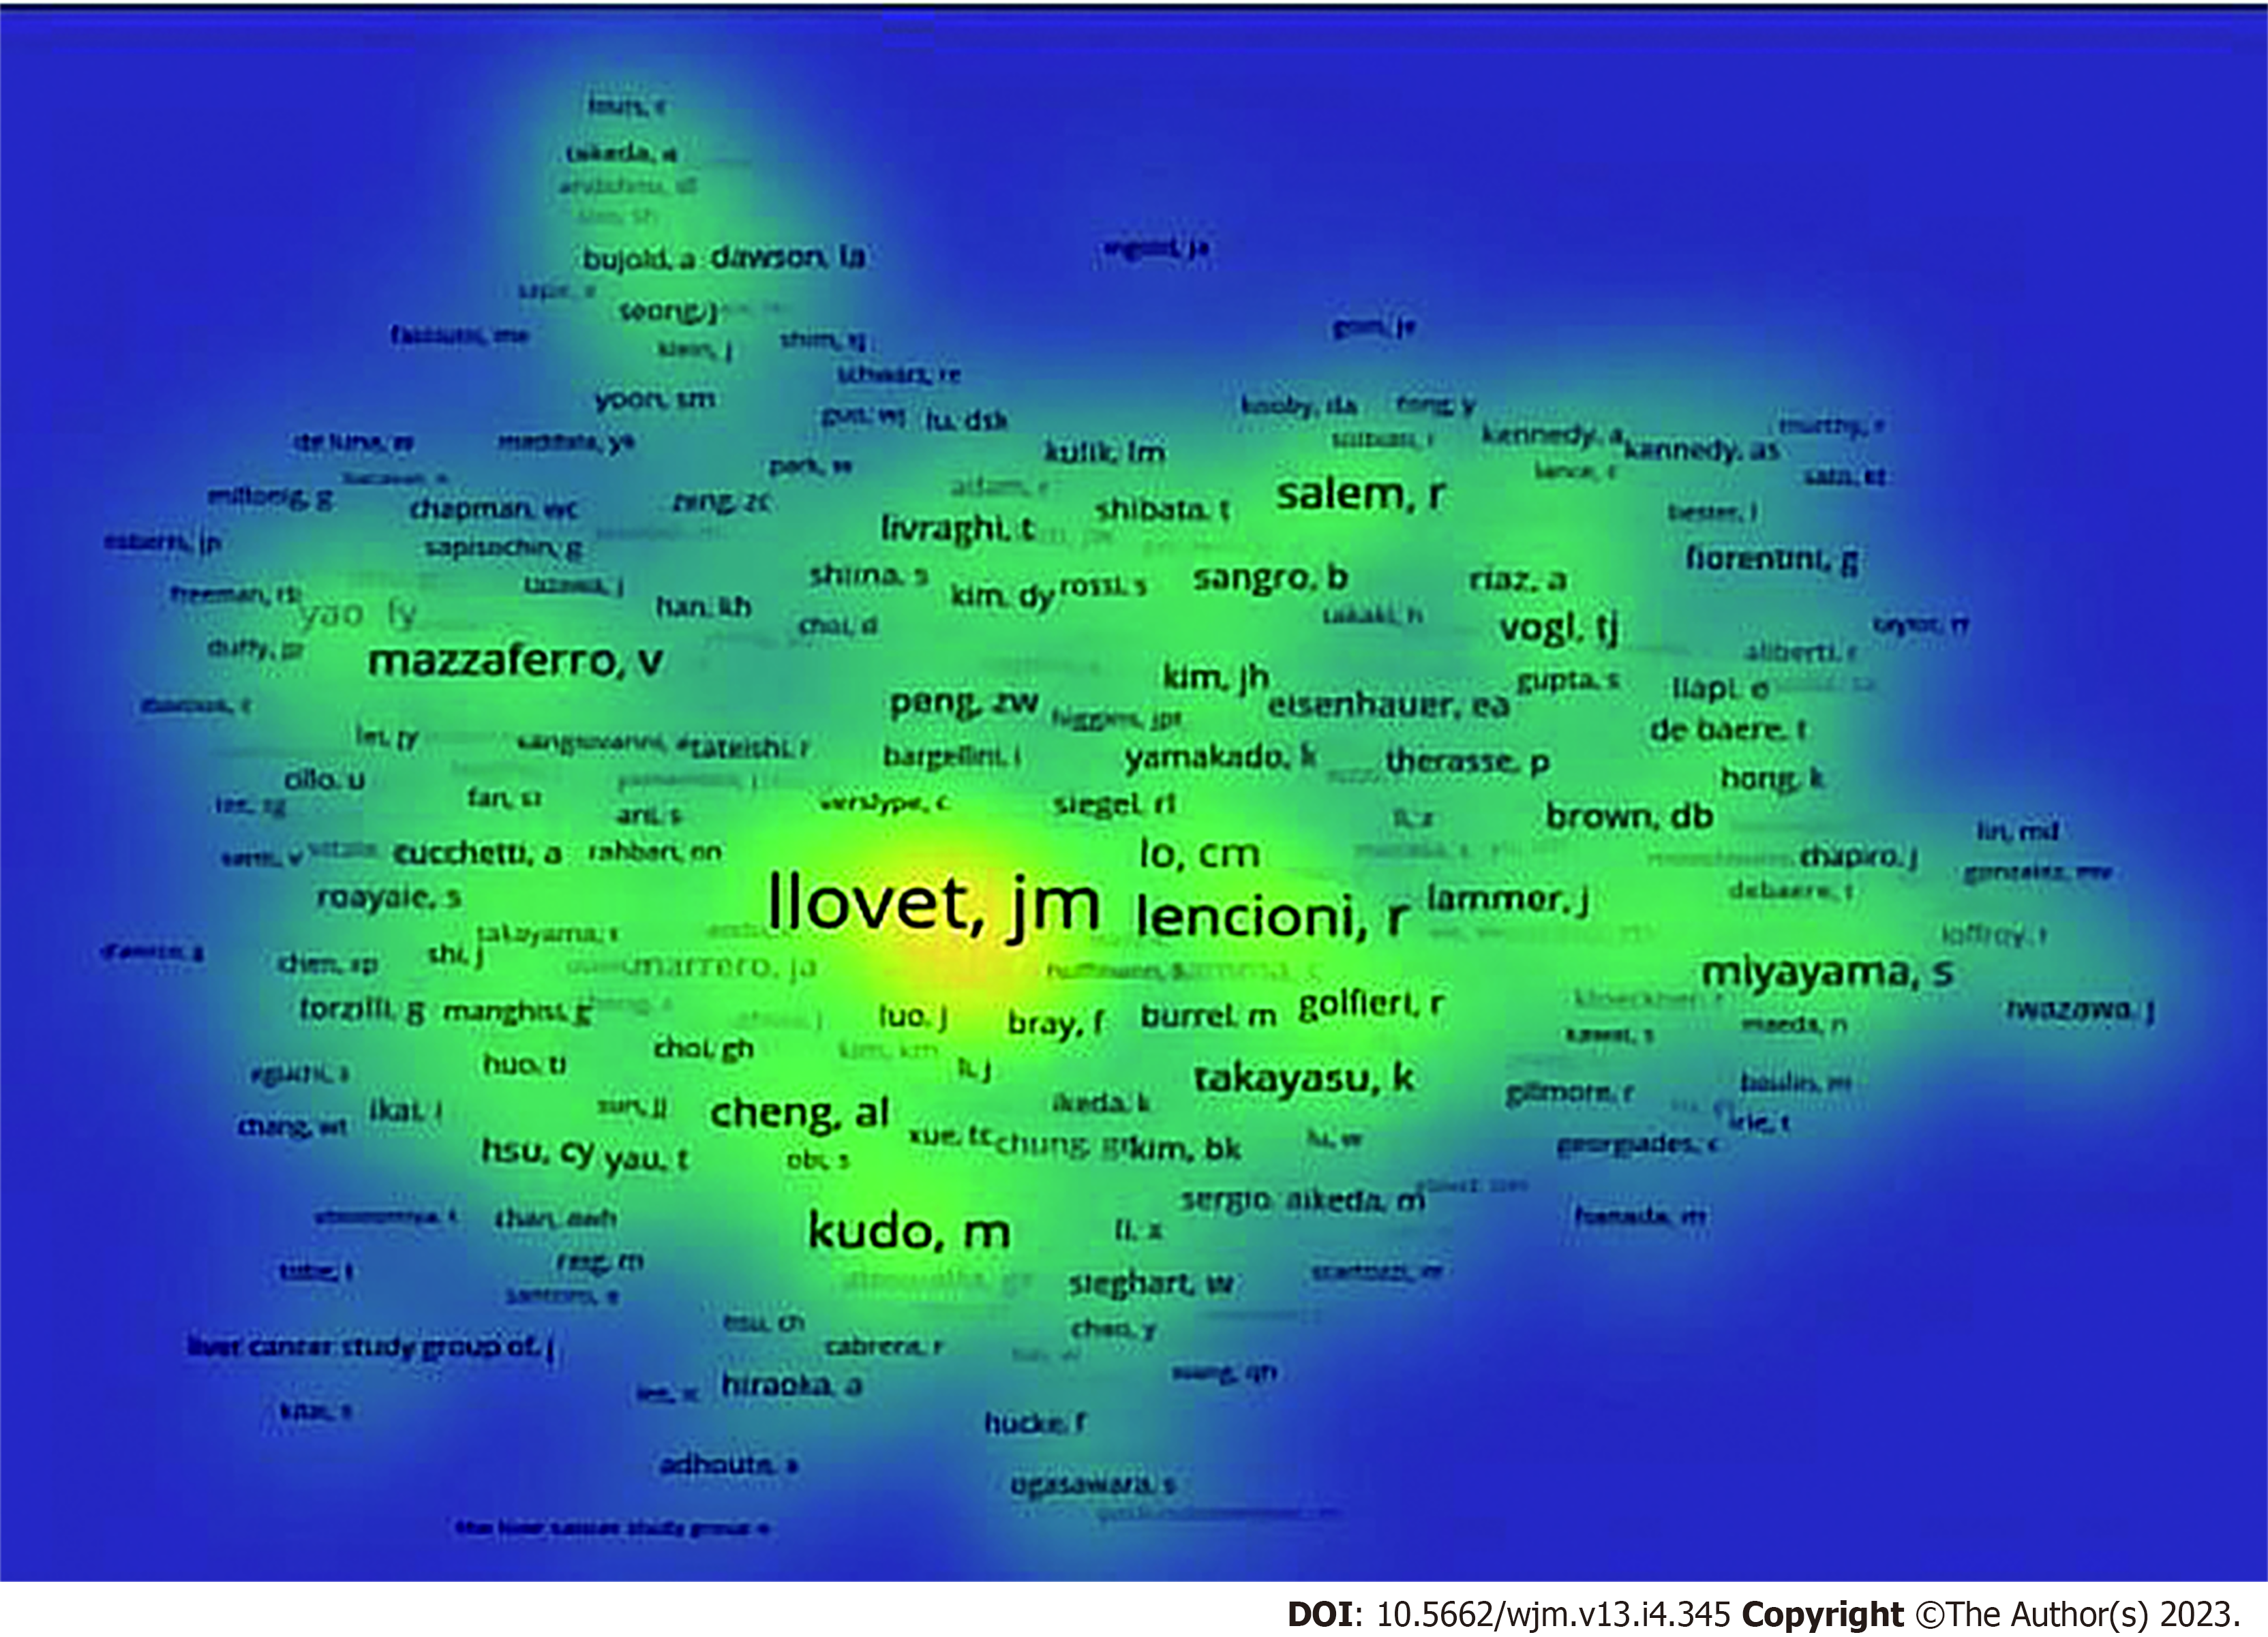
Figure 3 Co-authorship network of productive authors conducting transarterial chemoembolization research.
The minimum number of documents of an author was set at 5. Of the 8975 authors that were involved in the research field, 73 authors met the threshold. Yellow means appearing more frequently, while green means appearing less frequently.
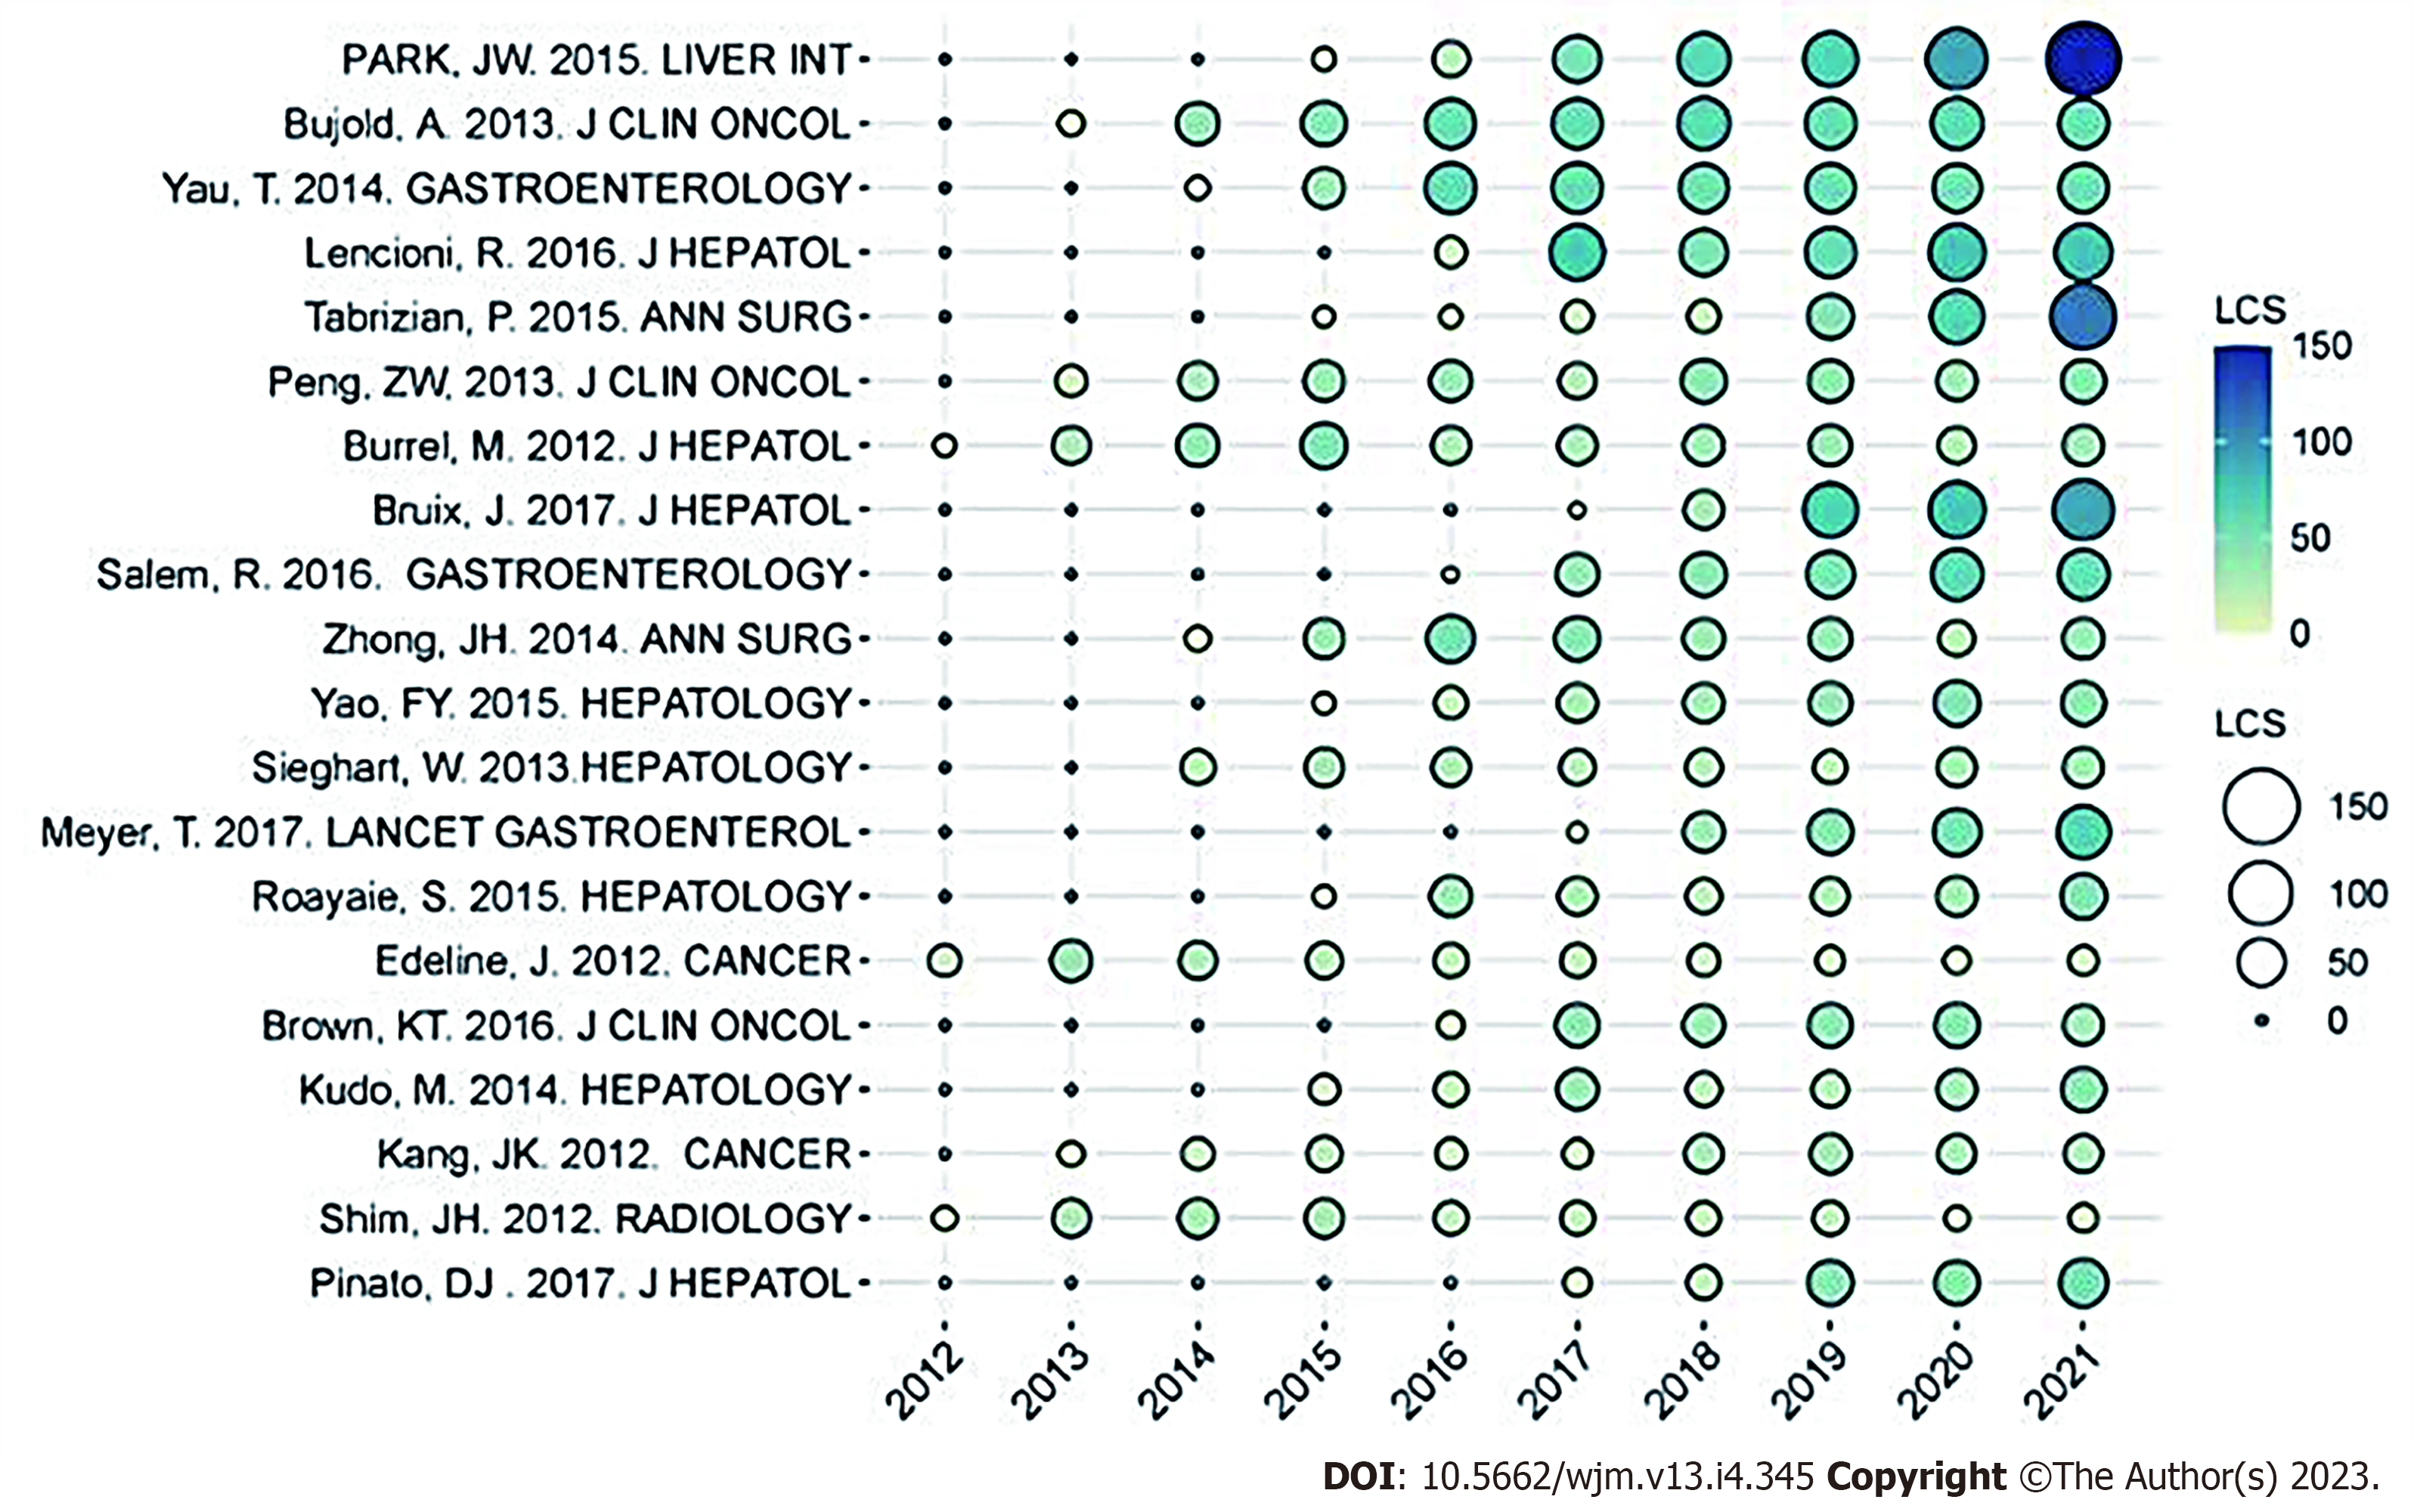
Figure 4 The yearly number of local citations of papers with high local citations.
The size and colors of the circle represent the high local citations of papers. LCS: High local citations.
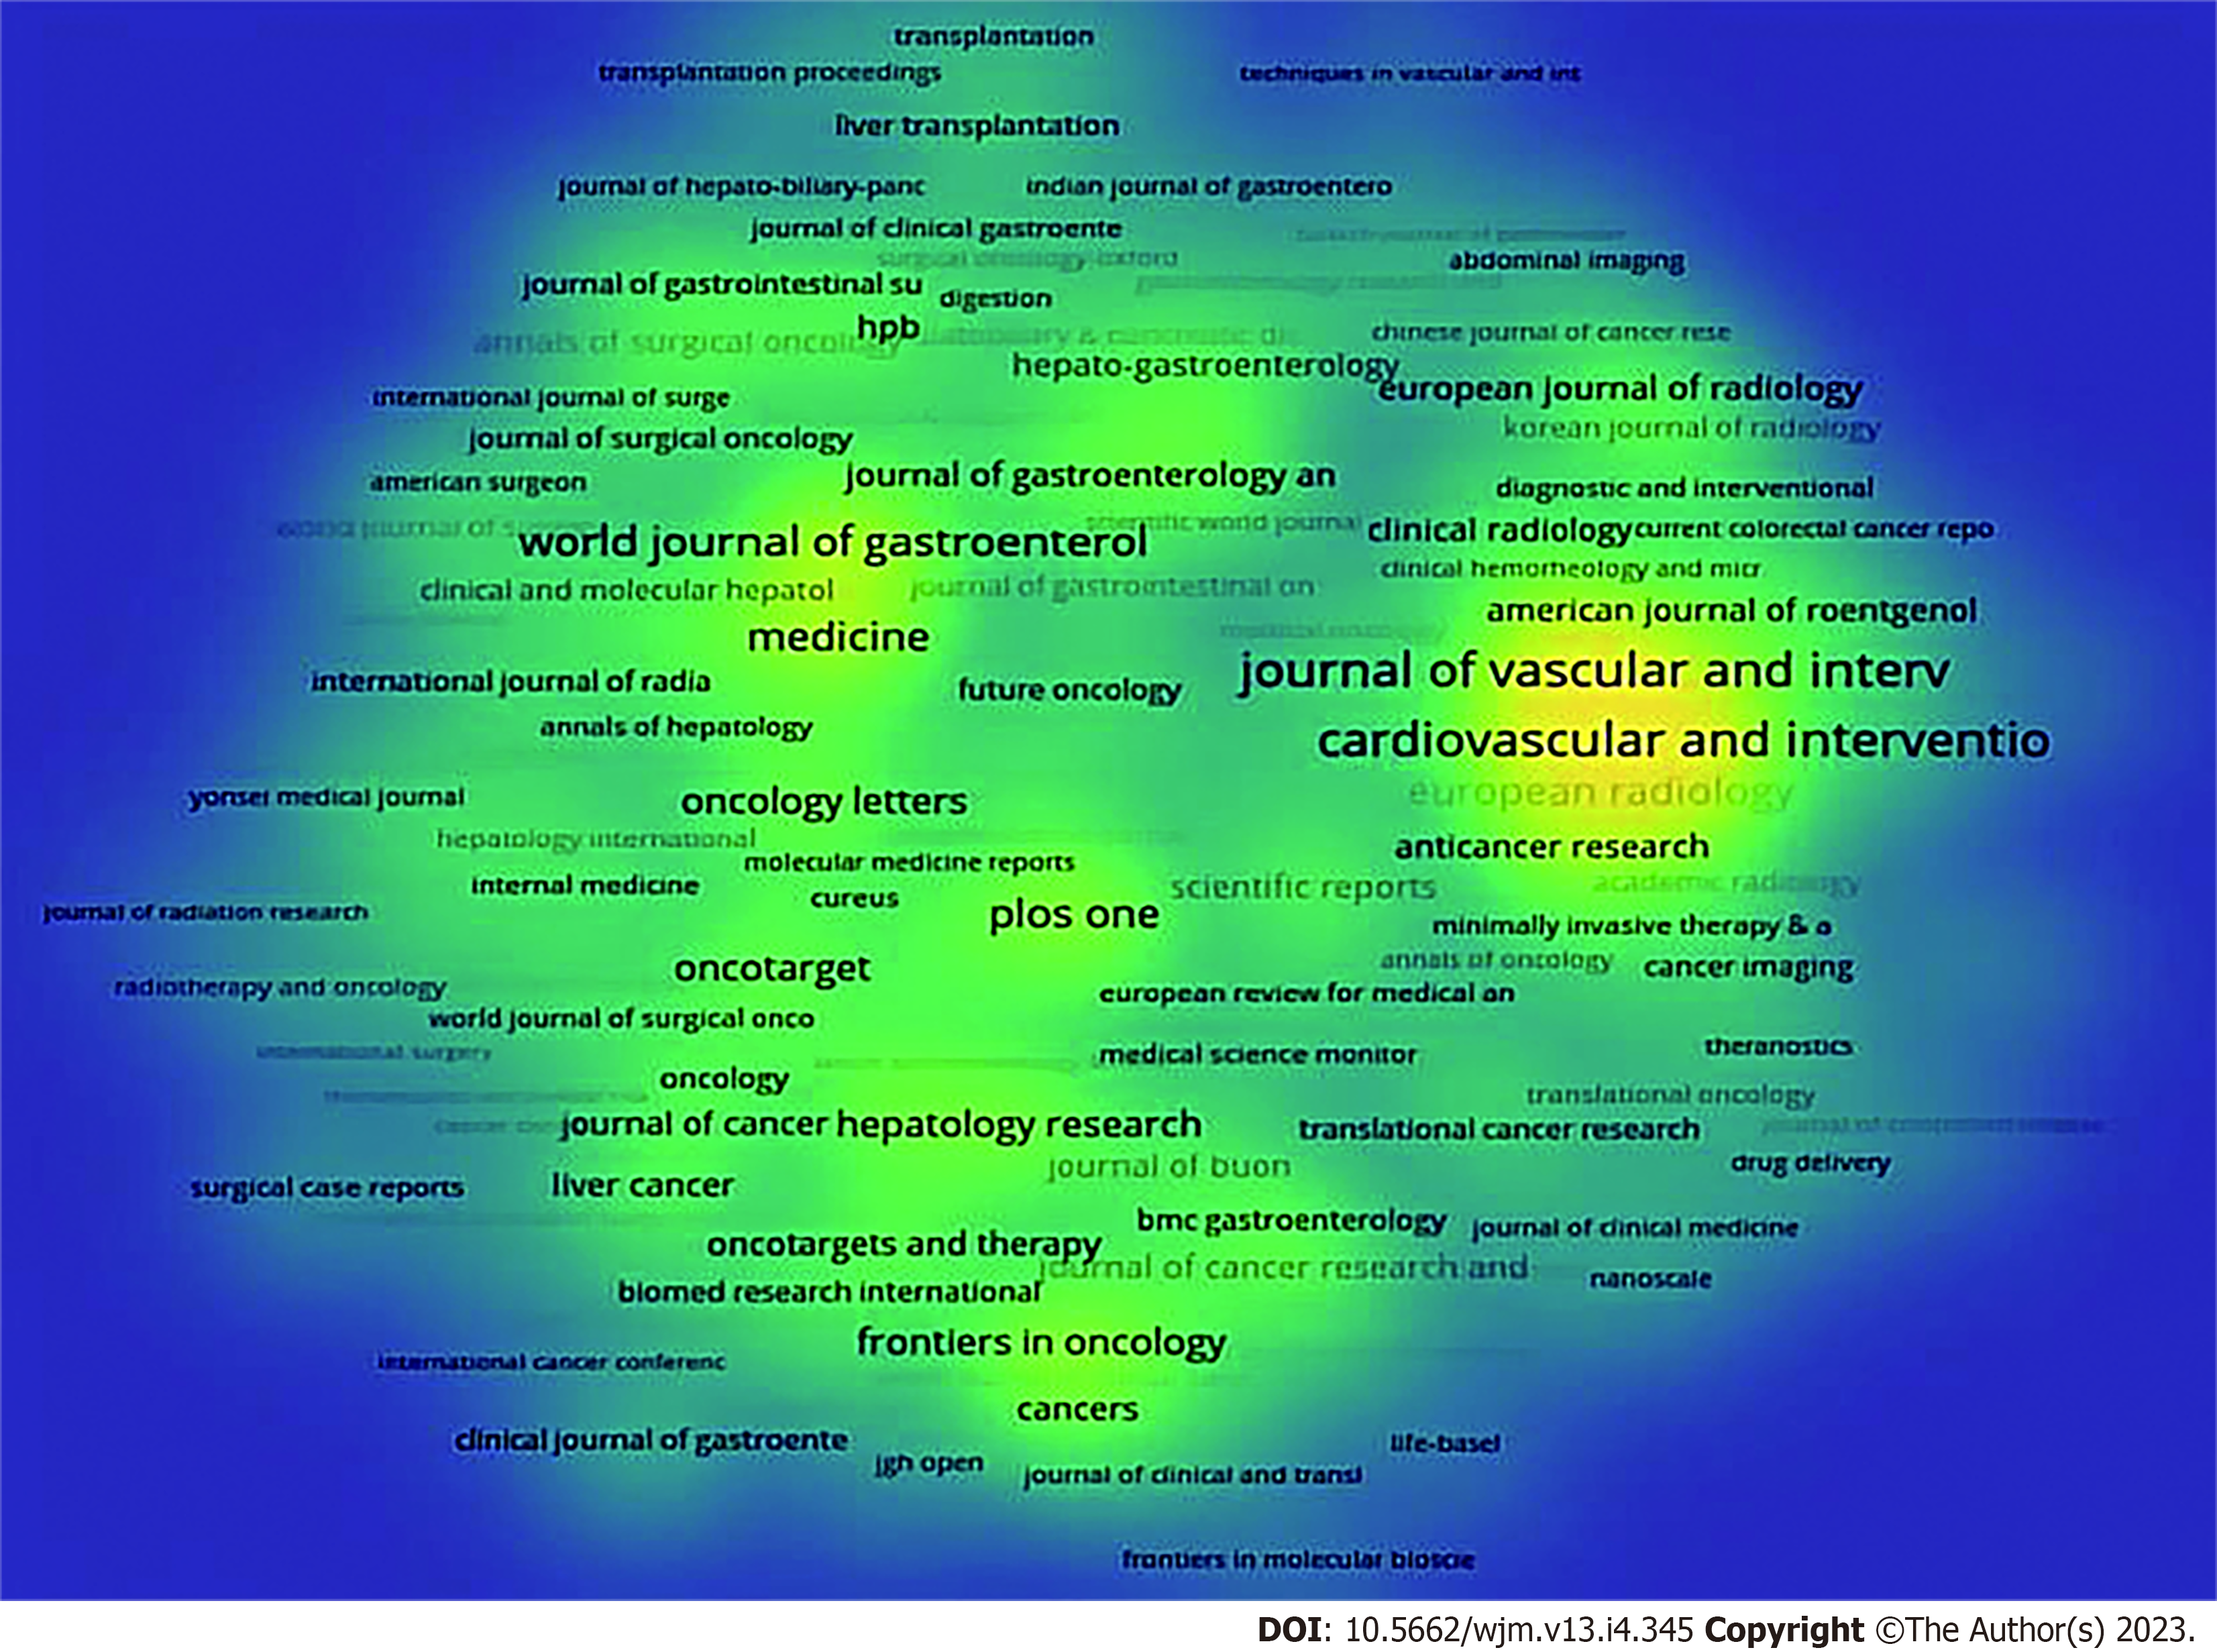
Figure 5 Density visualization for the most prolific journals.
The minimum number of documents of an organization was set at 5. Of the 857 journals that were involved in this field, 232 journals met the threshold. Yellow means appearing more frequently, while green means appearing less frequently.
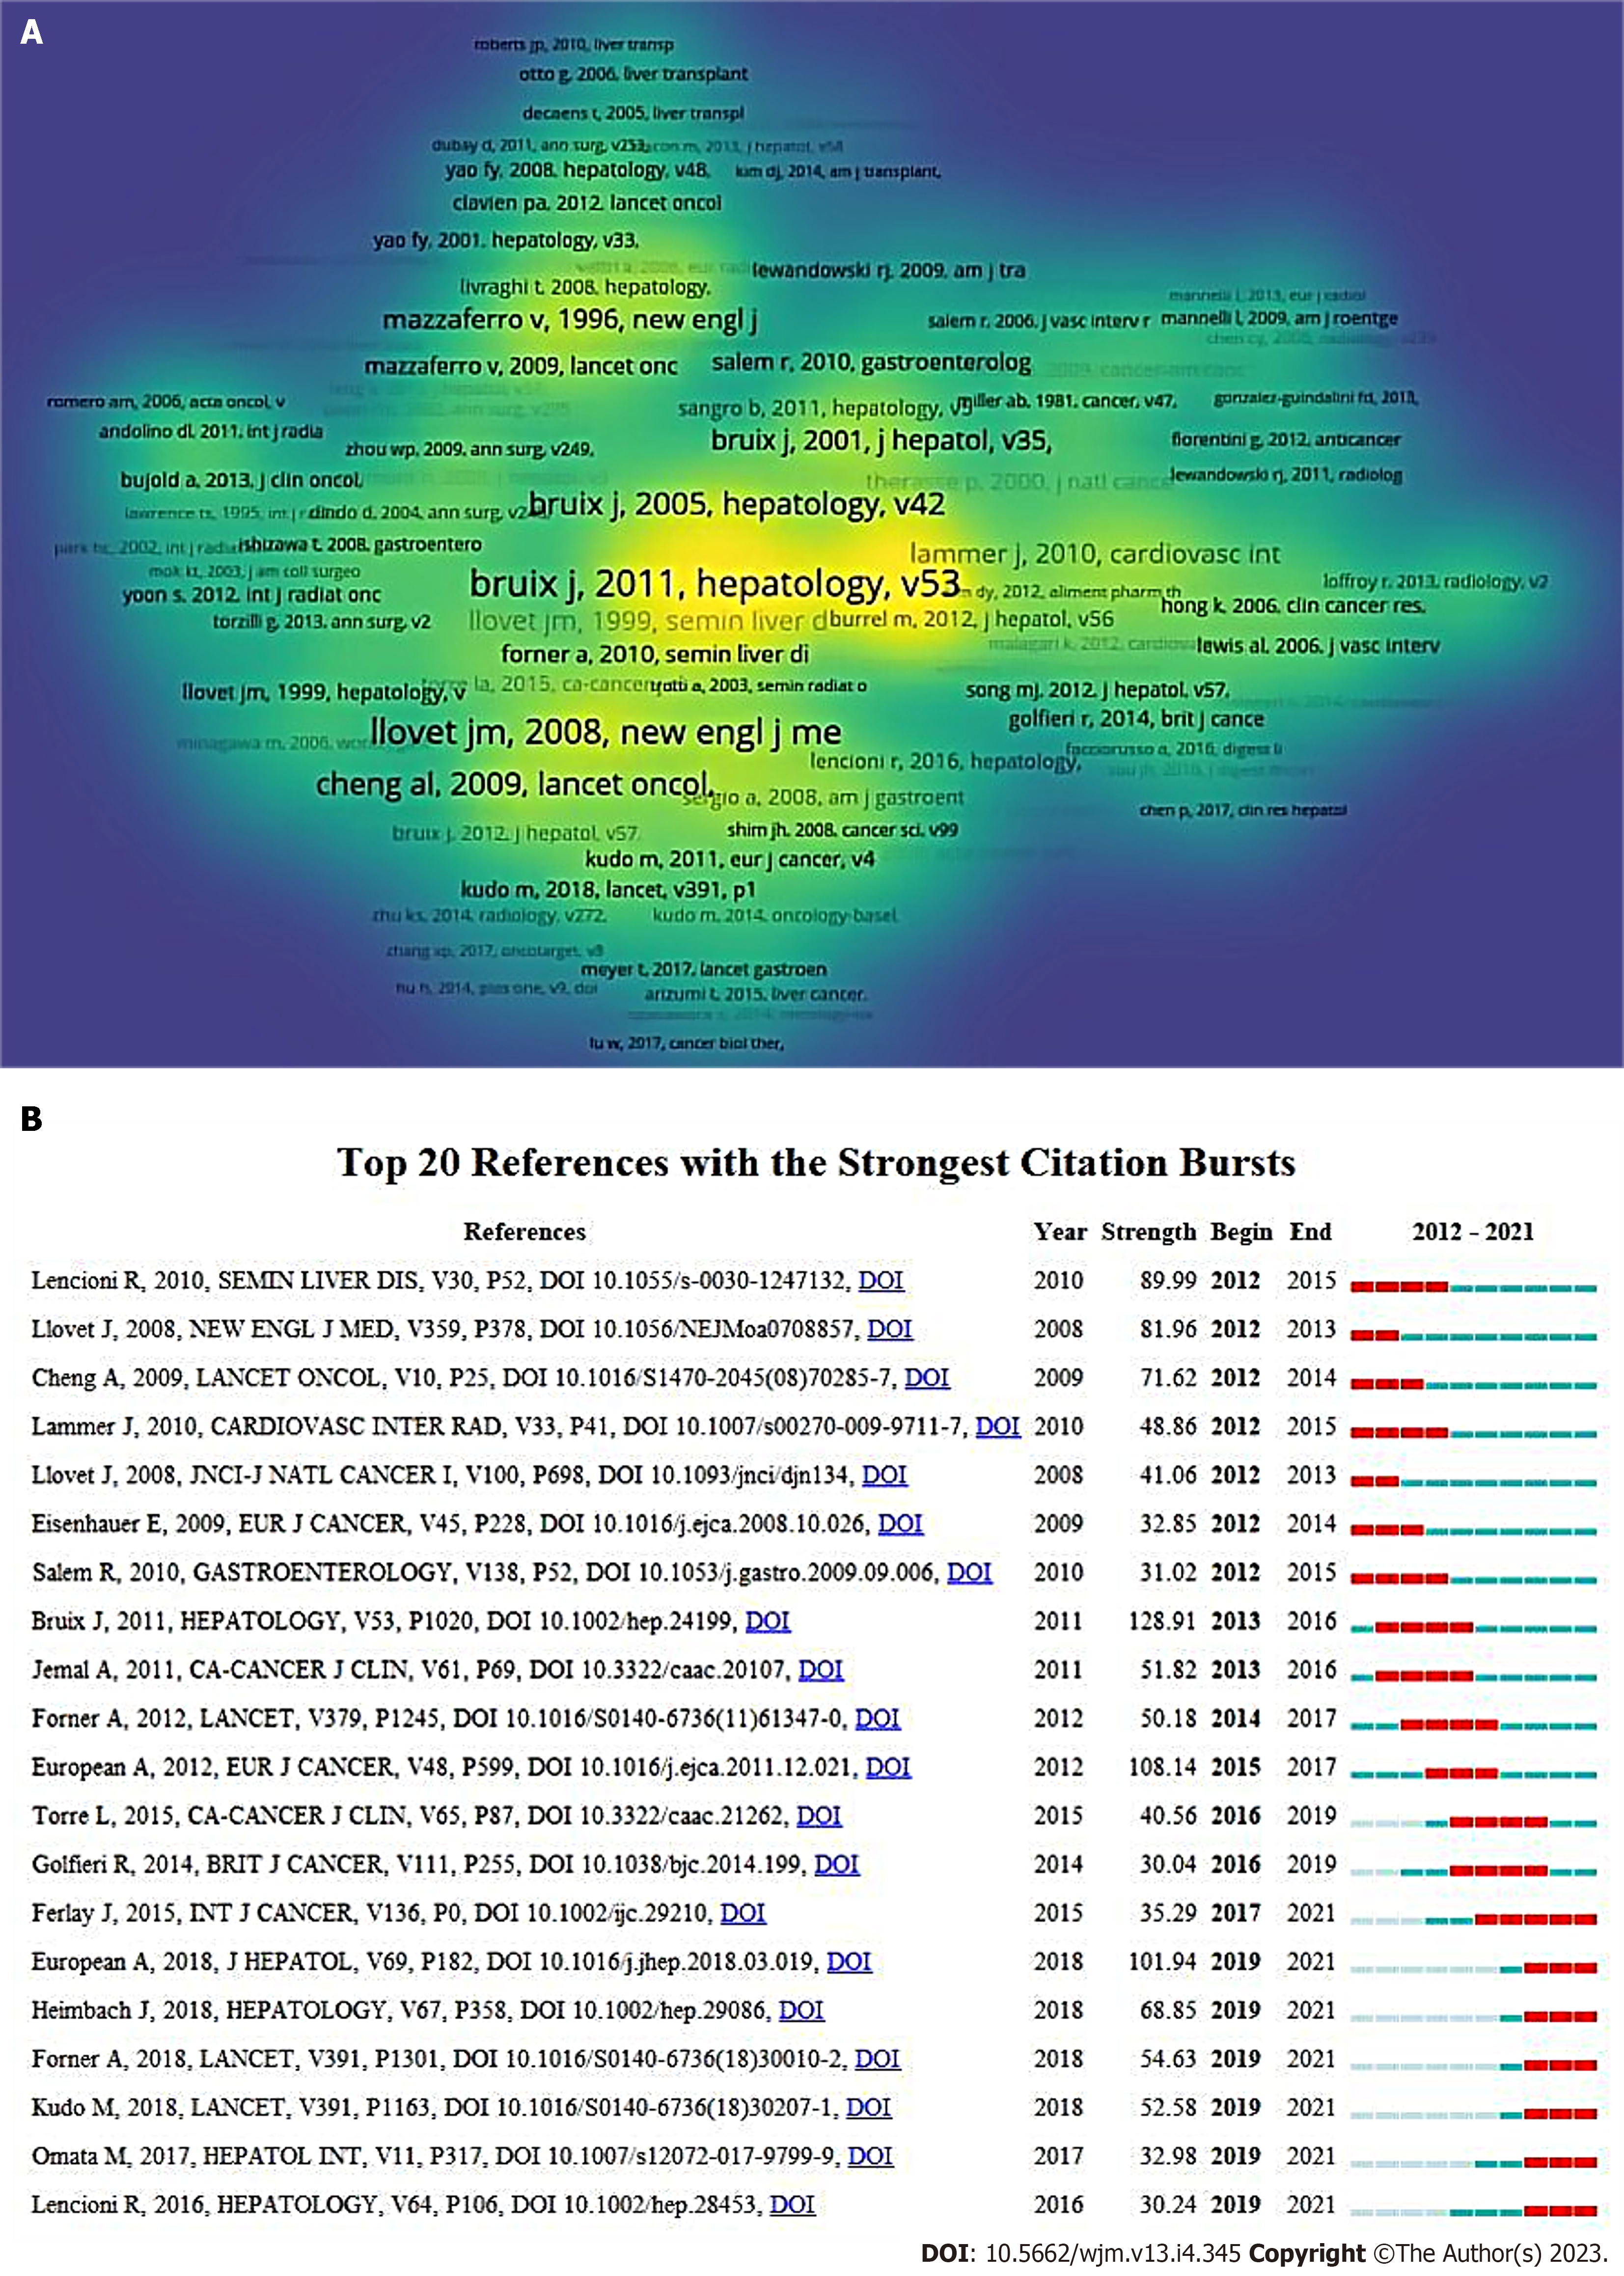
Figure 6 Shows the mapping of co-cited references based on transarterial chemoembolization treatment, depicts the top 20 references with the strongest citation explosion.
A: Density visualization of co-cited references. Of the 68527 references, 1159 (divided into six clusters) were cited at least 20 times. Yellow means appearing more frequently, while green means appearing less frequently; B: The top 20 co-cited references with the most citation burstiness. Years between “Begin” and “End” represent the period when the reference was more influential. Years in light green mean that the reference has not yet appeared, years in dark green mean that the reference is less influential, and years in red mean that the reference is more influential.
- Citation: Zhang N, He XF, Niu XK. Mapping research trends of transarterial chemoembolization for hepatocellular carcinoma from 2012 to 2021: A bibliometric analysis. World J Methodol 2023; 13(4): 345-358
- URL: https://www.wjgnet.com/2222-0682/full/v13/i4/345.htm
- DOI: https://dx.doi.org/10.5662/wjm.v13.i4.345


