Copyright
©The Author(s) 2023.
World J Methodol. Sep 20, 2023; 13(4): 223-237
Published online Sep 20, 2023. doi: 10.5662/wjm.v13.i4.223
Published online Sep 20, 2023. doi: 10.5662/wjm.v13.i4.223
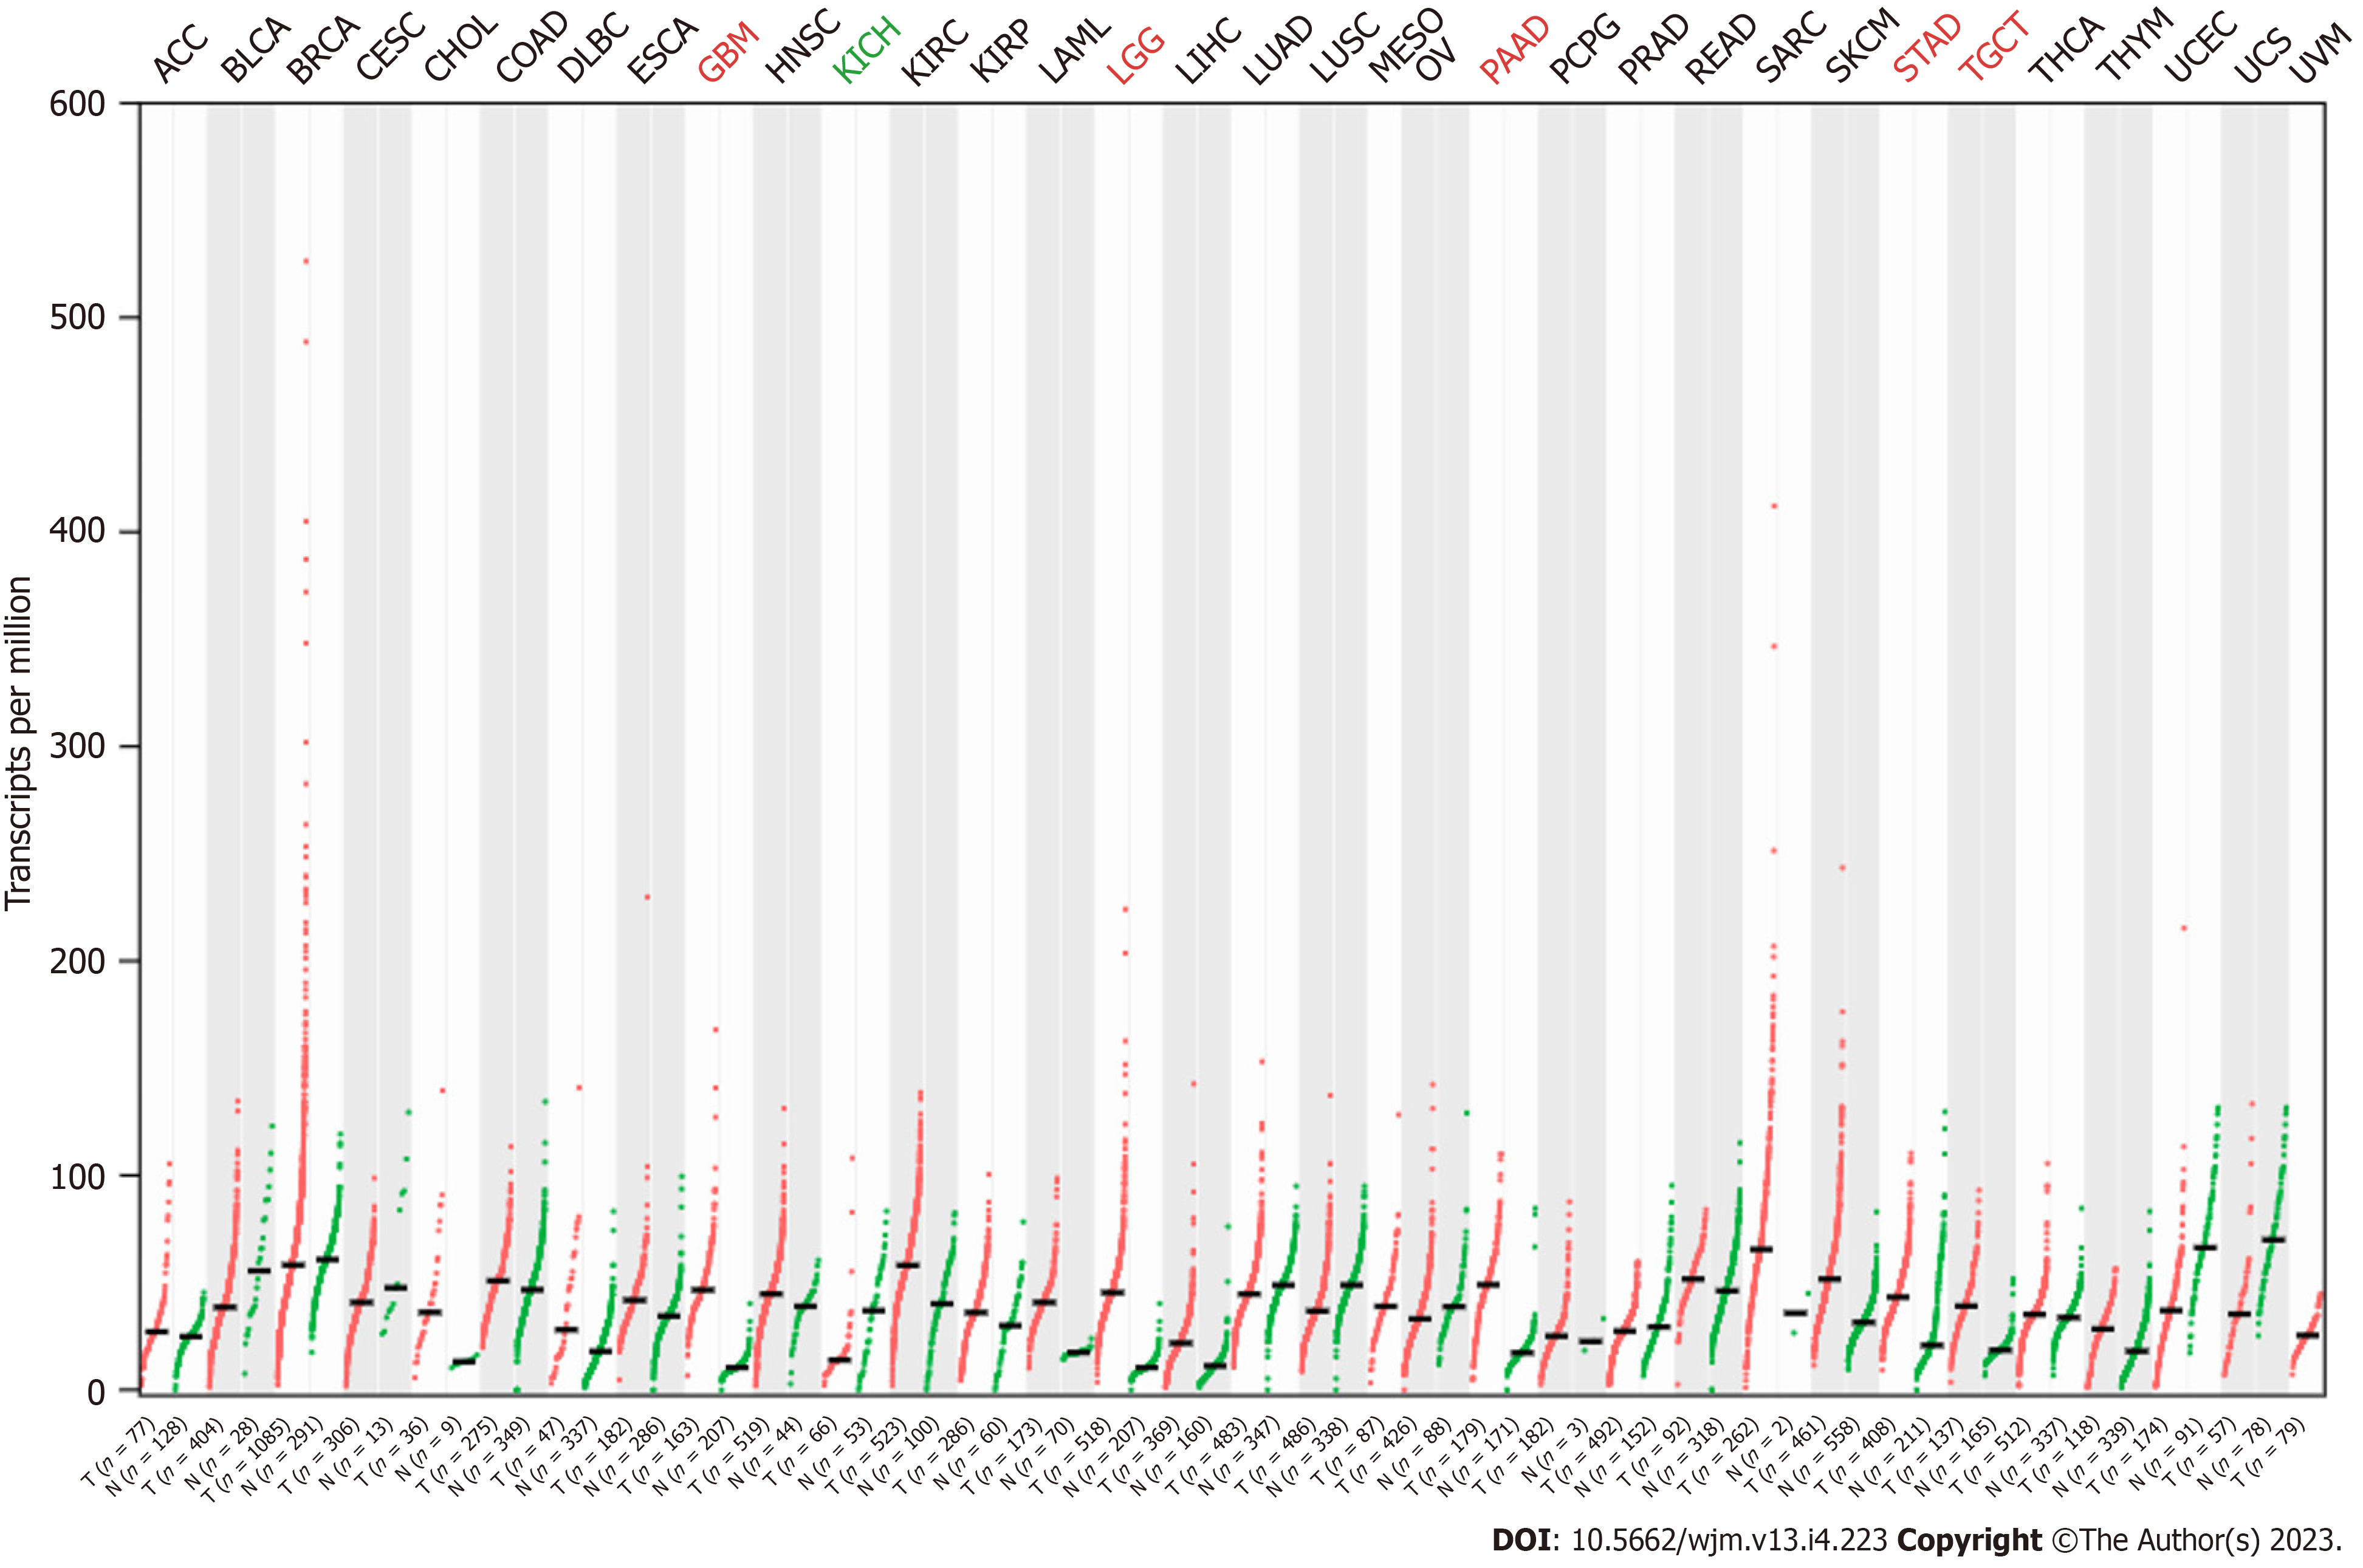
Figure 1 Expression of Ras suppressor 1 in different tumors.
Red dots indicate tumors, and green dots are corresponding normal tissue.
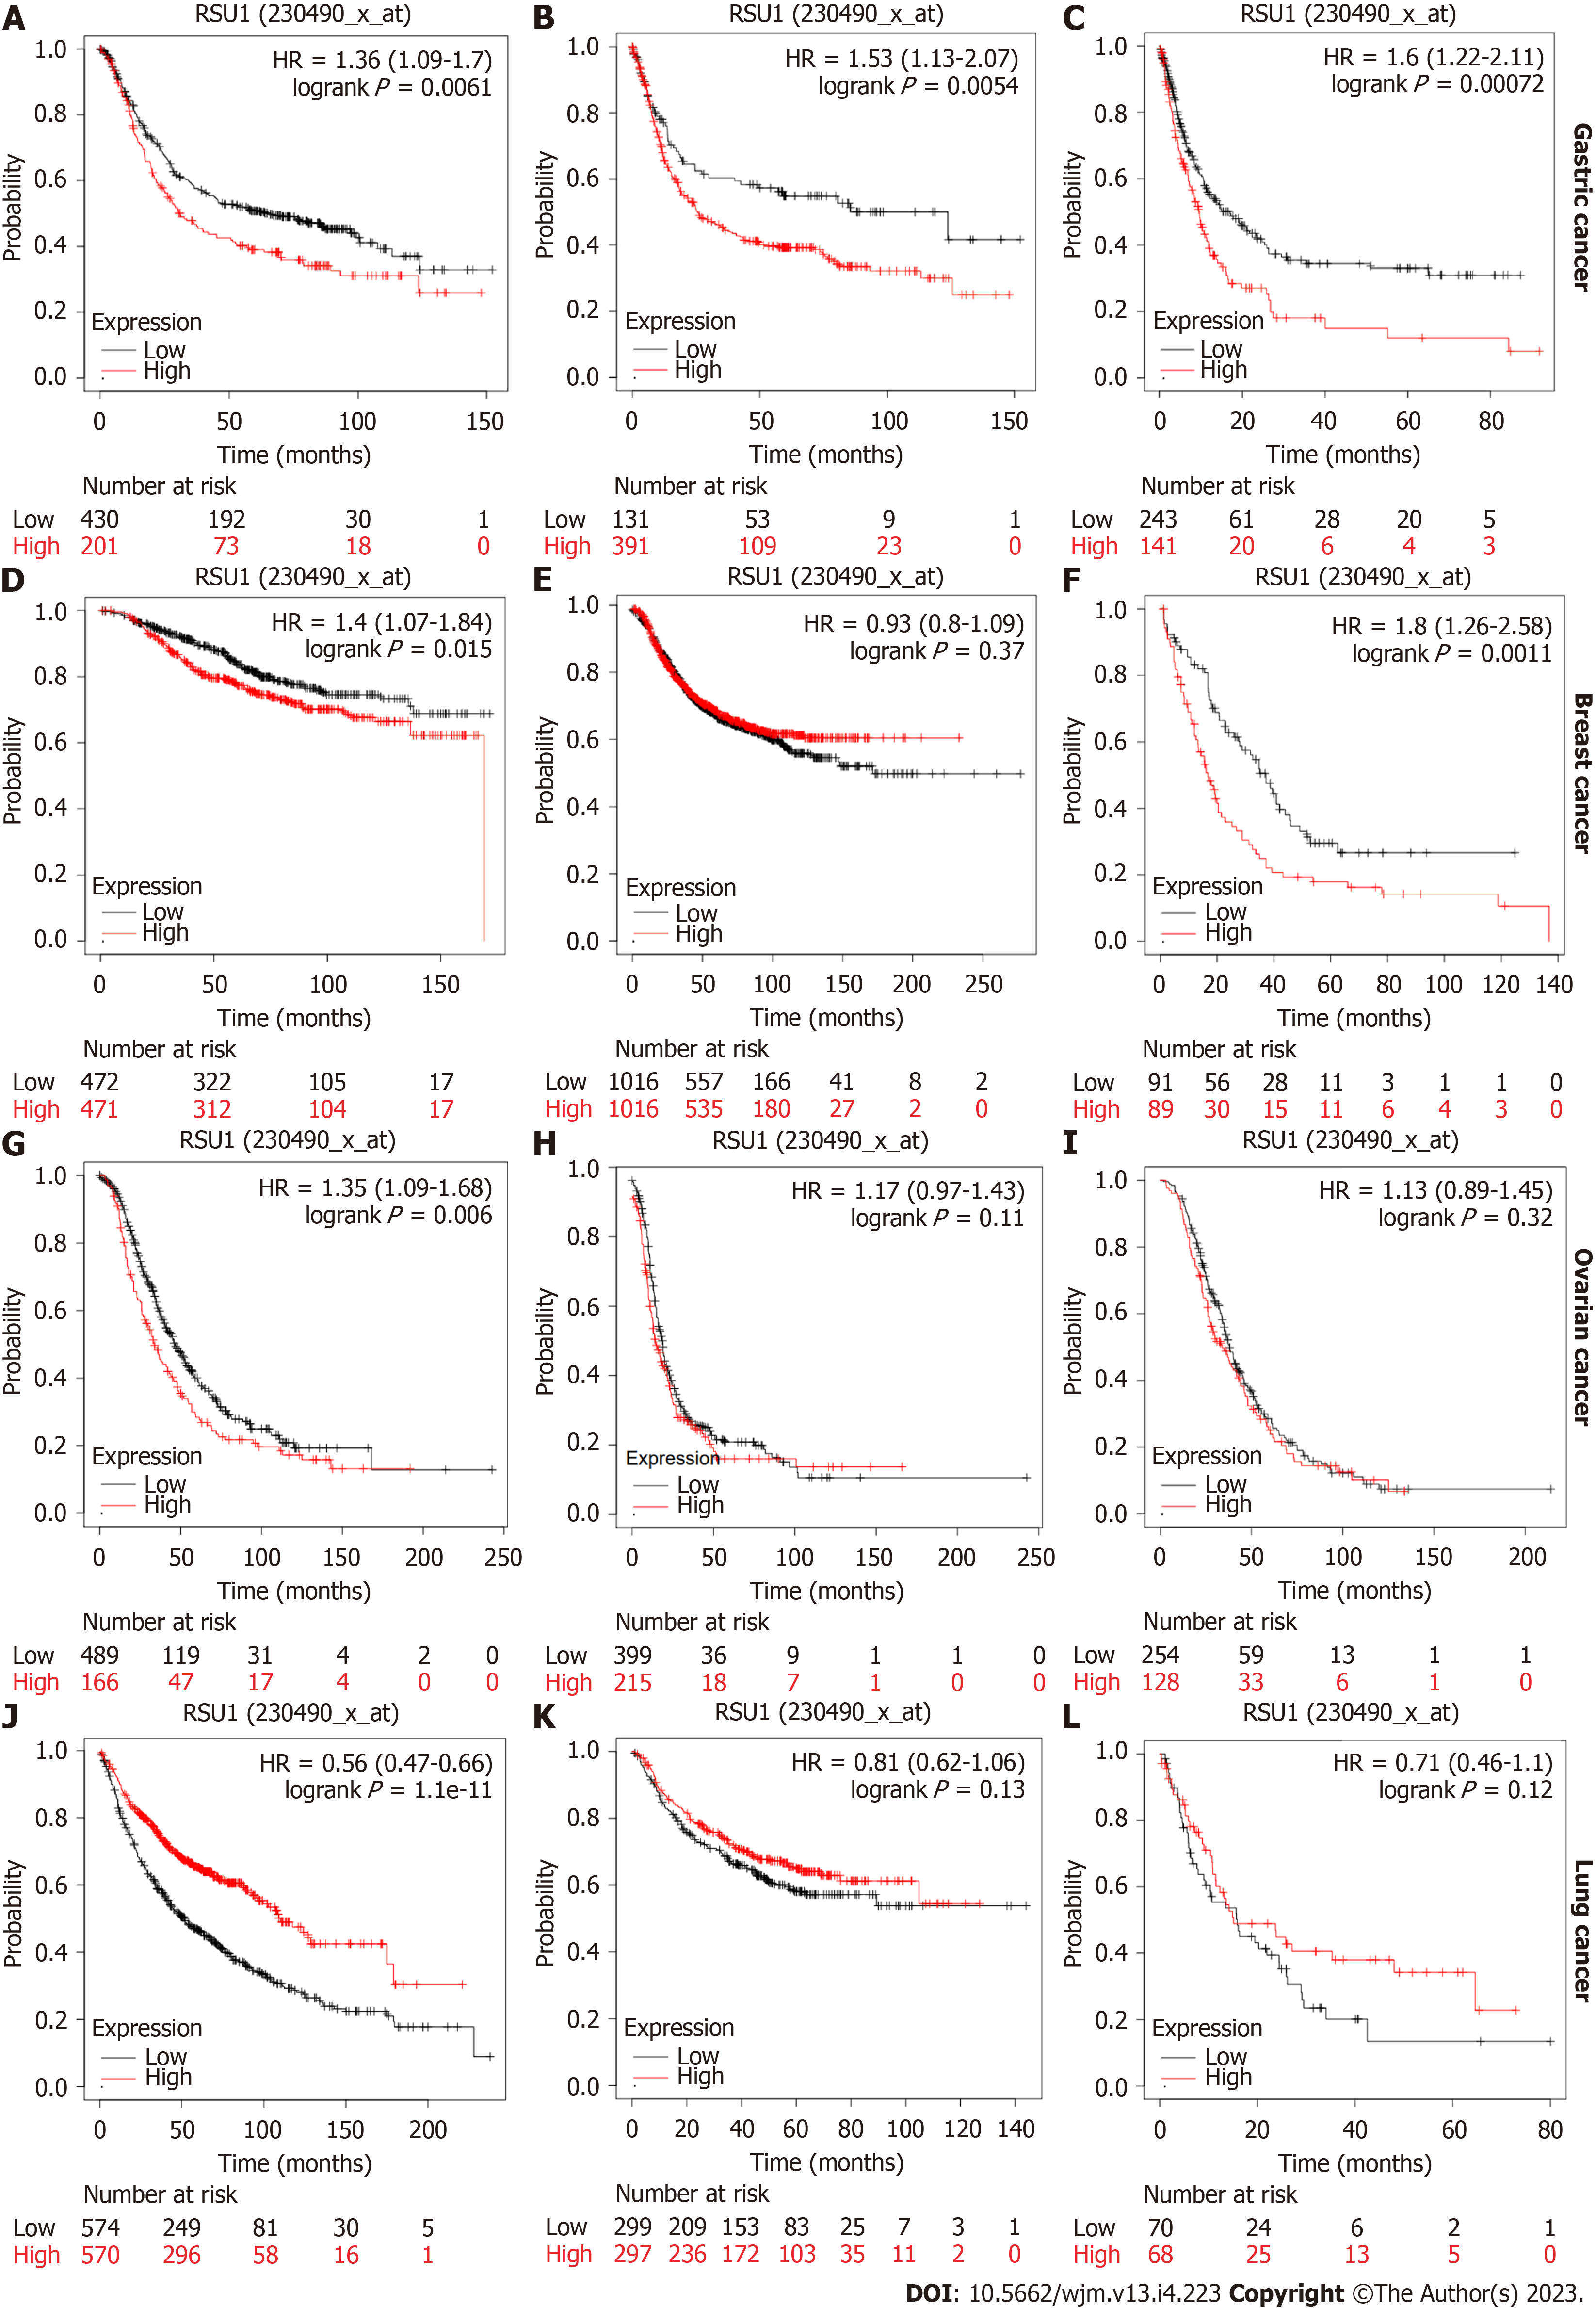
Figure 2 The prognostic value of Ras suppressor 1 in different tumors.
A: Overall survival (OS) in gastric cancers (GC); B: First progression (FP) in GC; C: Post-progression survival (PPS) in GC; D: OS in breast cancer (BC); E: PFS in BC; F: PPS in BC; G: OS in ovarian cancer (OC); H: PFS in OC; I: PPS in OC; J: OS in lung cancer (LC); K: FP in LC; L: PPS in LC.
Figure 3 The prognostic value of Ras suppressor 1 in patients with colorectal cancer.
A: Overall survival (OS), disease-free survival (DFS) and disease-specific survival (DSS) in GSE17536; B: OS, DFS and DSS in GSE17537.
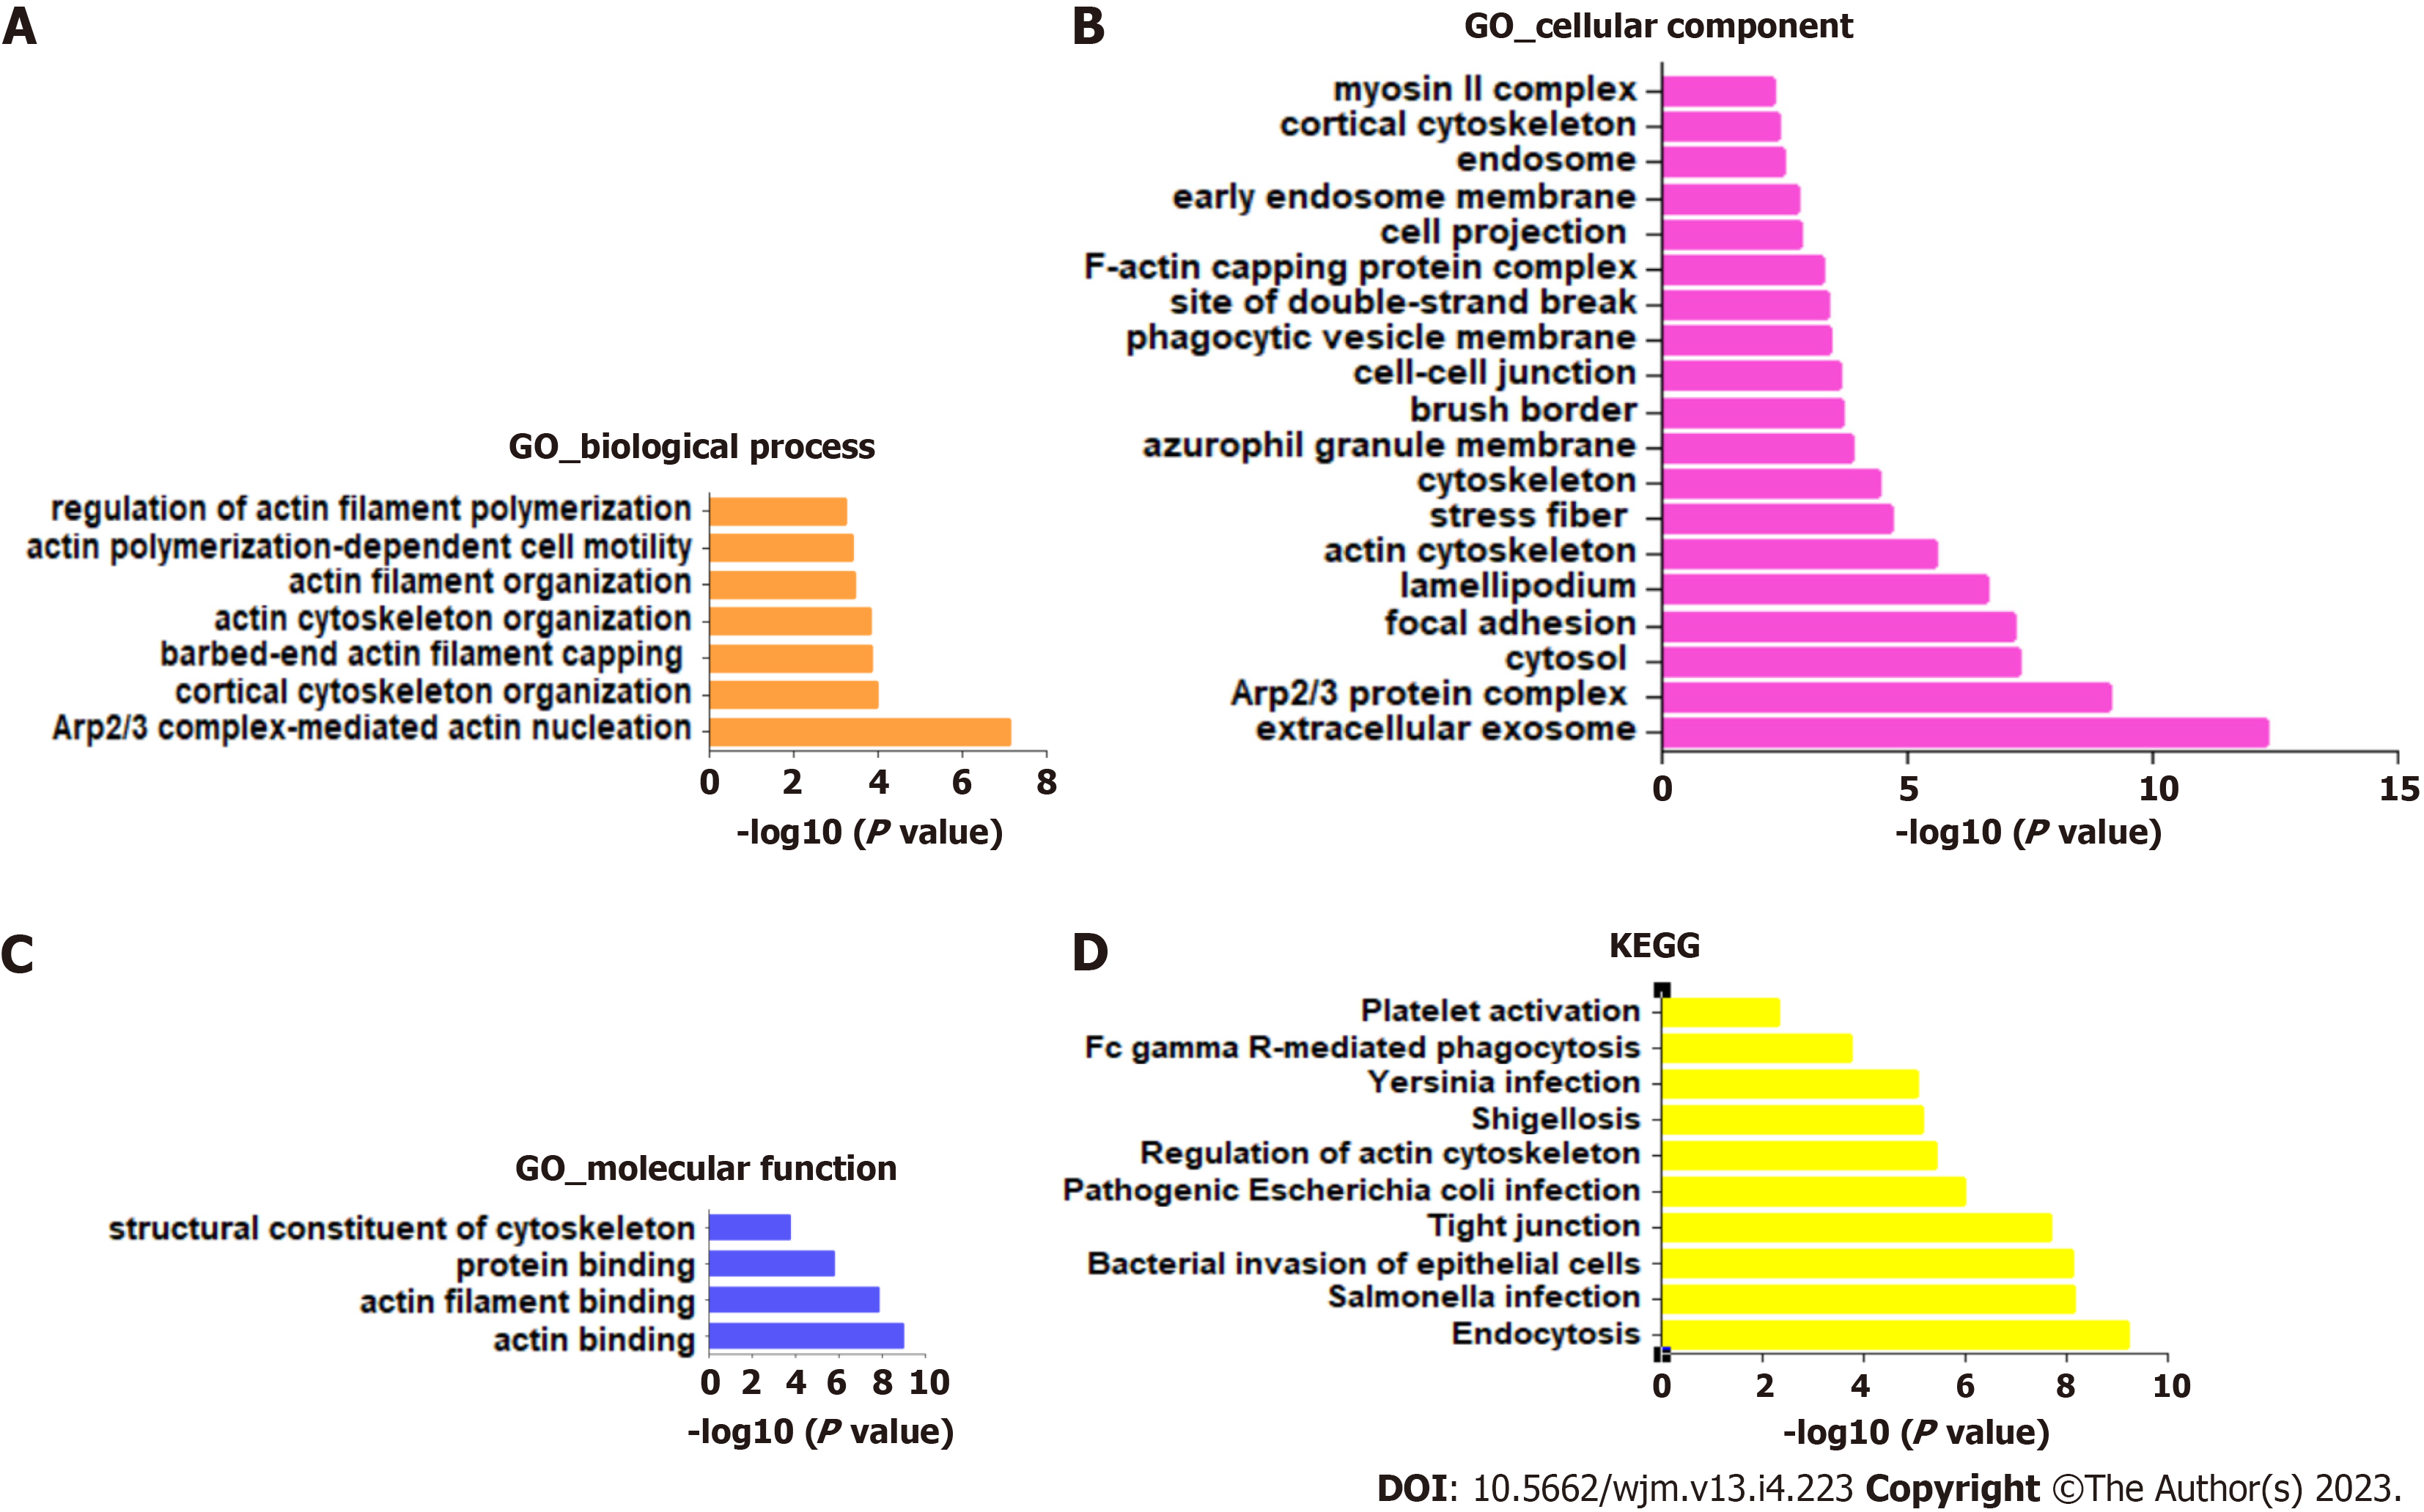
Figure 4 Pathway enrichment analysis of Ras suppressor 1-related genes.
A: Biological process; B: Cellular component; C: Molecular function; D: Kyoto Encyclopedia of Genes and Genomes.
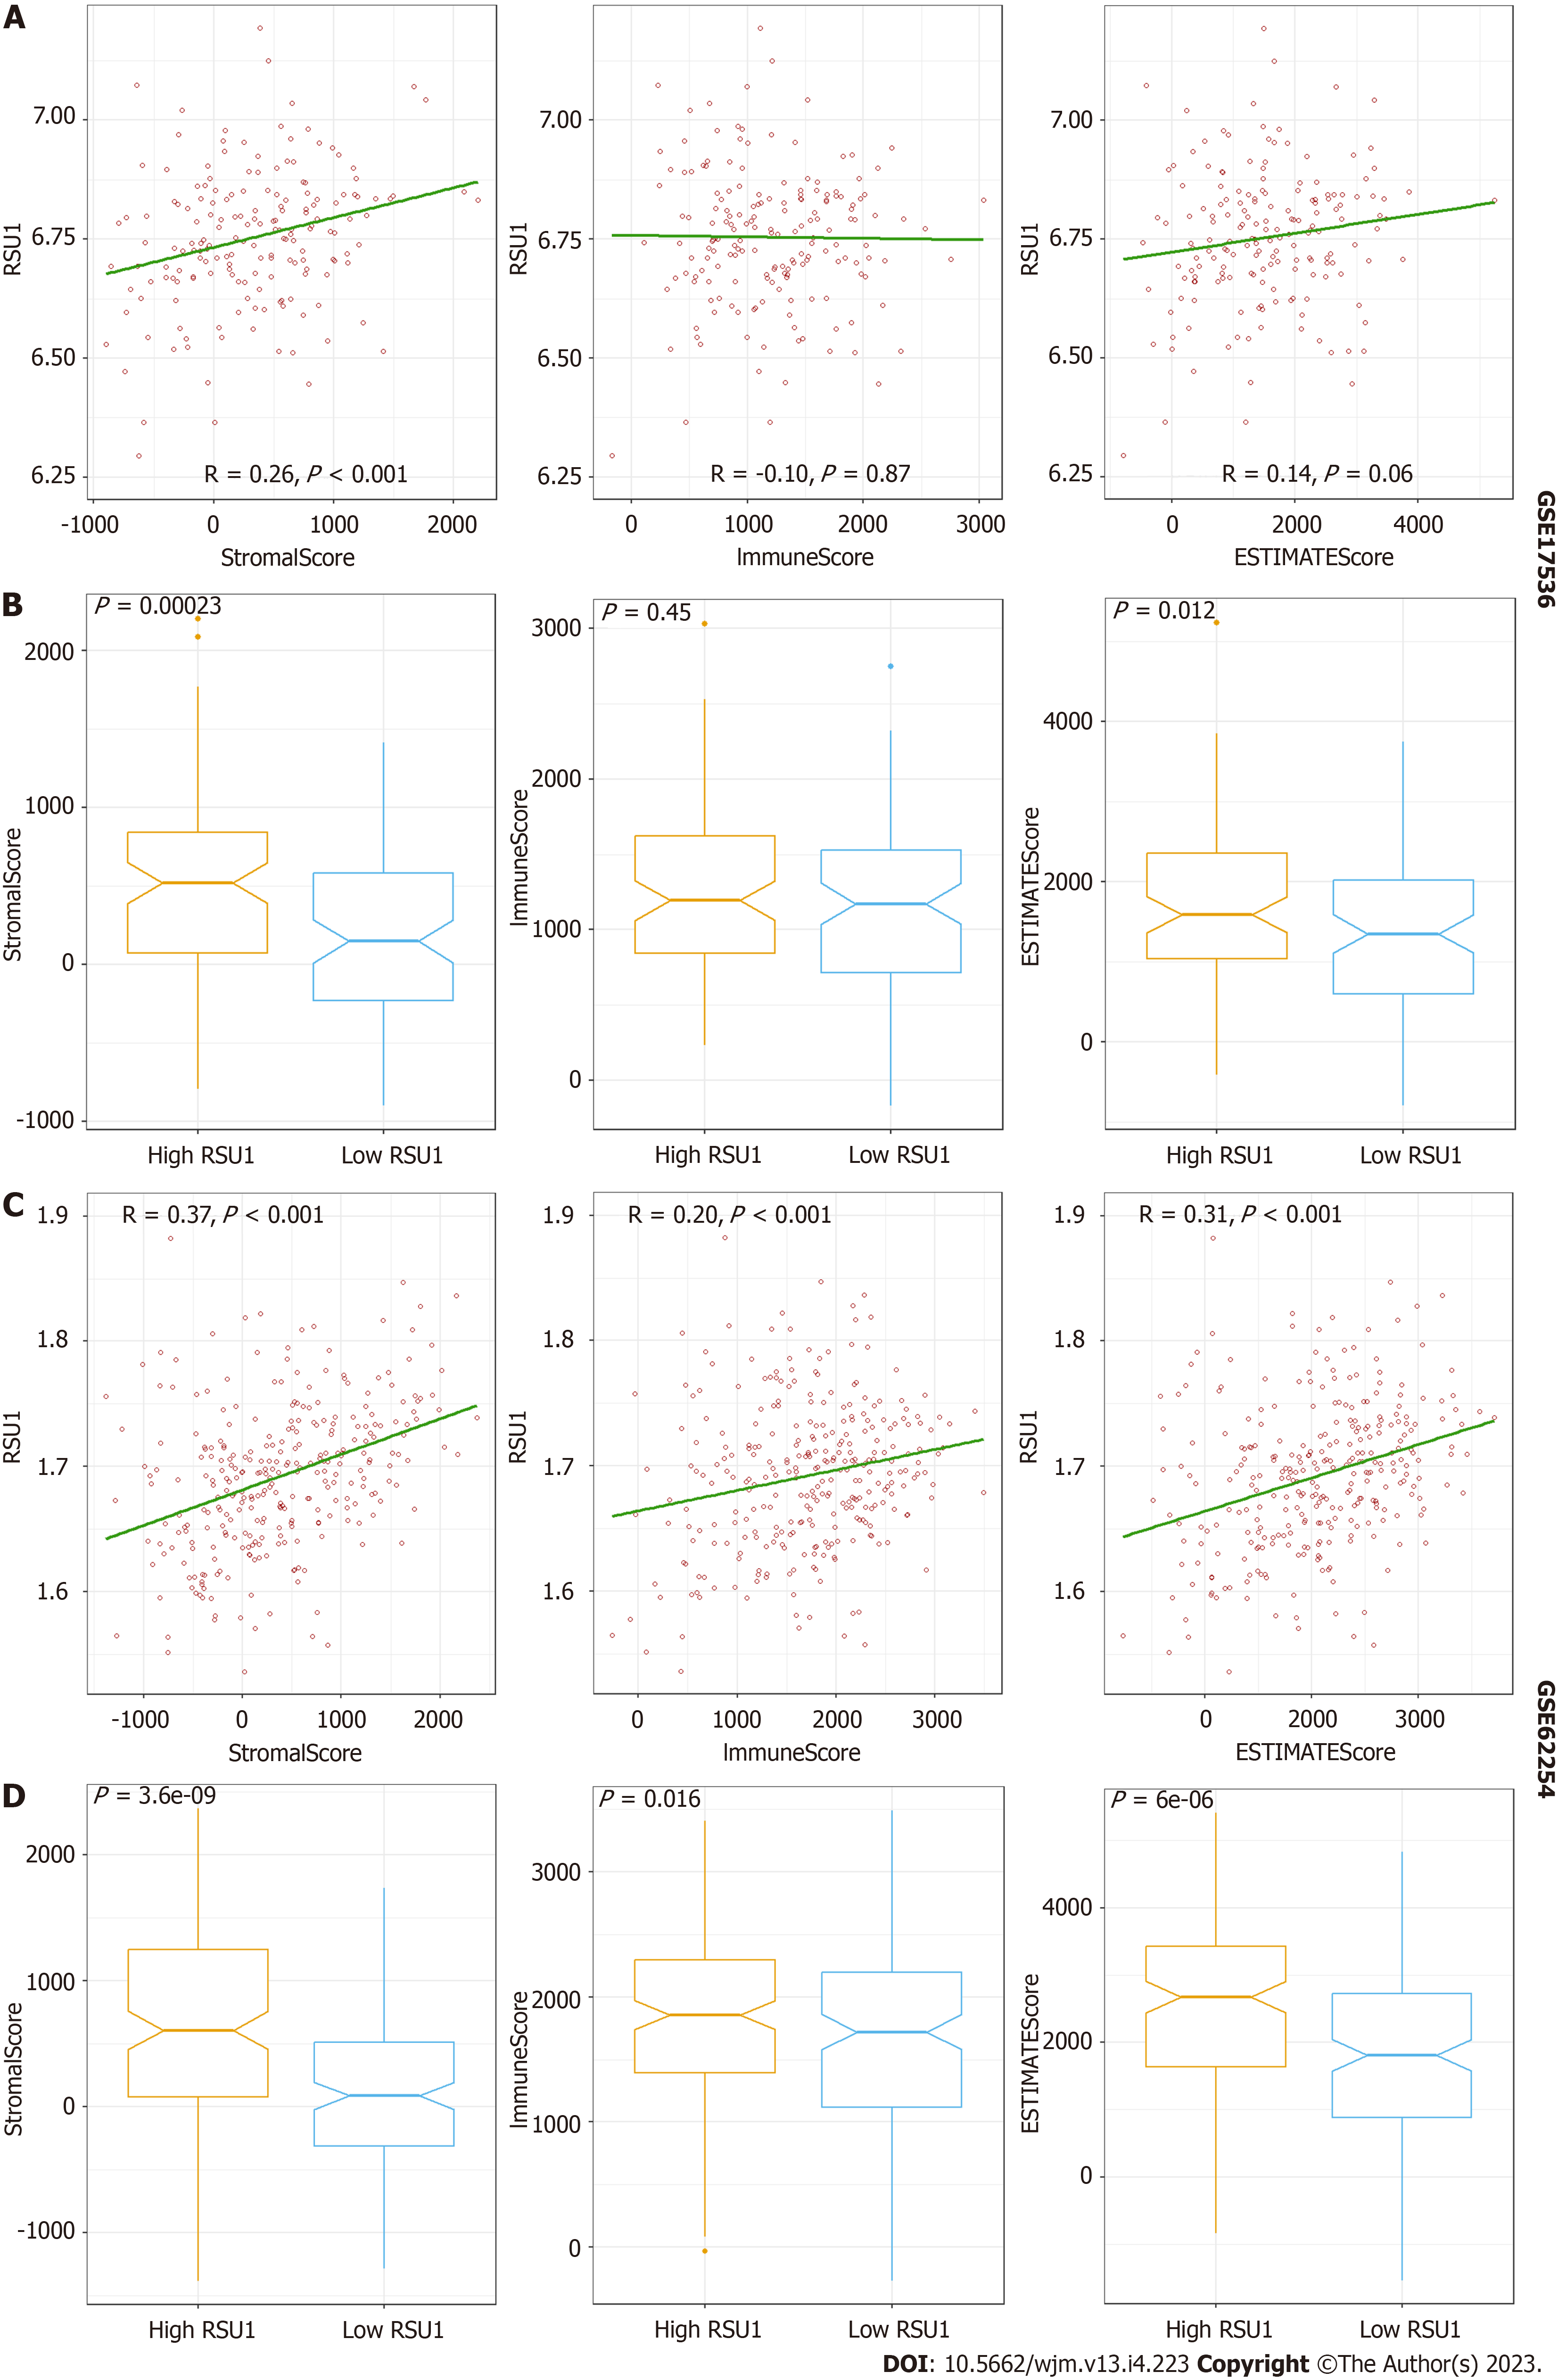
Figure 5 ESTIMATE analyses of Ras suppressor 1 with StromaScore, ImmuneScore and ESTIMATEScore.
A and B: Correlation with Ras suppressor 1 (RSU1) level in colorectal cancer; C and D: Correlation with RSU1 level in GC.
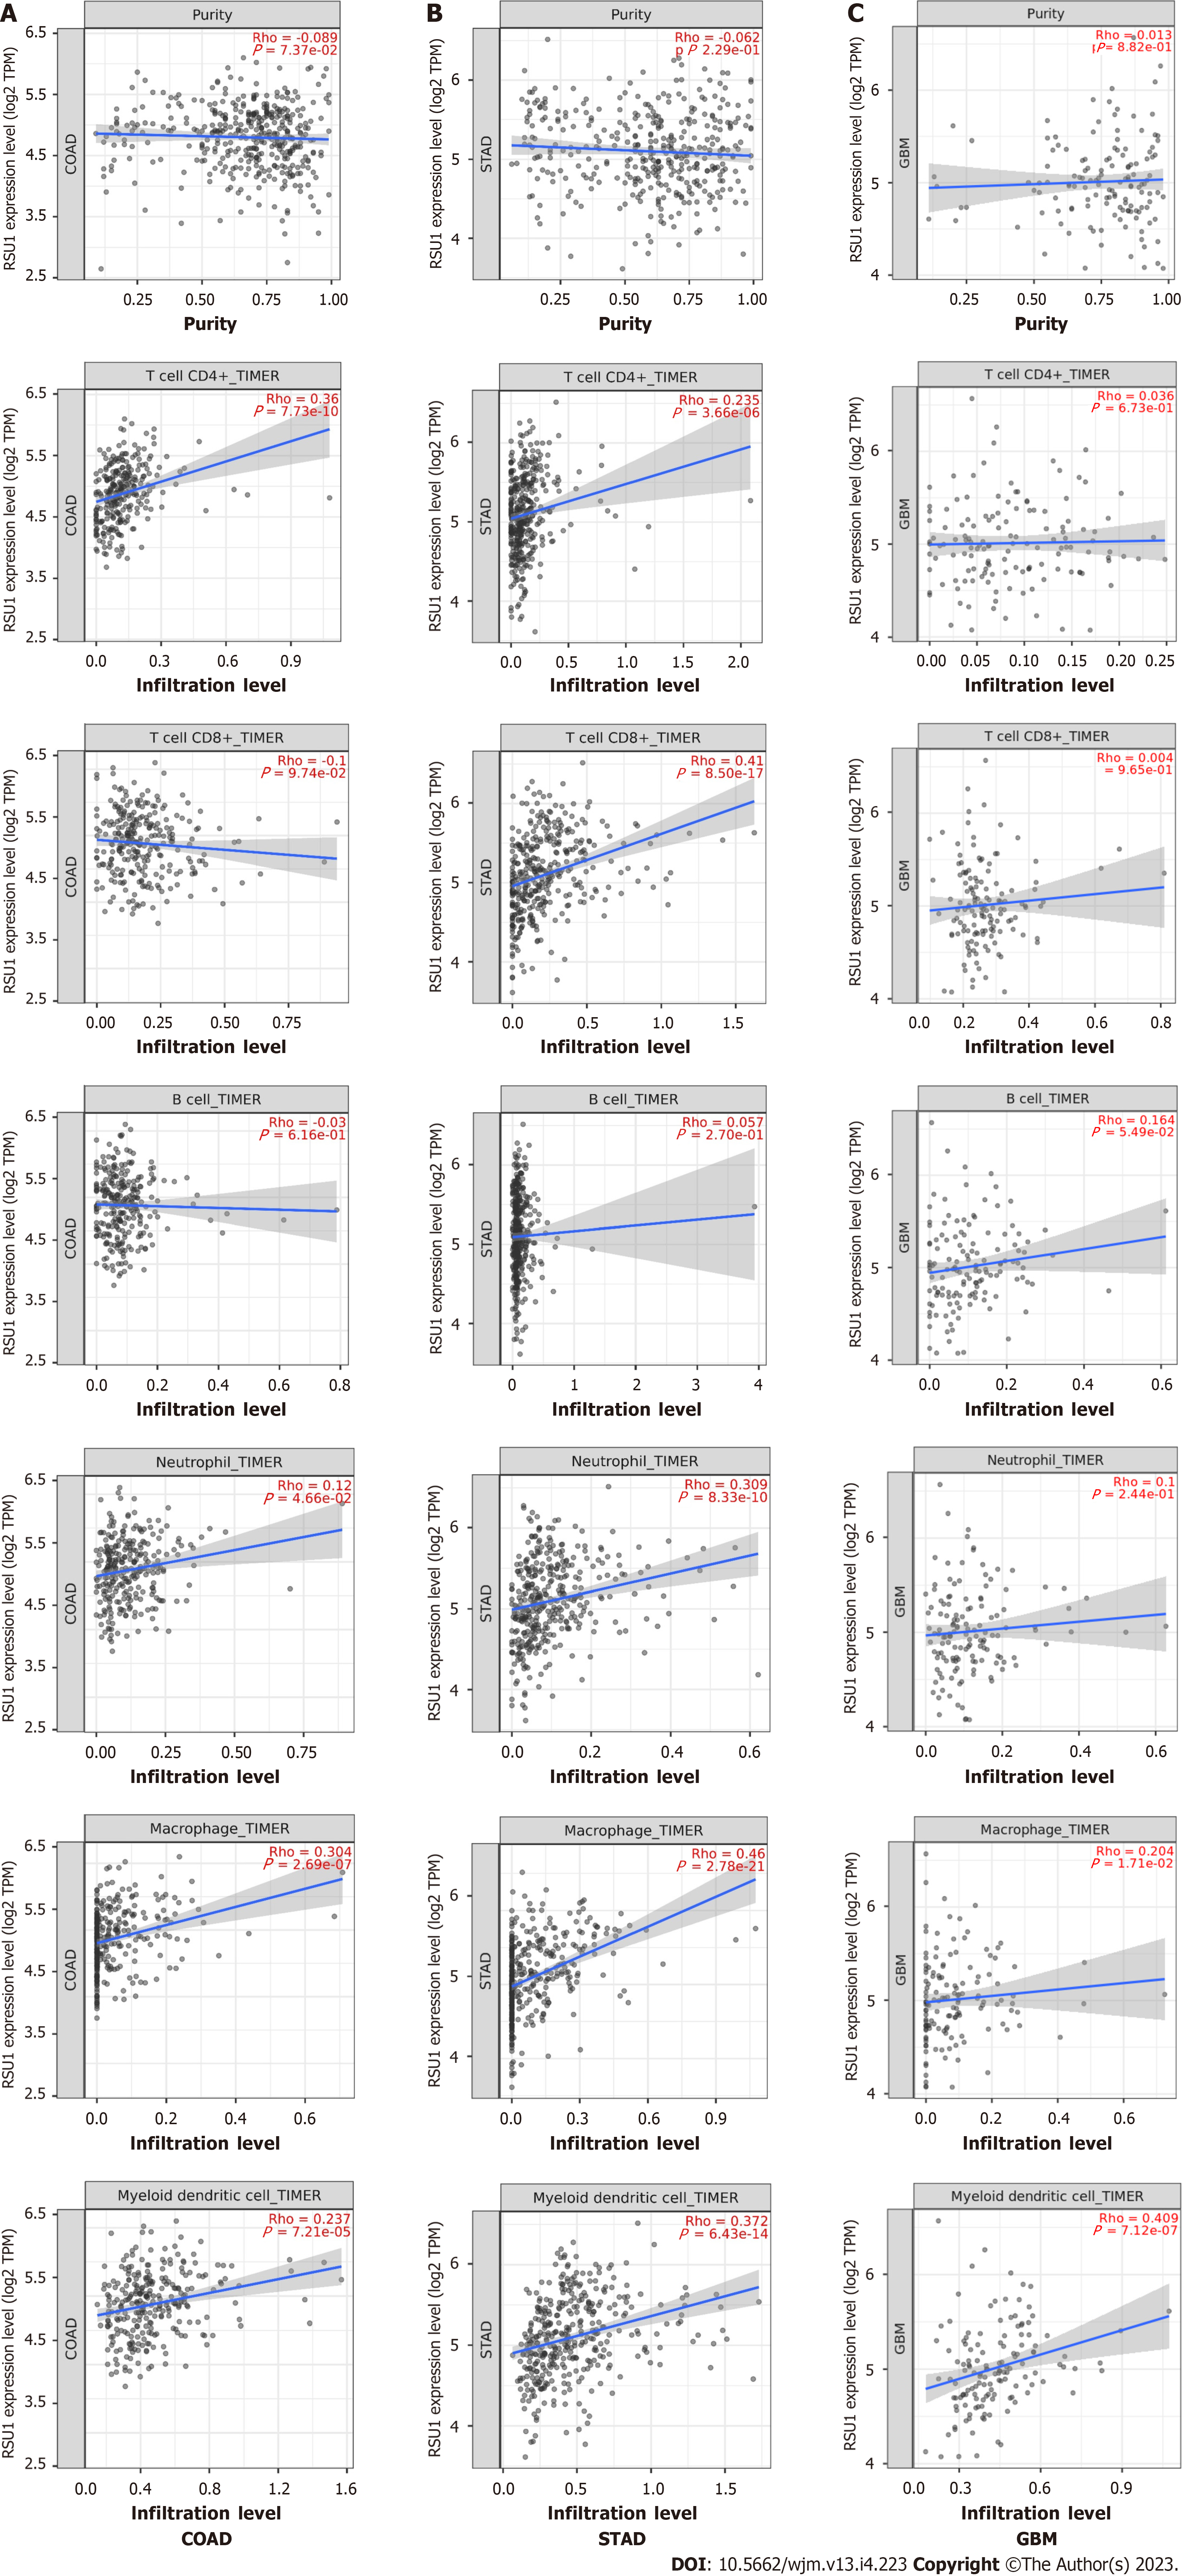
Figure 6 Correlation between Ras suppressor 1 expression and immune infiltration levels in COAD, STAD and GBM using TIMER2.
0. A: COAD; B: STAD; C: GBM.
- Citation: Xu Y, Hou YY, Wu Z, Fang ZX, Wu HT, Liu J. Comprehensive analysis of cell-extracellular matrix protein Ras suppressor-1 in function and prognosis of gastrointestinal cancers. World J Methodol 2023; 13(4): 223-237
- URL: https://www.wjgnet.com/2222-0682/full/v13/i4/223.htm
- DOI: https://dx.doi.org/10.5662/wjm.v13.i4.223


