
















Copyright: ©Author(s) 2026.
World J Transl Med. Sep 28, 2026; 12(3): 124154
Published online Sep 28, 2026. doi: 10.5528/wjtm.124154
Published online Sep 28, 2026. doi: 10.5528/wjtm.124154
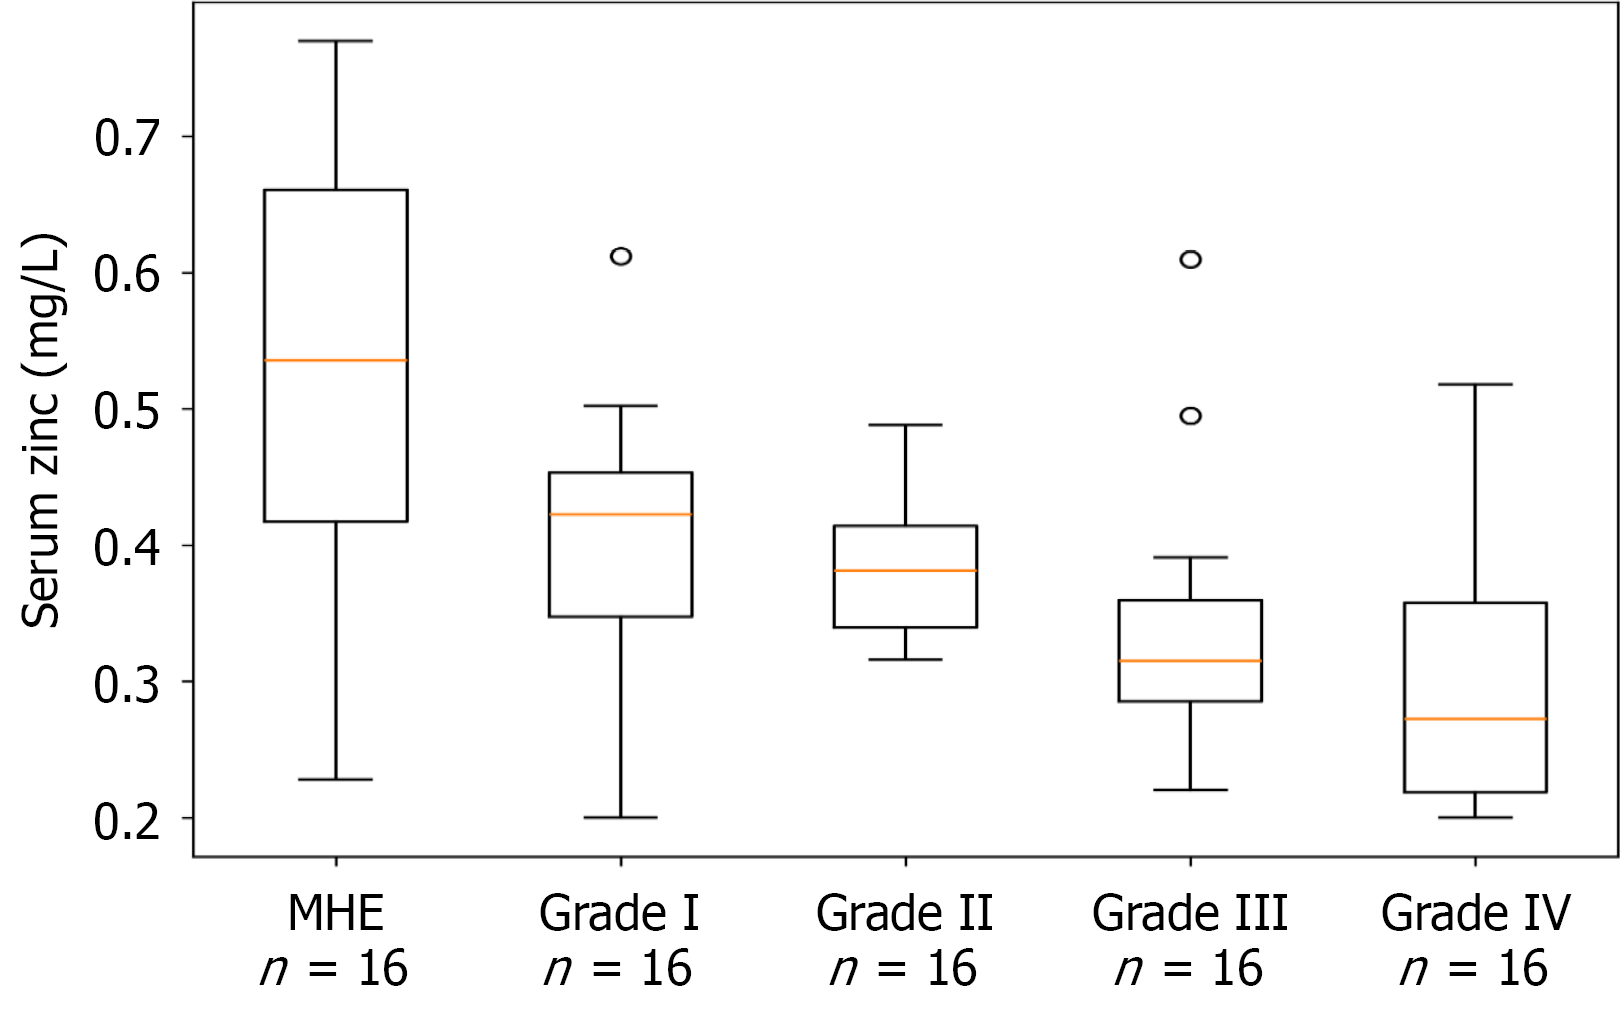
Figure 1 Serum zinc concentrations in patients with chronic liver disease according to the severity of hepatic encephalopathy.
The box plots show the median, interquartile range, and range of serum zinc concentrations for minimal hepatic encephalopathy, Grade I, Grade II, Grade III, and Grade IV hepatic encephalopathy (n = 16 per group). MHE: Minimal hepatic encephalopathy.
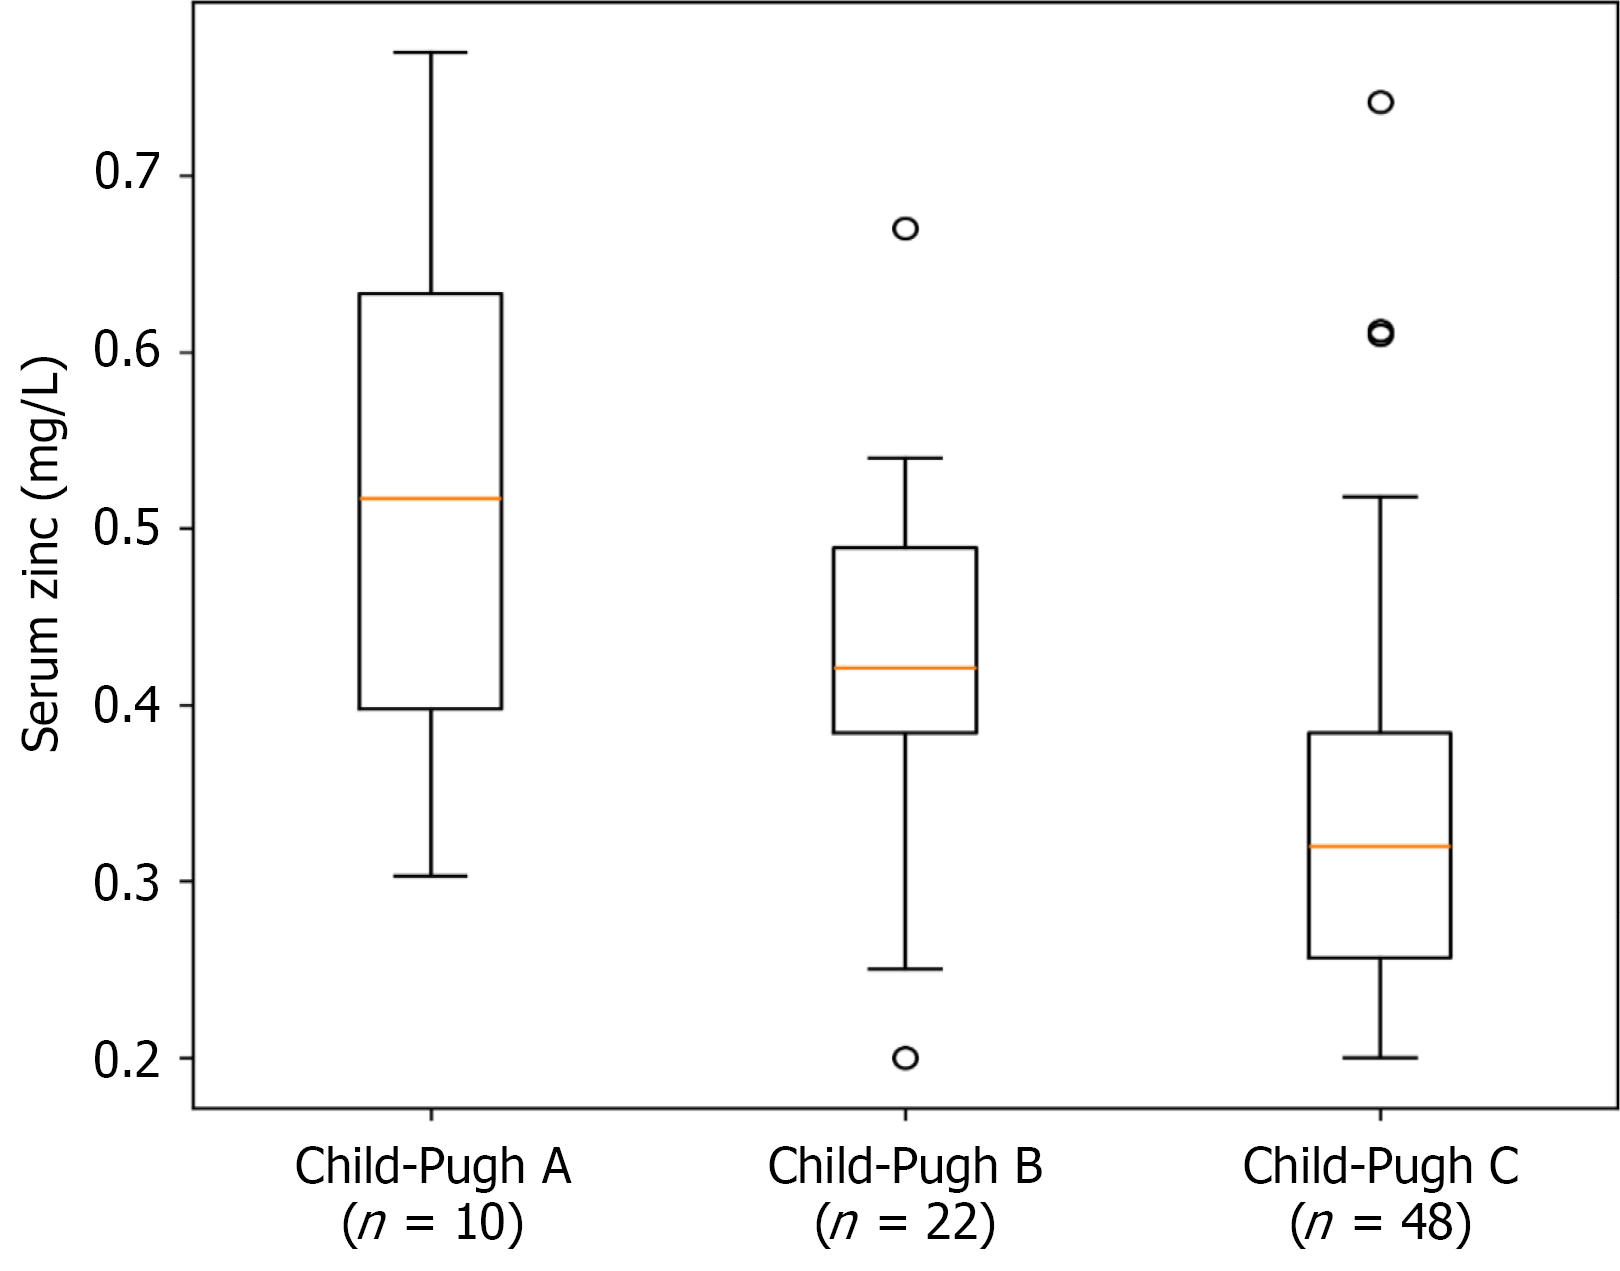
Figure 2 Serum zinc concentrations in patients with chronic liver disease according to Child-Pugh classification.
The box plots show the median, interquartile range, and range of serum zinc concentrations across Child-Pugh classes.
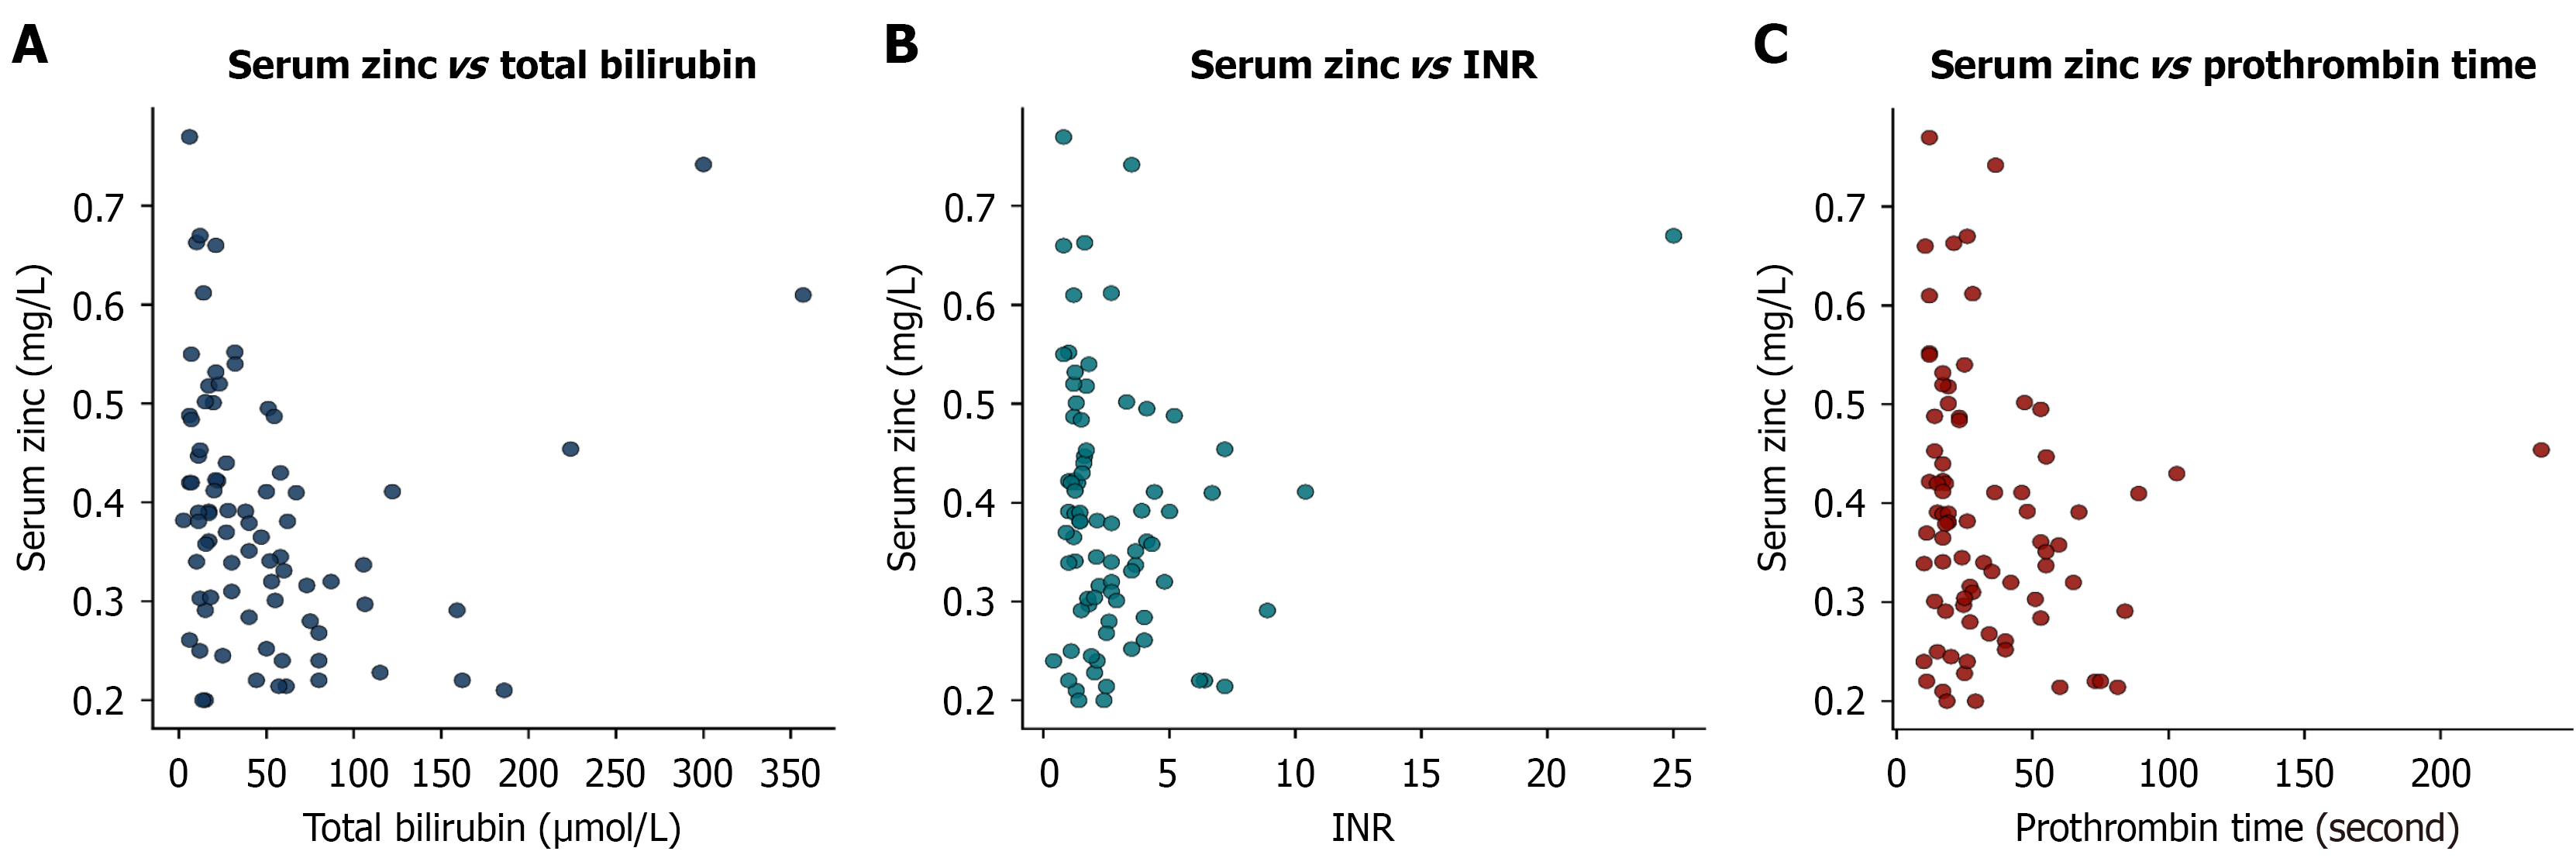
Figure 3 Correlations between serum zinc concentrations and liver function parameters in patients with chronic liver disease.
A: Scatter plot showing the relationship between serum zinc and total bilirubin concentration (Spearman r = -0.363, P < 0.01); B: Scatter plot showing the relationship between serum zinc and international normalized ratio (Spearman r = -0.234, P = 0.037); C: Scatter plot showing the relationship between serum zinc and prothrombin time (Spearman r = -0.255, P = 0.022). INR: International normalized ratio.
- Citation: Manzo MGA, Audu N, Musa Y, Muktar AA, Samaila AA, Borodo MM. Serum zinc levels, hepatic encephalopathy, and liver disease severity in decompensated chronic liver disease patients in Kano, Nigeria. World J Transl Med 2026; 12(3): 124154
- URL: https://www.wjgnet.com/2220-6132/full/v12/i3/124154.htm
- DOI: https://dx.doi.org/10.5528/wjtm.124154