
















Copyright: ©Author(s) 2026.
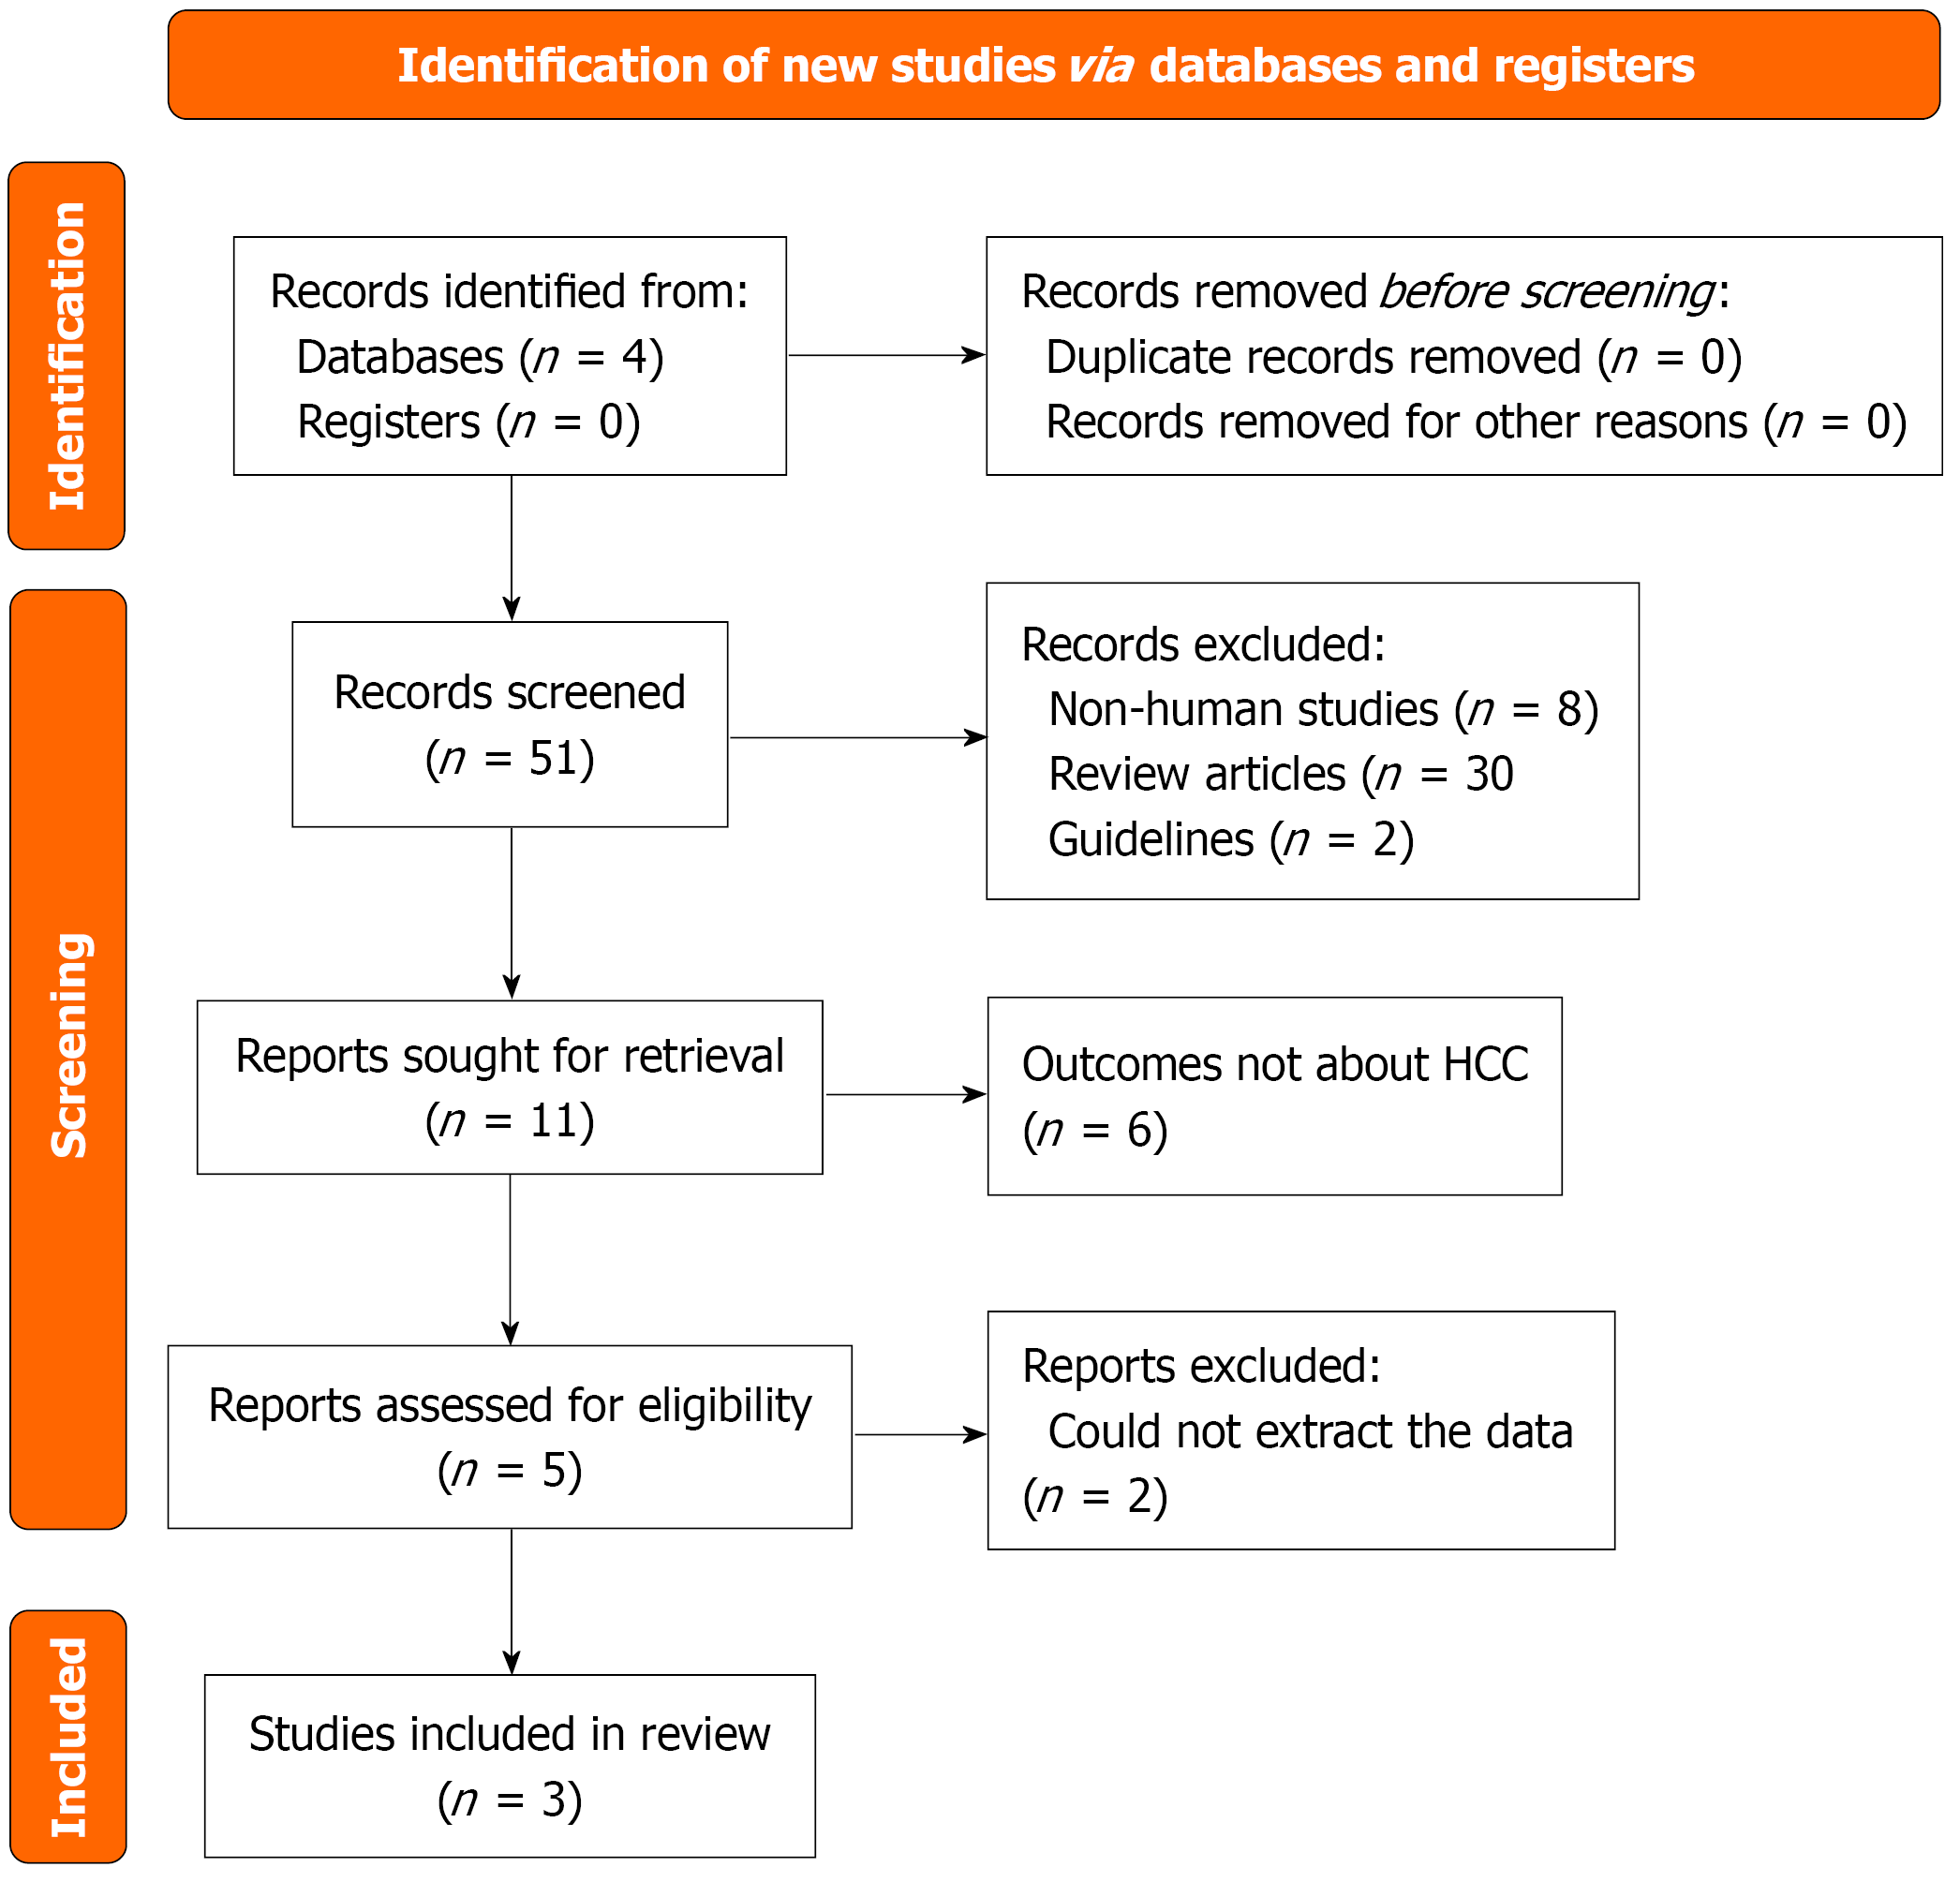
Figure 1 PRISMA flow diagram.
HCC: Hepatocellular carcinoma.
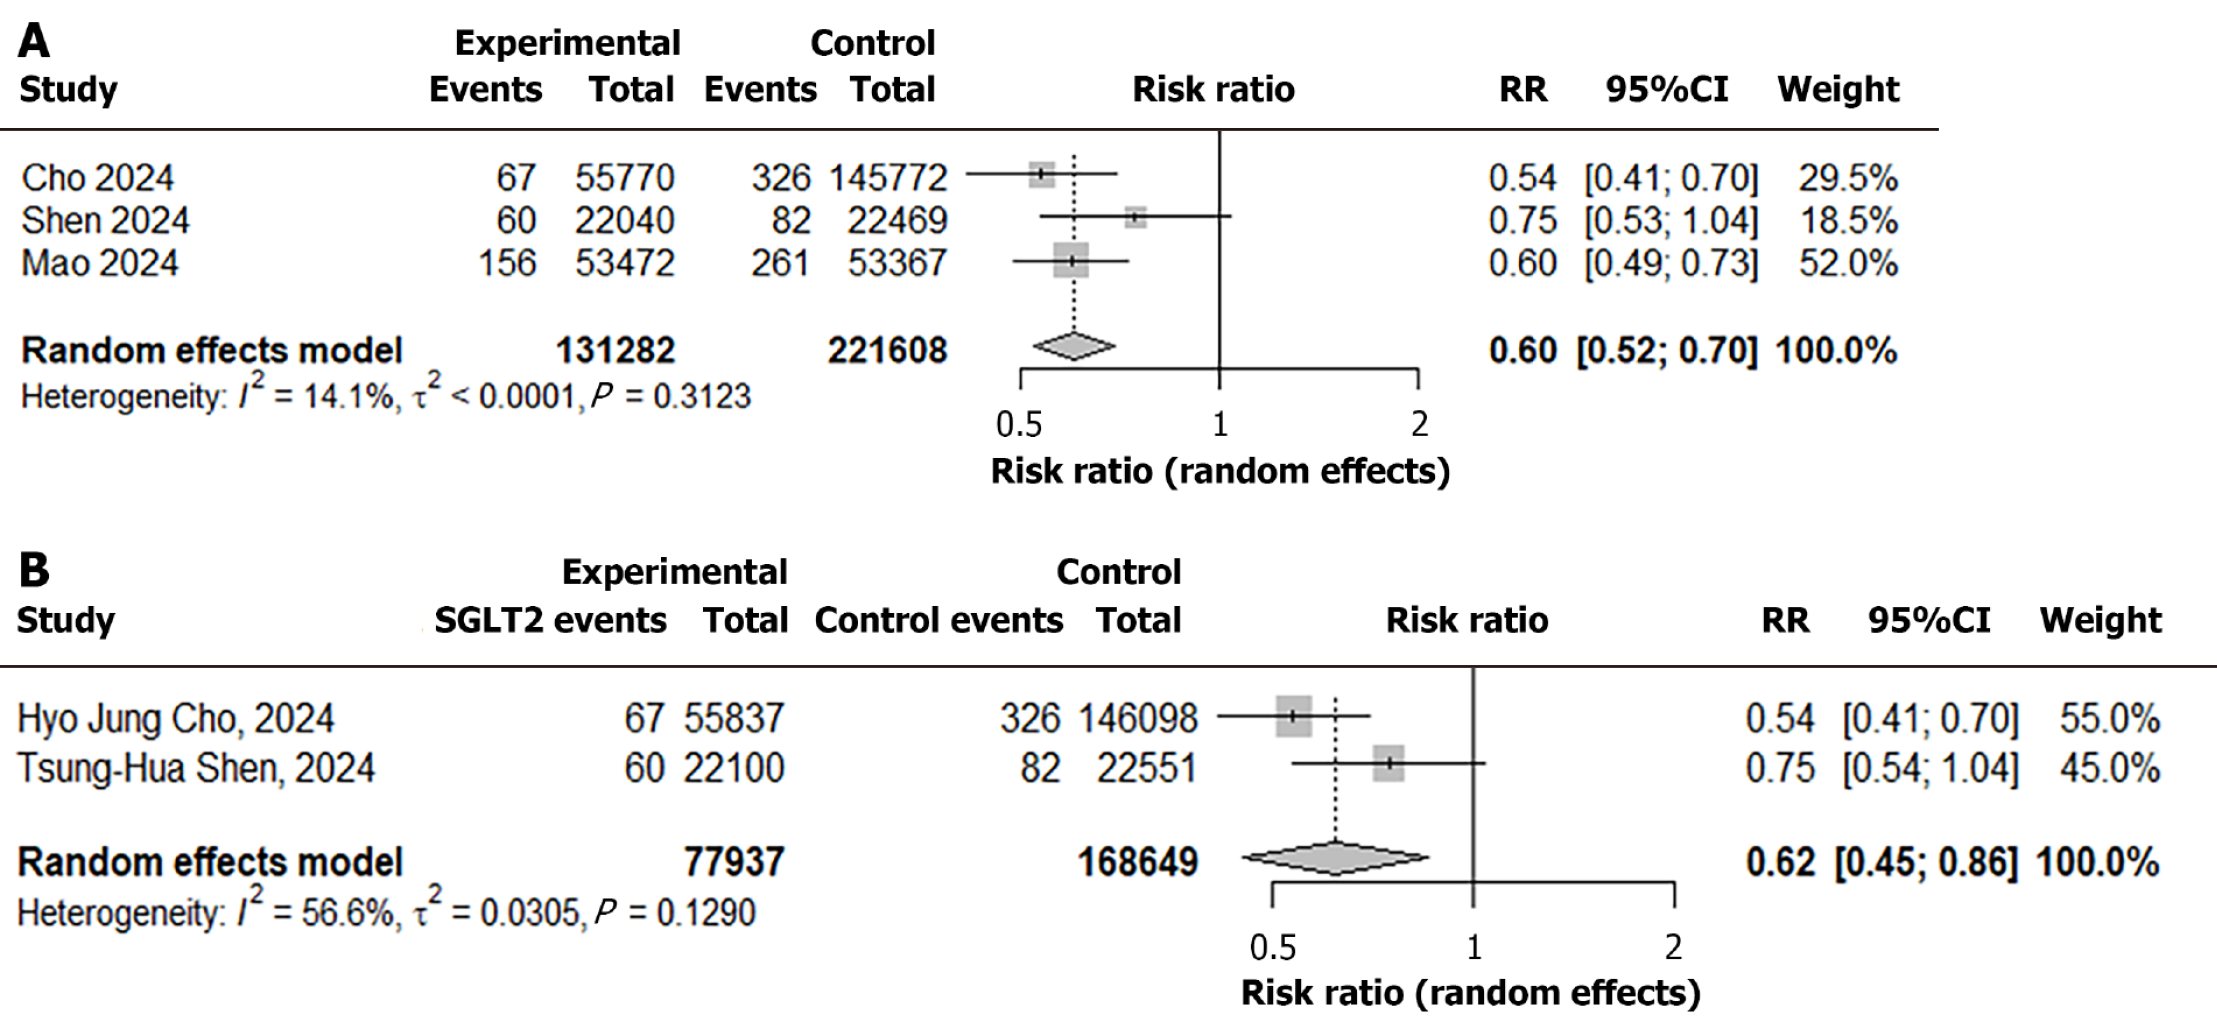
Figure 2 Forest plot.
A: The association between sodium–glucose cotransporter-2 inhibitor use and hepatocellular carcinoma incidence in adults with metabolic dysfunction–associated steatotic liver disease (primary meta-analysis of three cohort studies); B: The sensitivity analysis restricted to studies comparing sodium–glucose cotransporter-2 inhibitors with non–sodium–glucose cotransporter-2 oral hypoglycemic agents. RR: Relative risk; SGLT2: Sodium-glucose cotransporter-2.
- Citation: Mpisa S, Soldera J. From kidney to liver: Are sodium–glucose cotransporter-2 inhibitors emerging as metabolic disease modifiers? World J Nephrol 2026; 15(3): 121652
- URL: https://www.wjgnet.com/2220-6124/full/v15/i3/121652.htm
- DOI: https://dx.doi.org/10.5527/wjn.121652