Copyright
©The Author(s) 2025.
World J Nephrol. Jun 25, 2025; 14(2): 105815
Published online Jun 25, 2025. doi: 10.5527/wjn.v14.i2.105815
Published online Jun 25, 2025. doi: 10.5527/wjn.v14.i2.105815
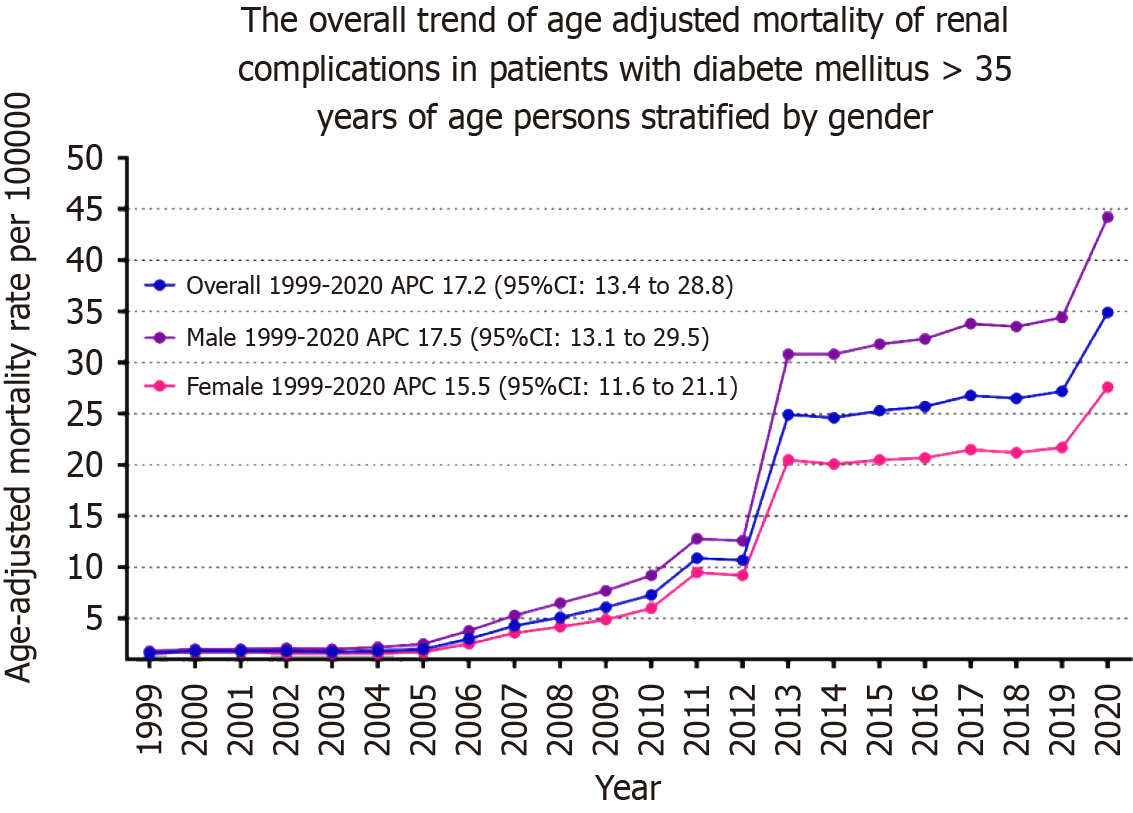
Figure 1 Overall and sex-stratified deaths due to renal complications in diabetic patients: Age-adjusted mortality rates per 100000 in adults in the United States, 1999–2020.
APC: Annual percent change.
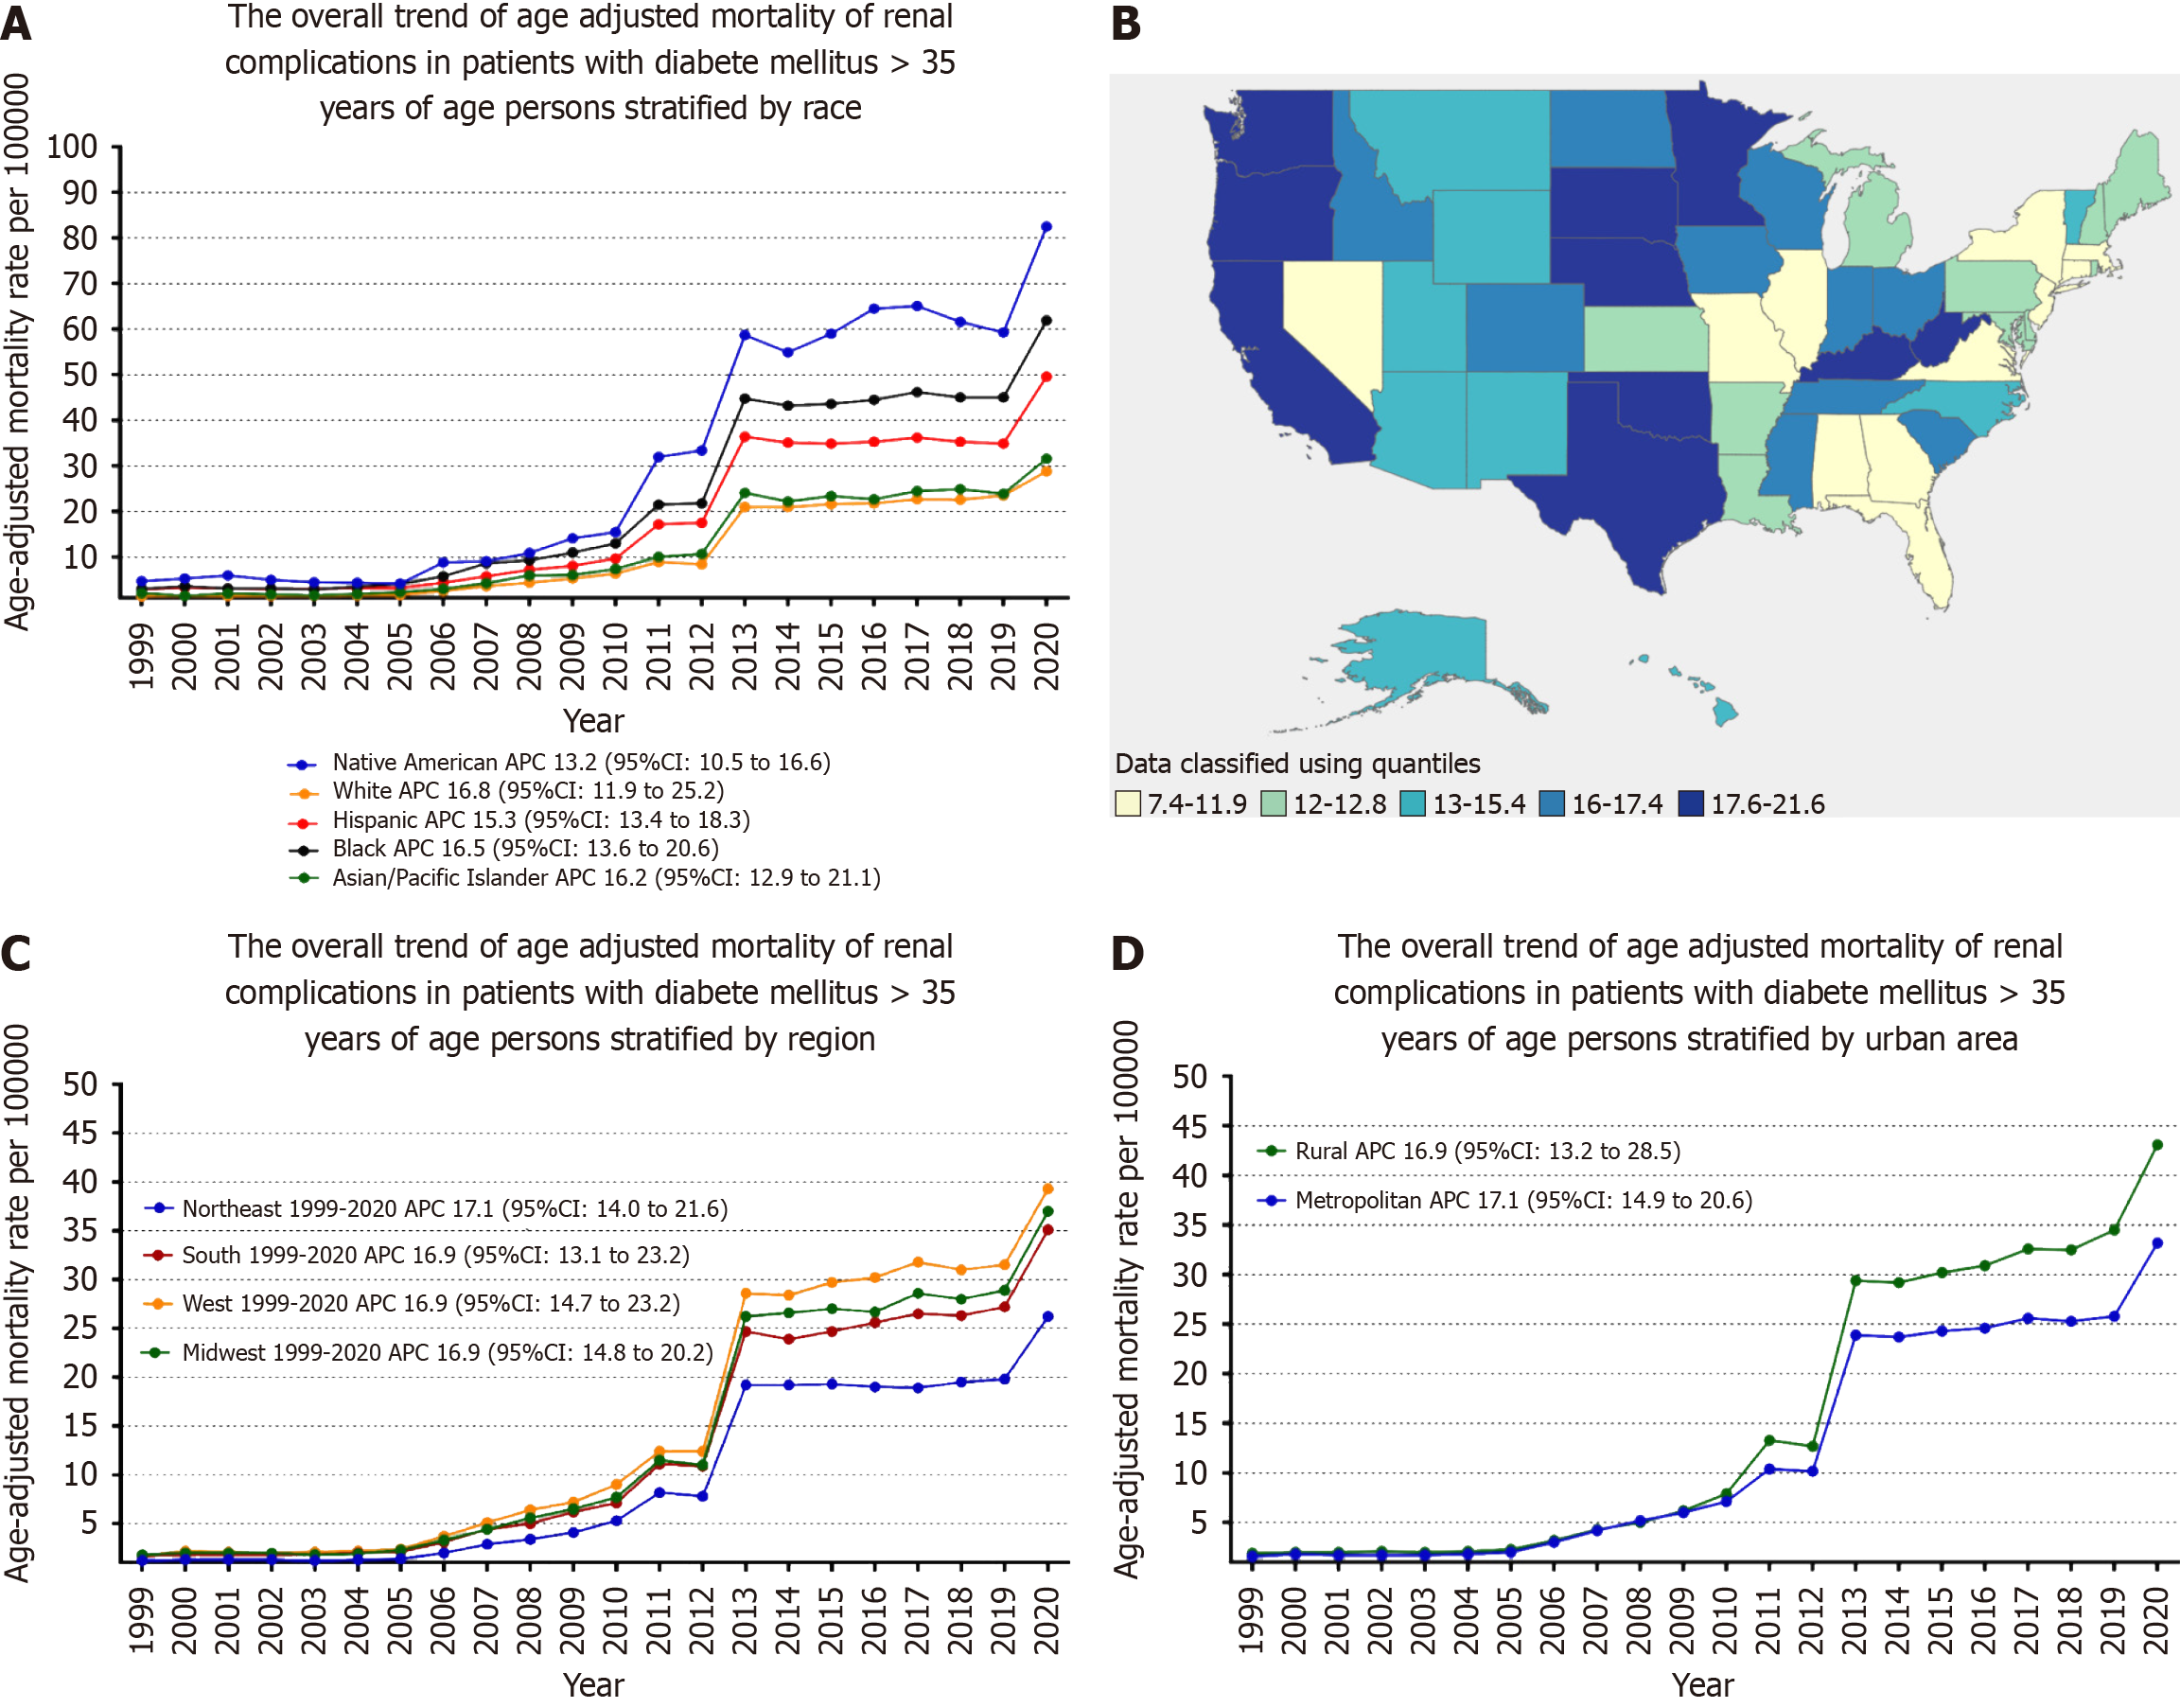
Figure 2 Age-adjusted mortality rates per 100000 related to renal complications in diabetic patients in the United States, 1999 to 2020.
A: Stratified by race; B: Stratified by states; C: Stratified by census region; D: Stratified by urbanization. APC: Annual percent change.
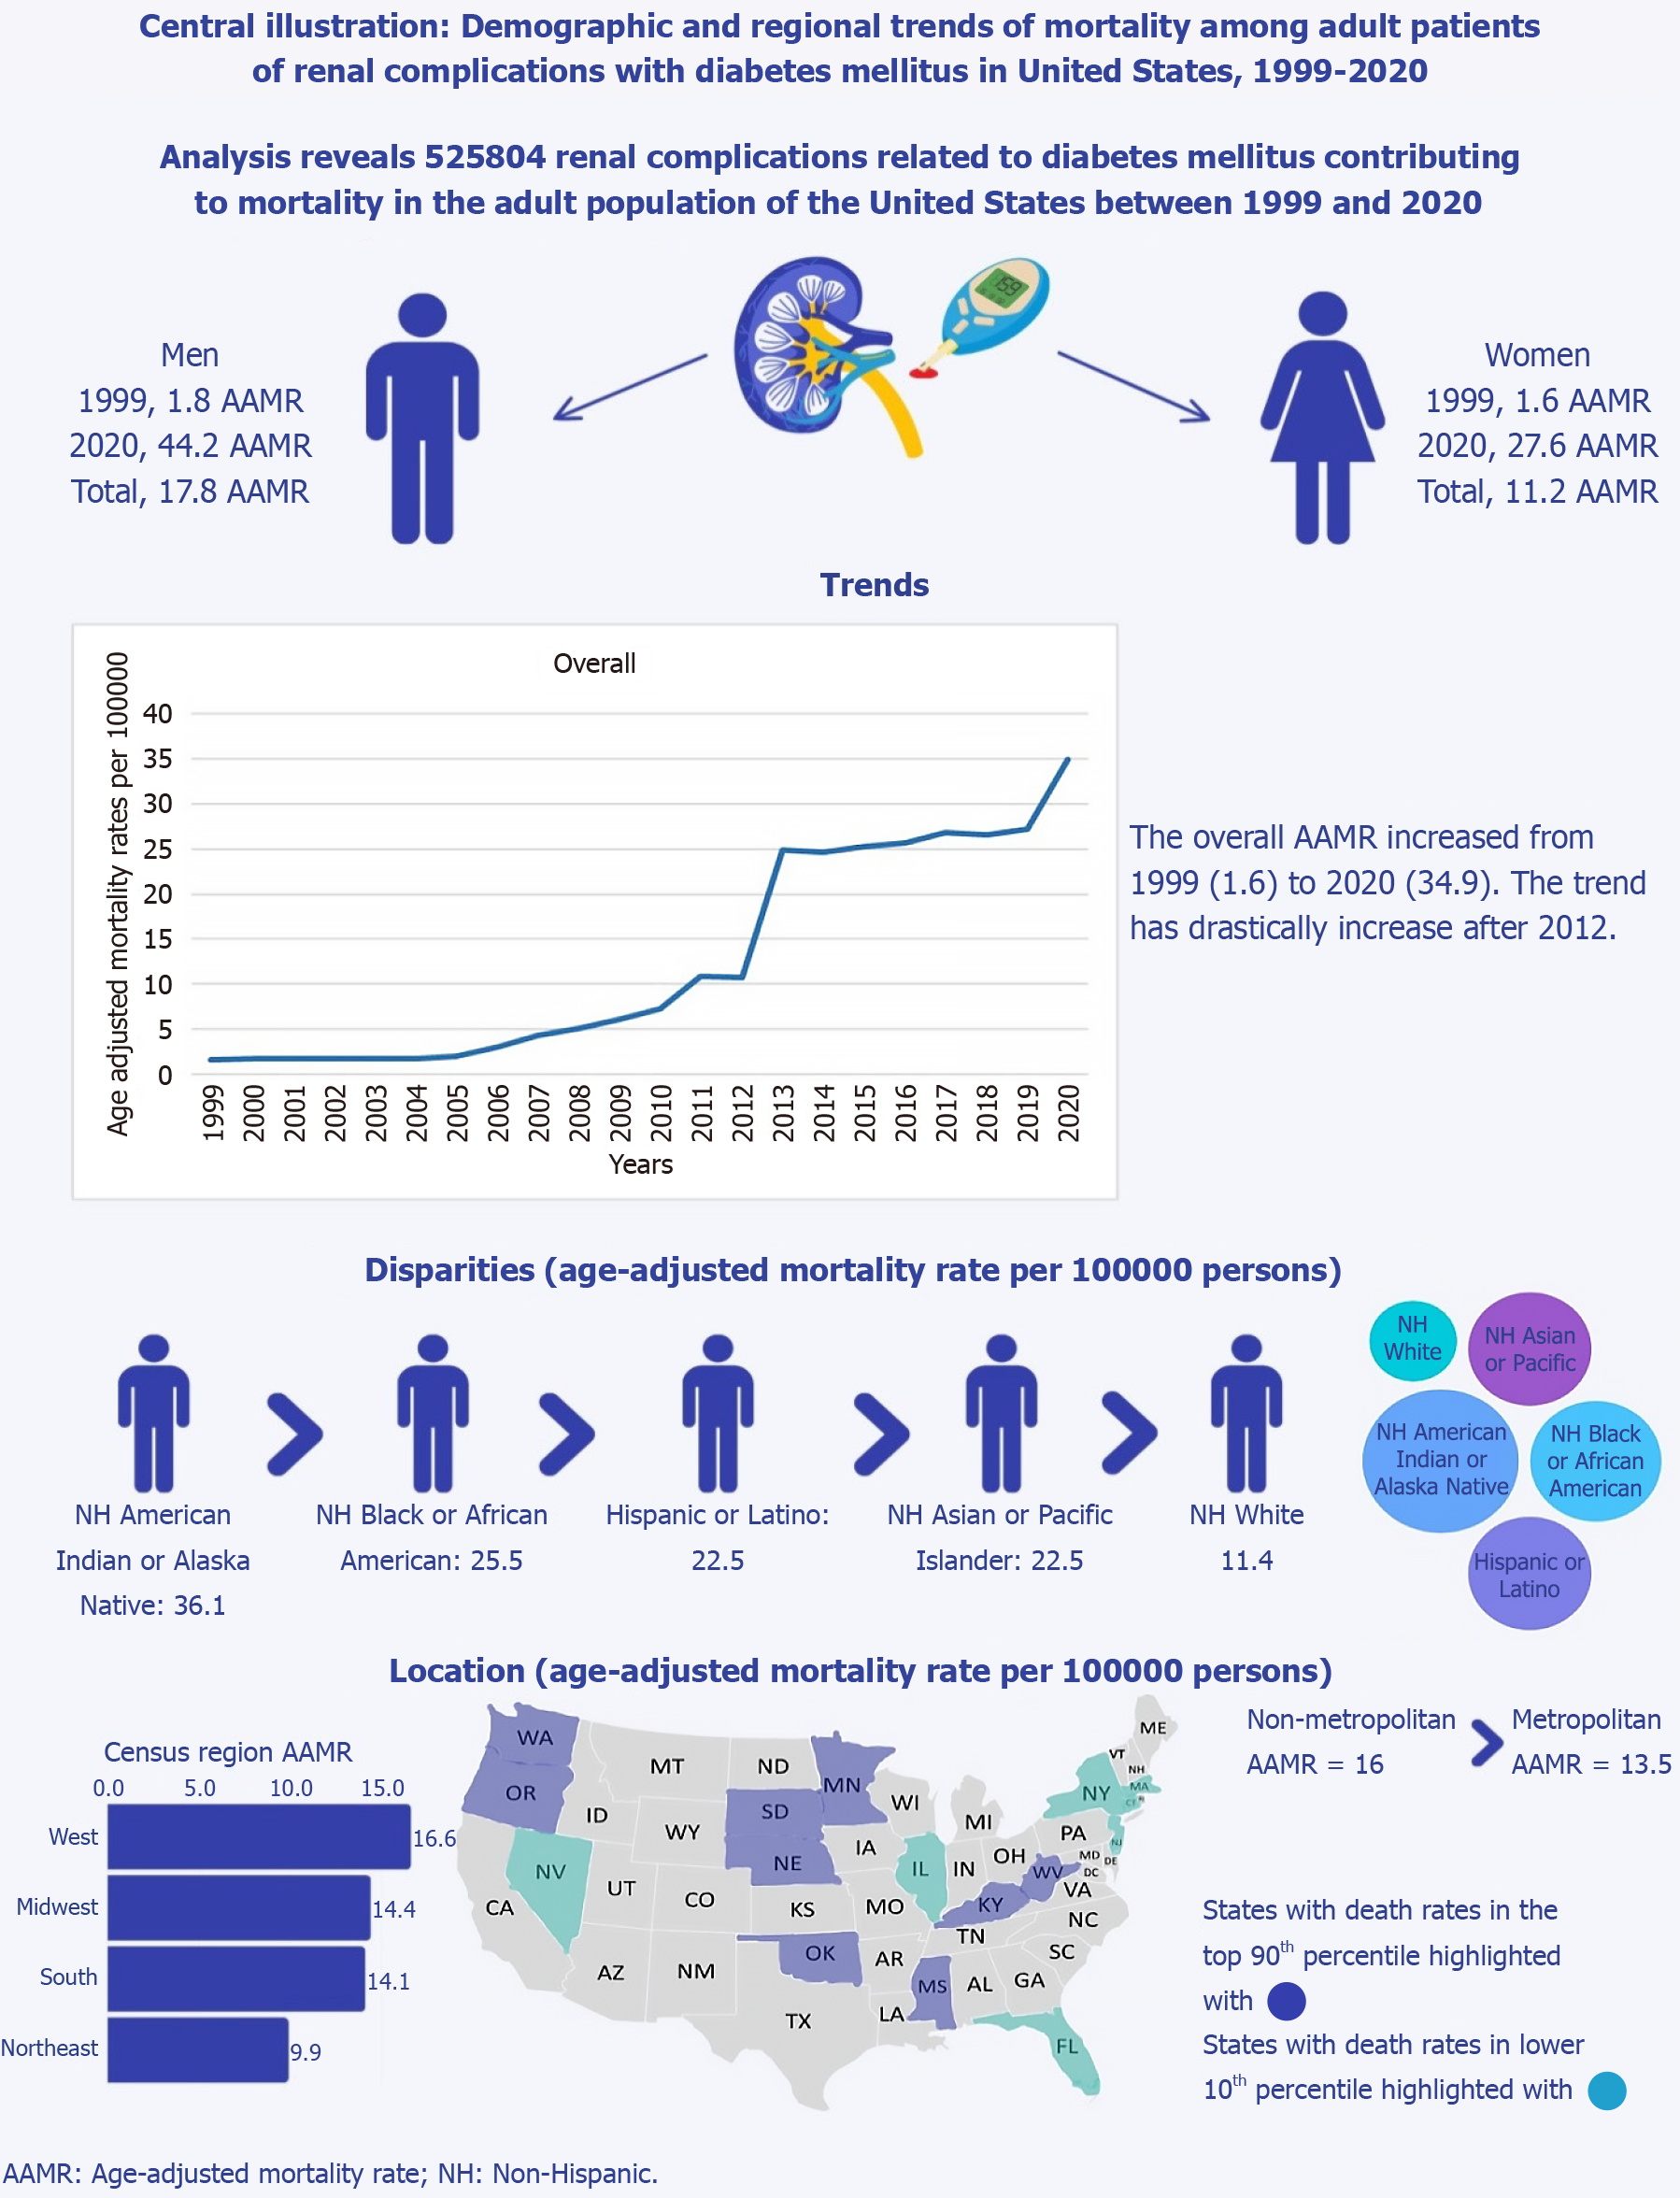
Figure 3 Central illustration: Trends in demographics and disparities in renal complications among adult diabetic patients in the United States: 1999 to 2020.
AAMR: Age-adjusted mortality rate.
- Citation: Muhammad AN, Ahmed F, Eltawansy S, Ali A, Azeem B, Kashan M, Afzaal Z, Ahmed M, Aman K, Amanullah A, Naveed Uz Zafar M, Lajczak P, Obi O. Epidemiological trends in diabetic renal complications in United States adults: A center for disease control and prevention wide-ranging online data for epidemiologic research analysis (1999-2020). World J Nephrol 2025; 14(2): 105815
- URL: https://www.wjgnet.com/2220-6124/full/v14/i2/105815.htm
- DOI: https://dx.doi.org/10.5527/wjn.v14.i2.105815


