Copyright
©The Author(s) 2025.
World J Nephrol. Jun 25, 2025; 14(2): 105374
Published online Jun 25, 2025. doi: 10.5527/wjn.v14.i2.105374
Published online Jun 25, 2025. doi: 10.5527/wjn.v14.i2.105374
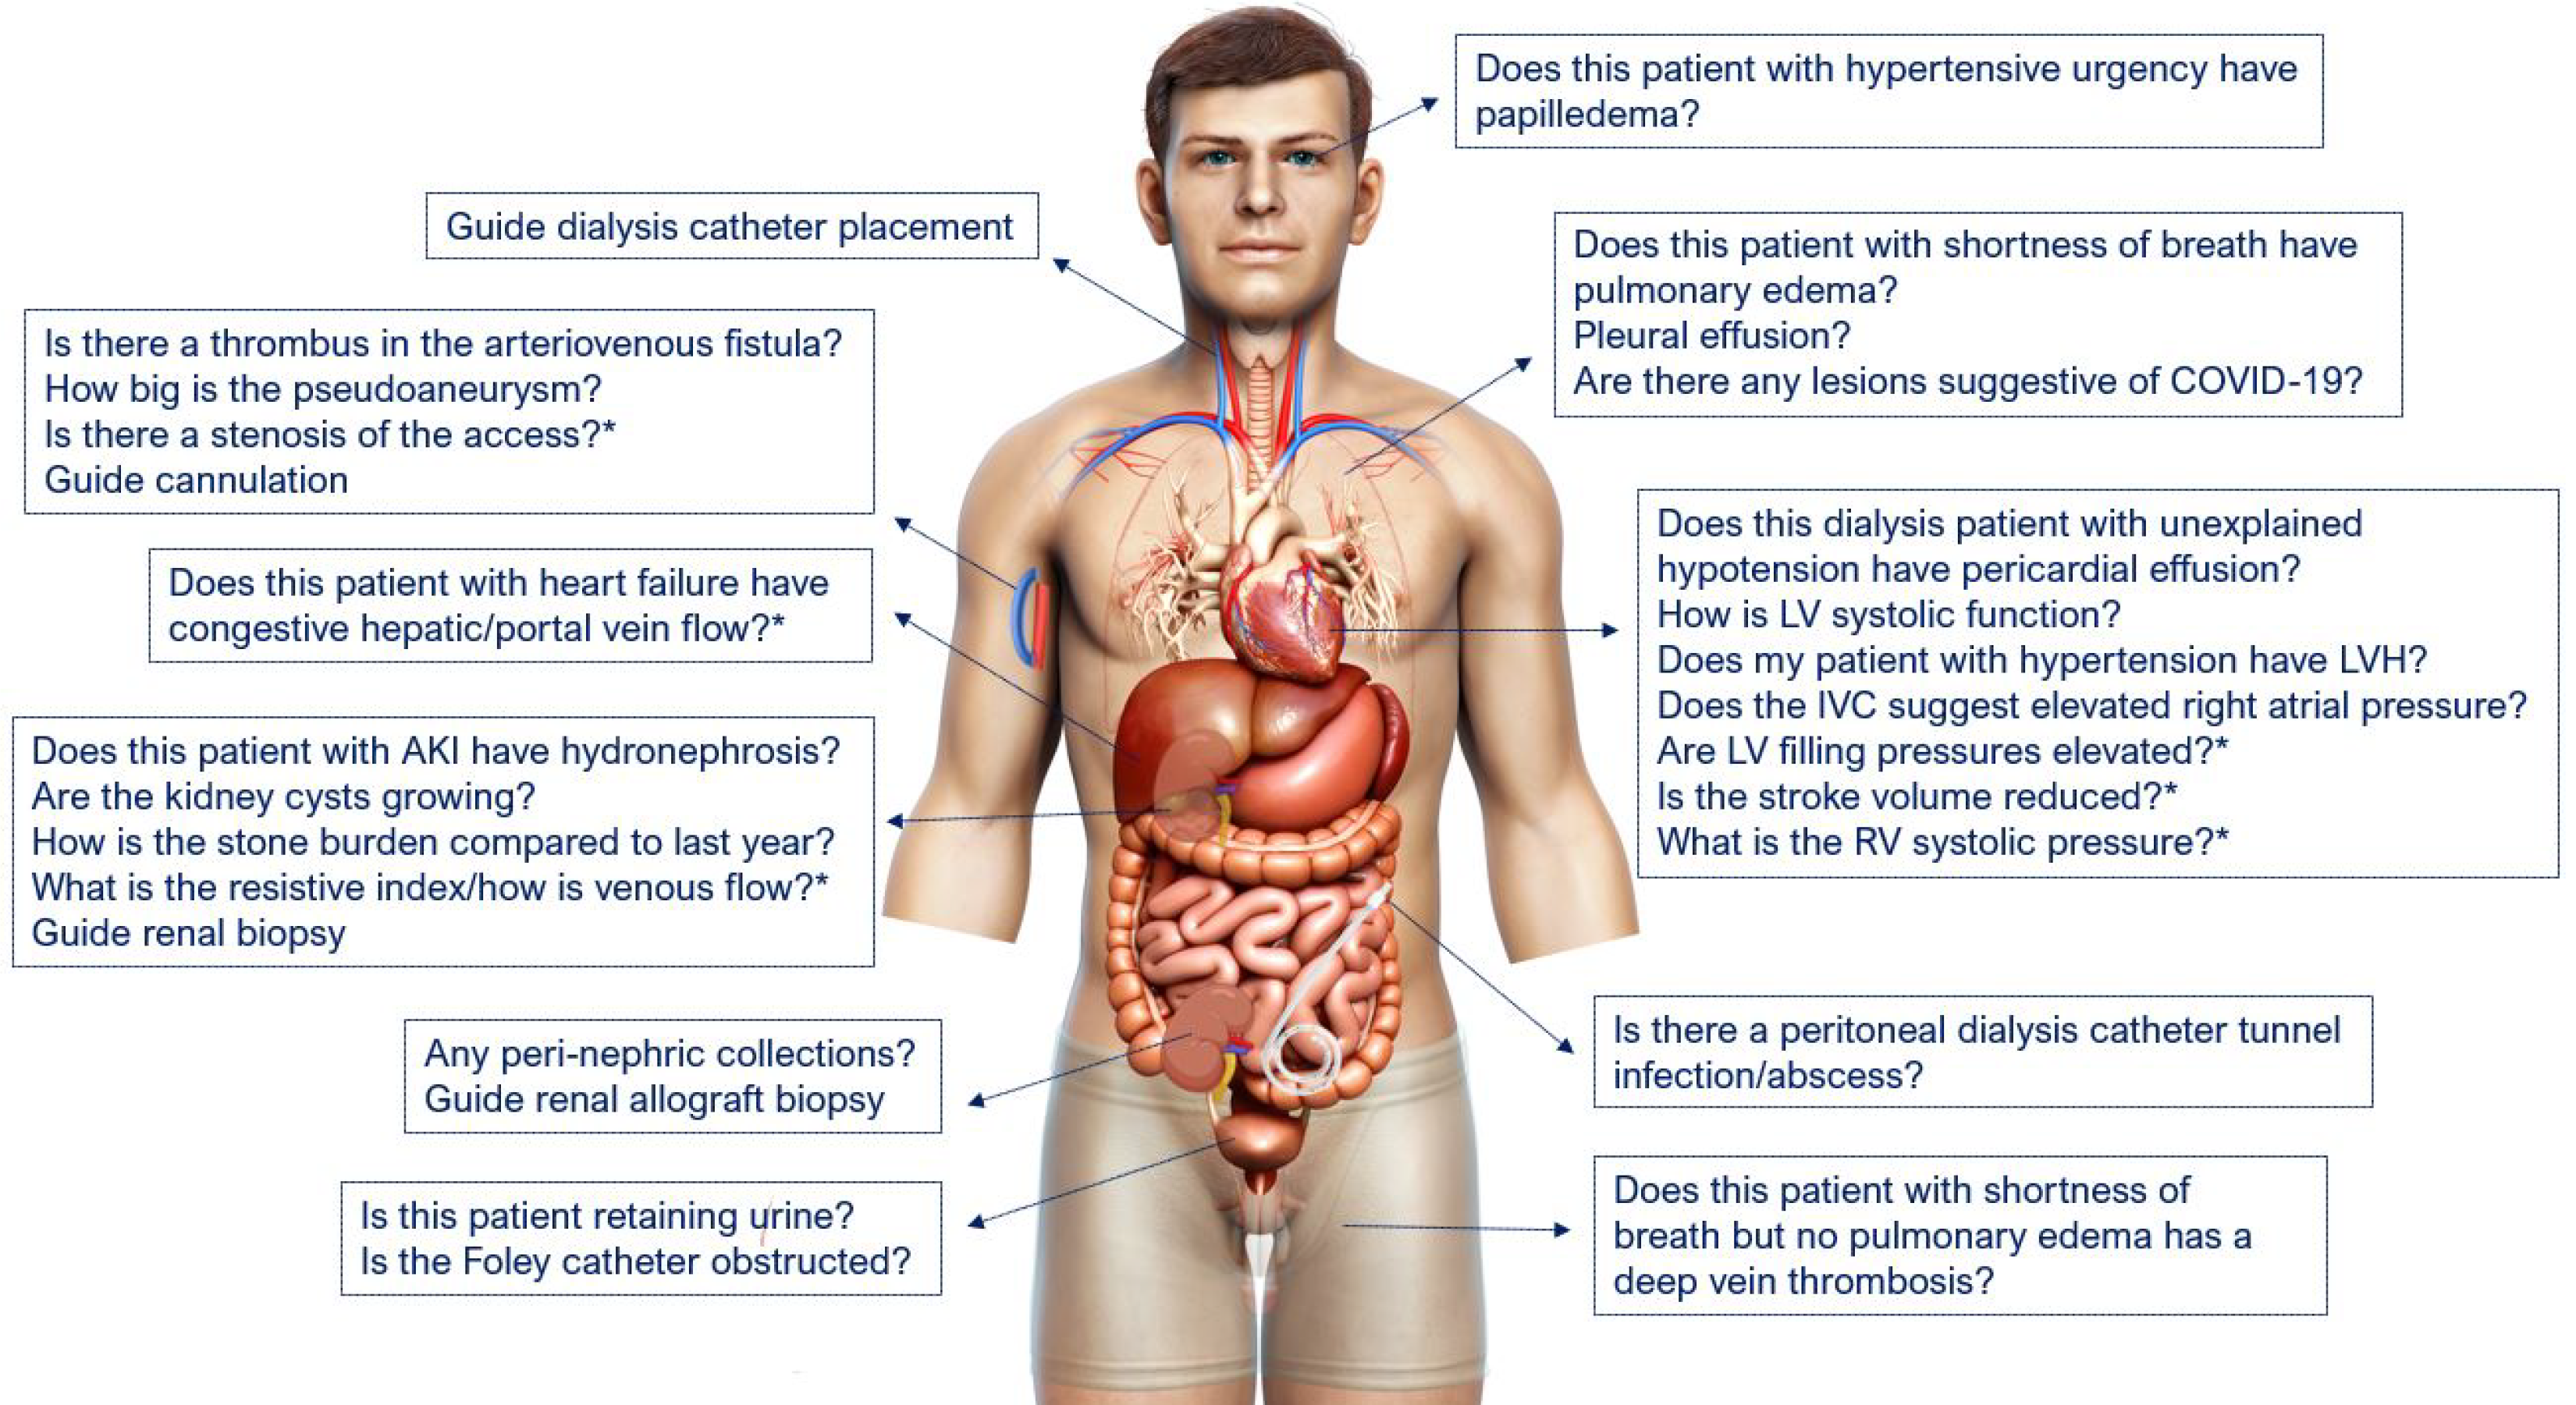
Figure 1 Point-of-care ultrasonography use-cases in nephrology.
Some examples of nephrology-related clinical questions that can be answered using point-of-care ultrasonography. The asterisk indicates advanced sonographic applications requiring a higher operator skill level/additional training. Reproduced from Koratala et al[58]. COVID-19: Coronavirus disease 2019; LV: Left ventricle; LVH: Left ventricular hypertrophy; IVC: Inferior vena cava; RV: Right ventricle; AKI: Acute kidney injury. Citation: Koratala A, Reisinger N. POCUS for Nephrologists: Basic Principles and a General Approach. Kidney360 2021; 2: 1660-1668. Copyright © 2021 by the American Society of Nephrology. Published by Wolters Kluwer Health, Inc. The authors have obtained the permission for figure using (Supplementary material).
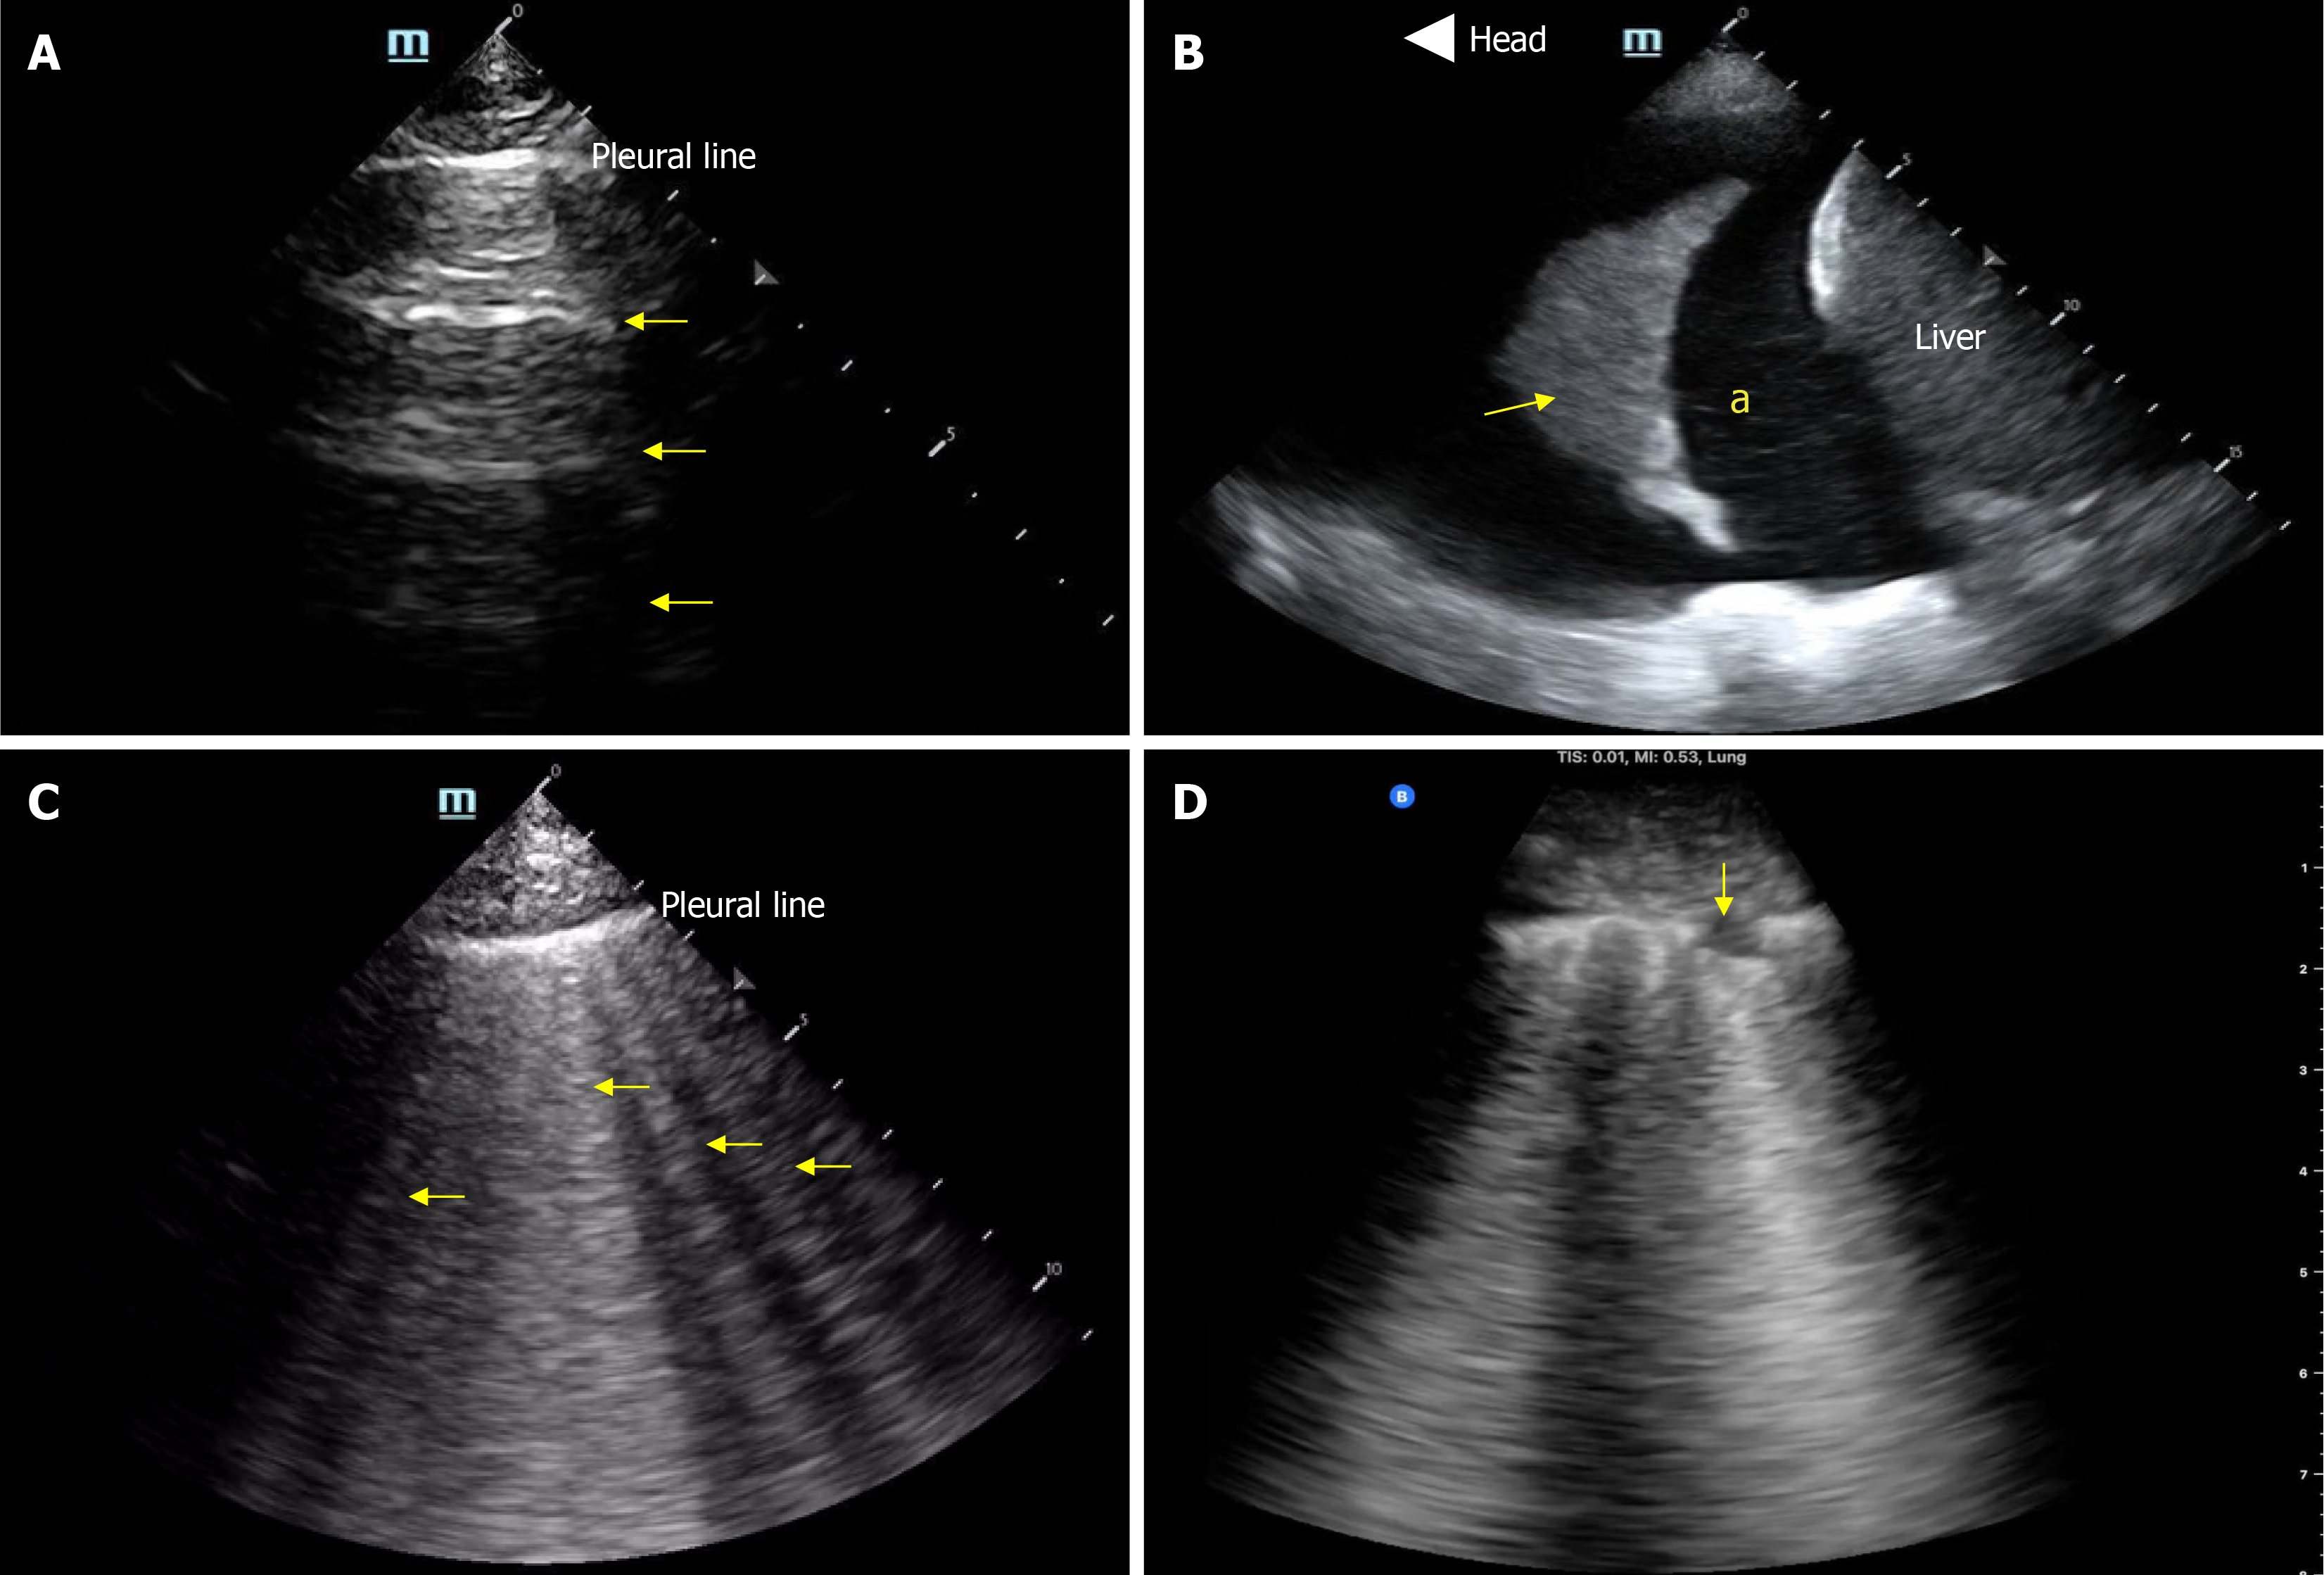
Figure 2 Basic lung ultrasound findings.
A: Normal lung ultrasound demonstrating A-lines (horizontal hyperechoic artifacts); B: Pleural effusion (“a”) appearing as an anechoic area above the liver. Arrow points to atelectatic lung; C: B-lines-vertical hyperechoic artifacts emerging from the pleural line indicative of interstitial thickening (typically from fluid); D: Interstitial pneumonia with confluent B-lines and an irregular pleural line. Arrow points to subpleural consolidation.
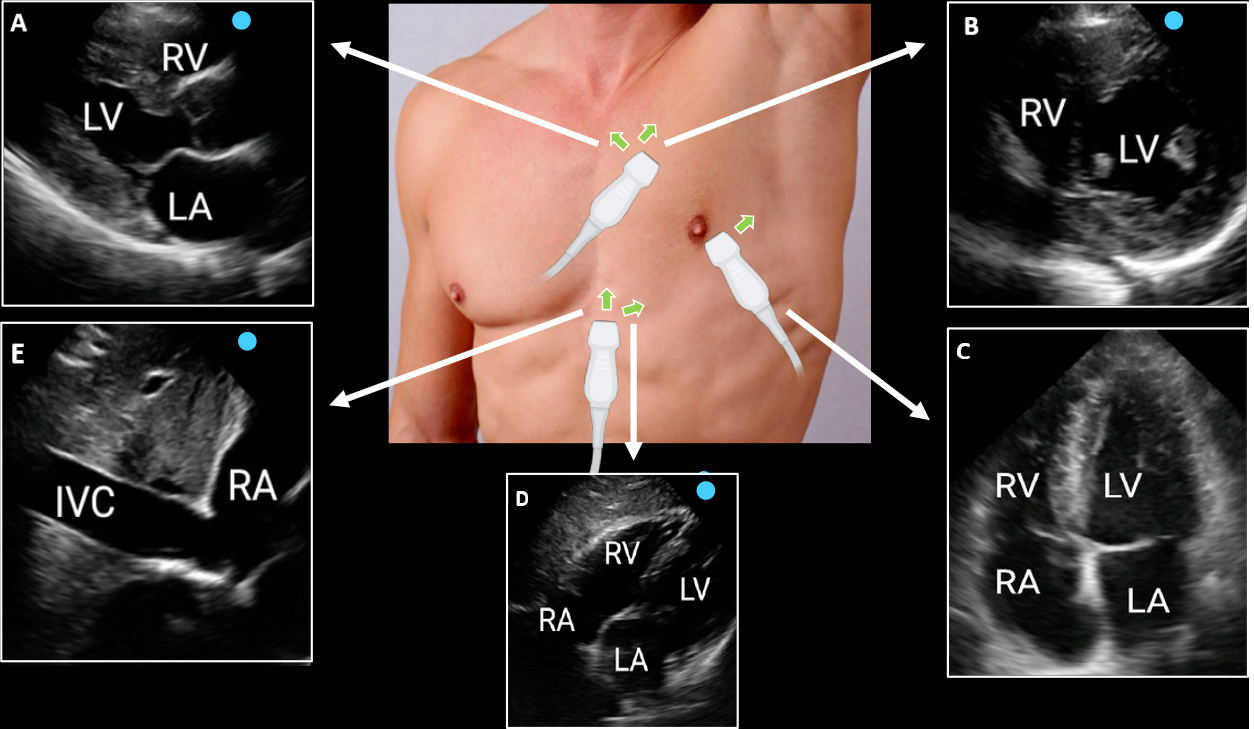
Figure 3 Focused cardiac ultrasound views.
A: Parasternal long axis; B: parasternal short axis; C: Apical four-chamber; D: Subxiphoid; E: Inferior vena cava. Green arrows indicate the direction of the transducer orientation marker. Reproduced from Argaiz et al[59]. IVC: Inferior vena cava; LA: Left atrium; LV: Left ventricle; RA: Right atrium; RV: Right ventricle. Citation: Argaiz ER, Koratala A, Reisinger N. Comprehensive Assessment of Fluid Status by Point-of-Care Ultrasonography. Kidney360 2021; 2: 1326-1338. Copyright © 2021 by the American Society of Nephrology. Published by Wolters Kluwer Health, Inc. The authors have obtained the permission for figure using (Supplementary material).
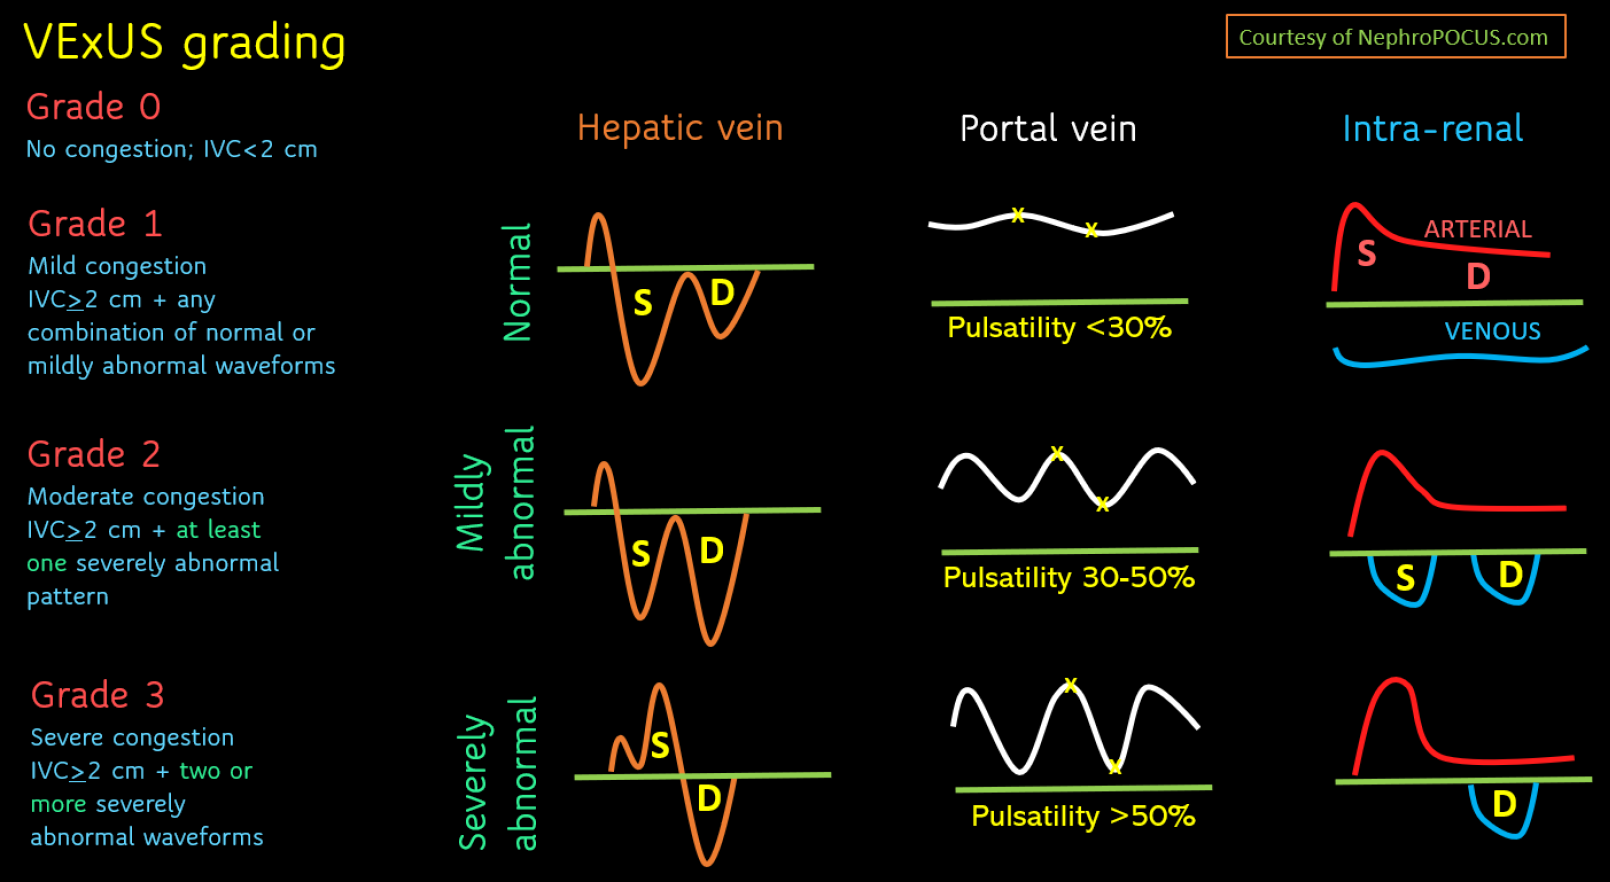
Figure 4 Venous excess ultrasound grading score.
When inferior vena cava has a diameter > 2 cm, hepatic, portal, and rein vein waveforms should be checked. The abnormalities present in these venous Doppler waveforms correlate with the severity of congestion. Hepatic vein Doppler is considered mildly abnormal when the S wave is smaller than the D wave, but still below the baseline; it is considered severely abnormal when the S wave is reversed. Portal vein Doppler is considered mildly abnormal when the pulsatility is 30%-50%, and severely abnormal when it is ≥ 50%. Intrarenal vein Doppler is mildly abnormal when it is pulsatile with distinct S and D components, and severely abnormal when it is monophasic with a D-only pattern. This figure was adapted from NephroPOCUS.com with permission. The corresponding author Koratala A is the owner of the website and copyright holder[60]. See: https://nephropocus.com/about/.
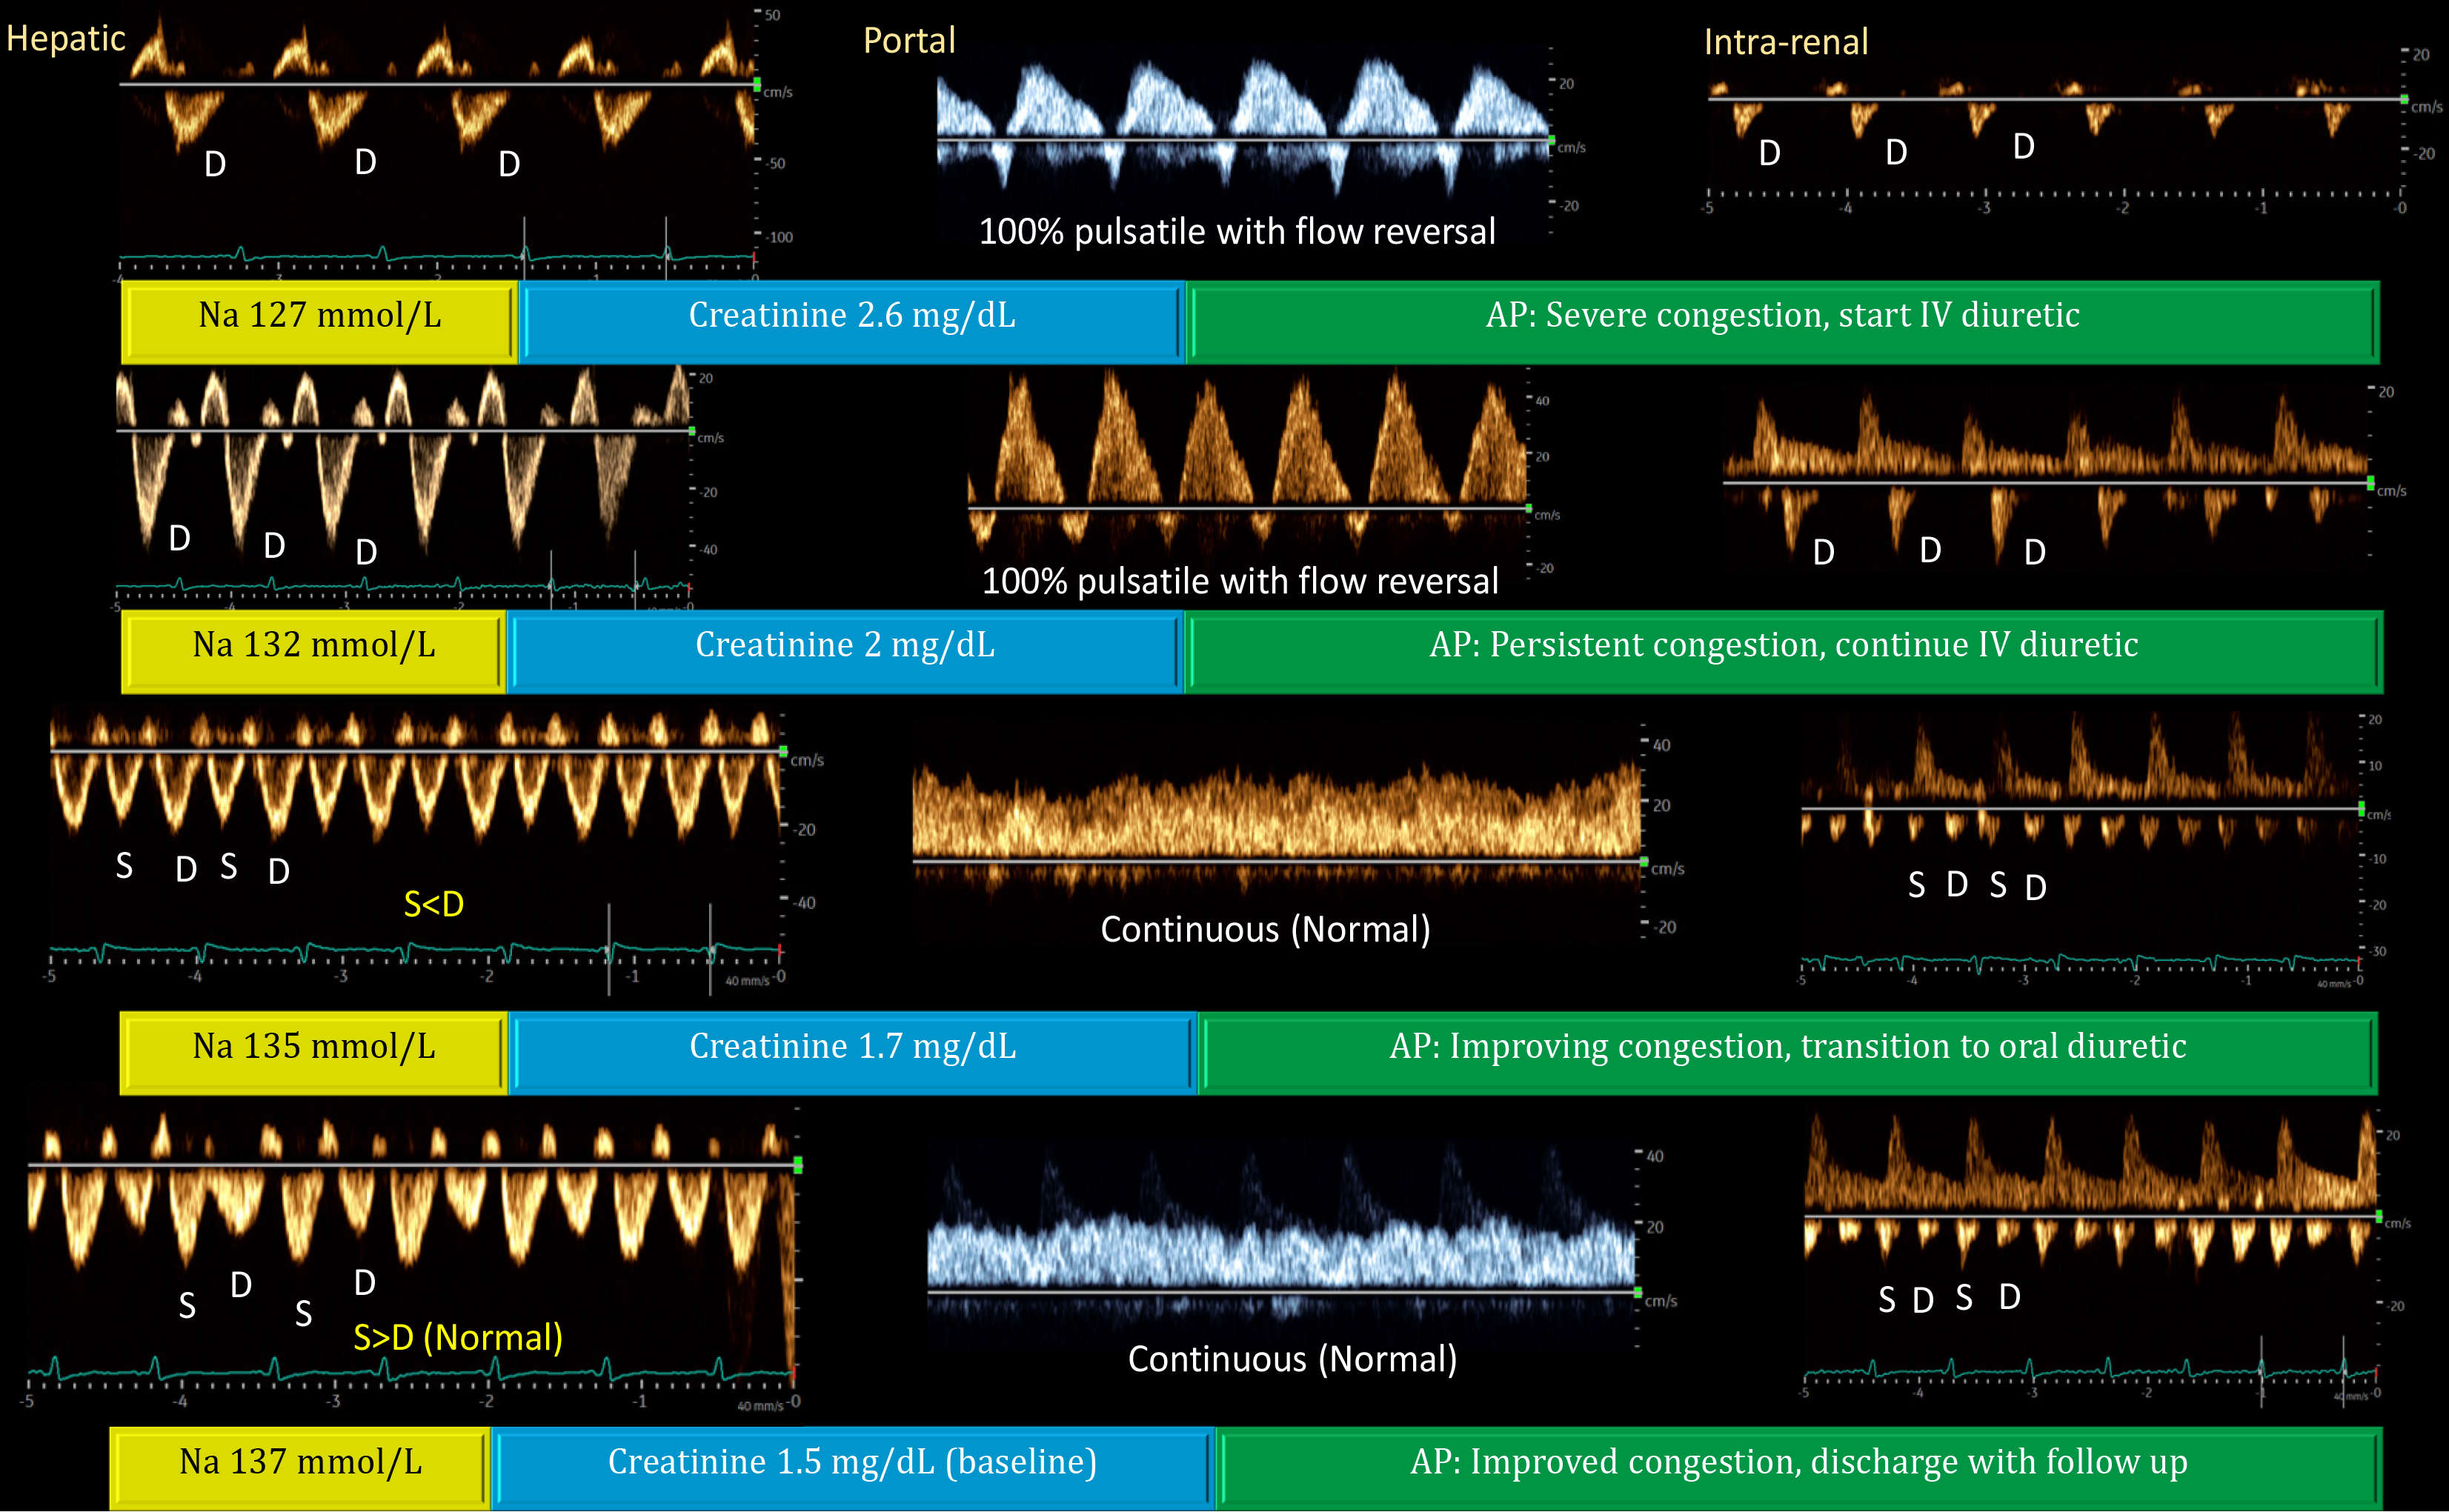
Figure 5 Doppler venous waveforms showing improvement (from top to bottom) in a patient with acute kidney injury and hyponatremia.
In a physiological state, the hepatic vein Doppler resembles the central venous waveform, with a larger S-wave compared to the D-wave. As right atrial pressure (RAP) increases, the S-wave amplitude decreases and eventually reverses, leaving only the D-wave below the baseline. Normally, the portal vein flow is continuous (less than 30% pulsatility), but pulsatility increases with rising RAP, eventually leading to late-systolic flow reversal (below-baseline flow). Increased portal vein pulsatility may indicate gut congestion, potentially affecting diuretic absorption. The renal parenchymal vein, typically continuous (like the portal vein but below the baseline), becomes more pulsatile with increasing RAP, eventually showing distinct S- and D-waves with S-reversal similar to the hepatic vein. Generally, improvements in the portal vein precede those in the hepatic and renal veins, as shown above. Renal interstitial edema may delay recovery of the venous waveform. Reproduced from Koratala et al[61]. AP: Assessment and plan; S-wave: Systolic wave; D-wave: Diastolic wave. Citation: Koratala A, Ronco C, Kazory A. Multi-Organ Point-Of-Care Ultrasound in Acute Kidney Injury. Blood Purif 2022; 51: 967-971. Copyright © 2022 S. Karger AG. Published by Karger Publishers. The authors have obtained the permission for figure using (Supplementary material).
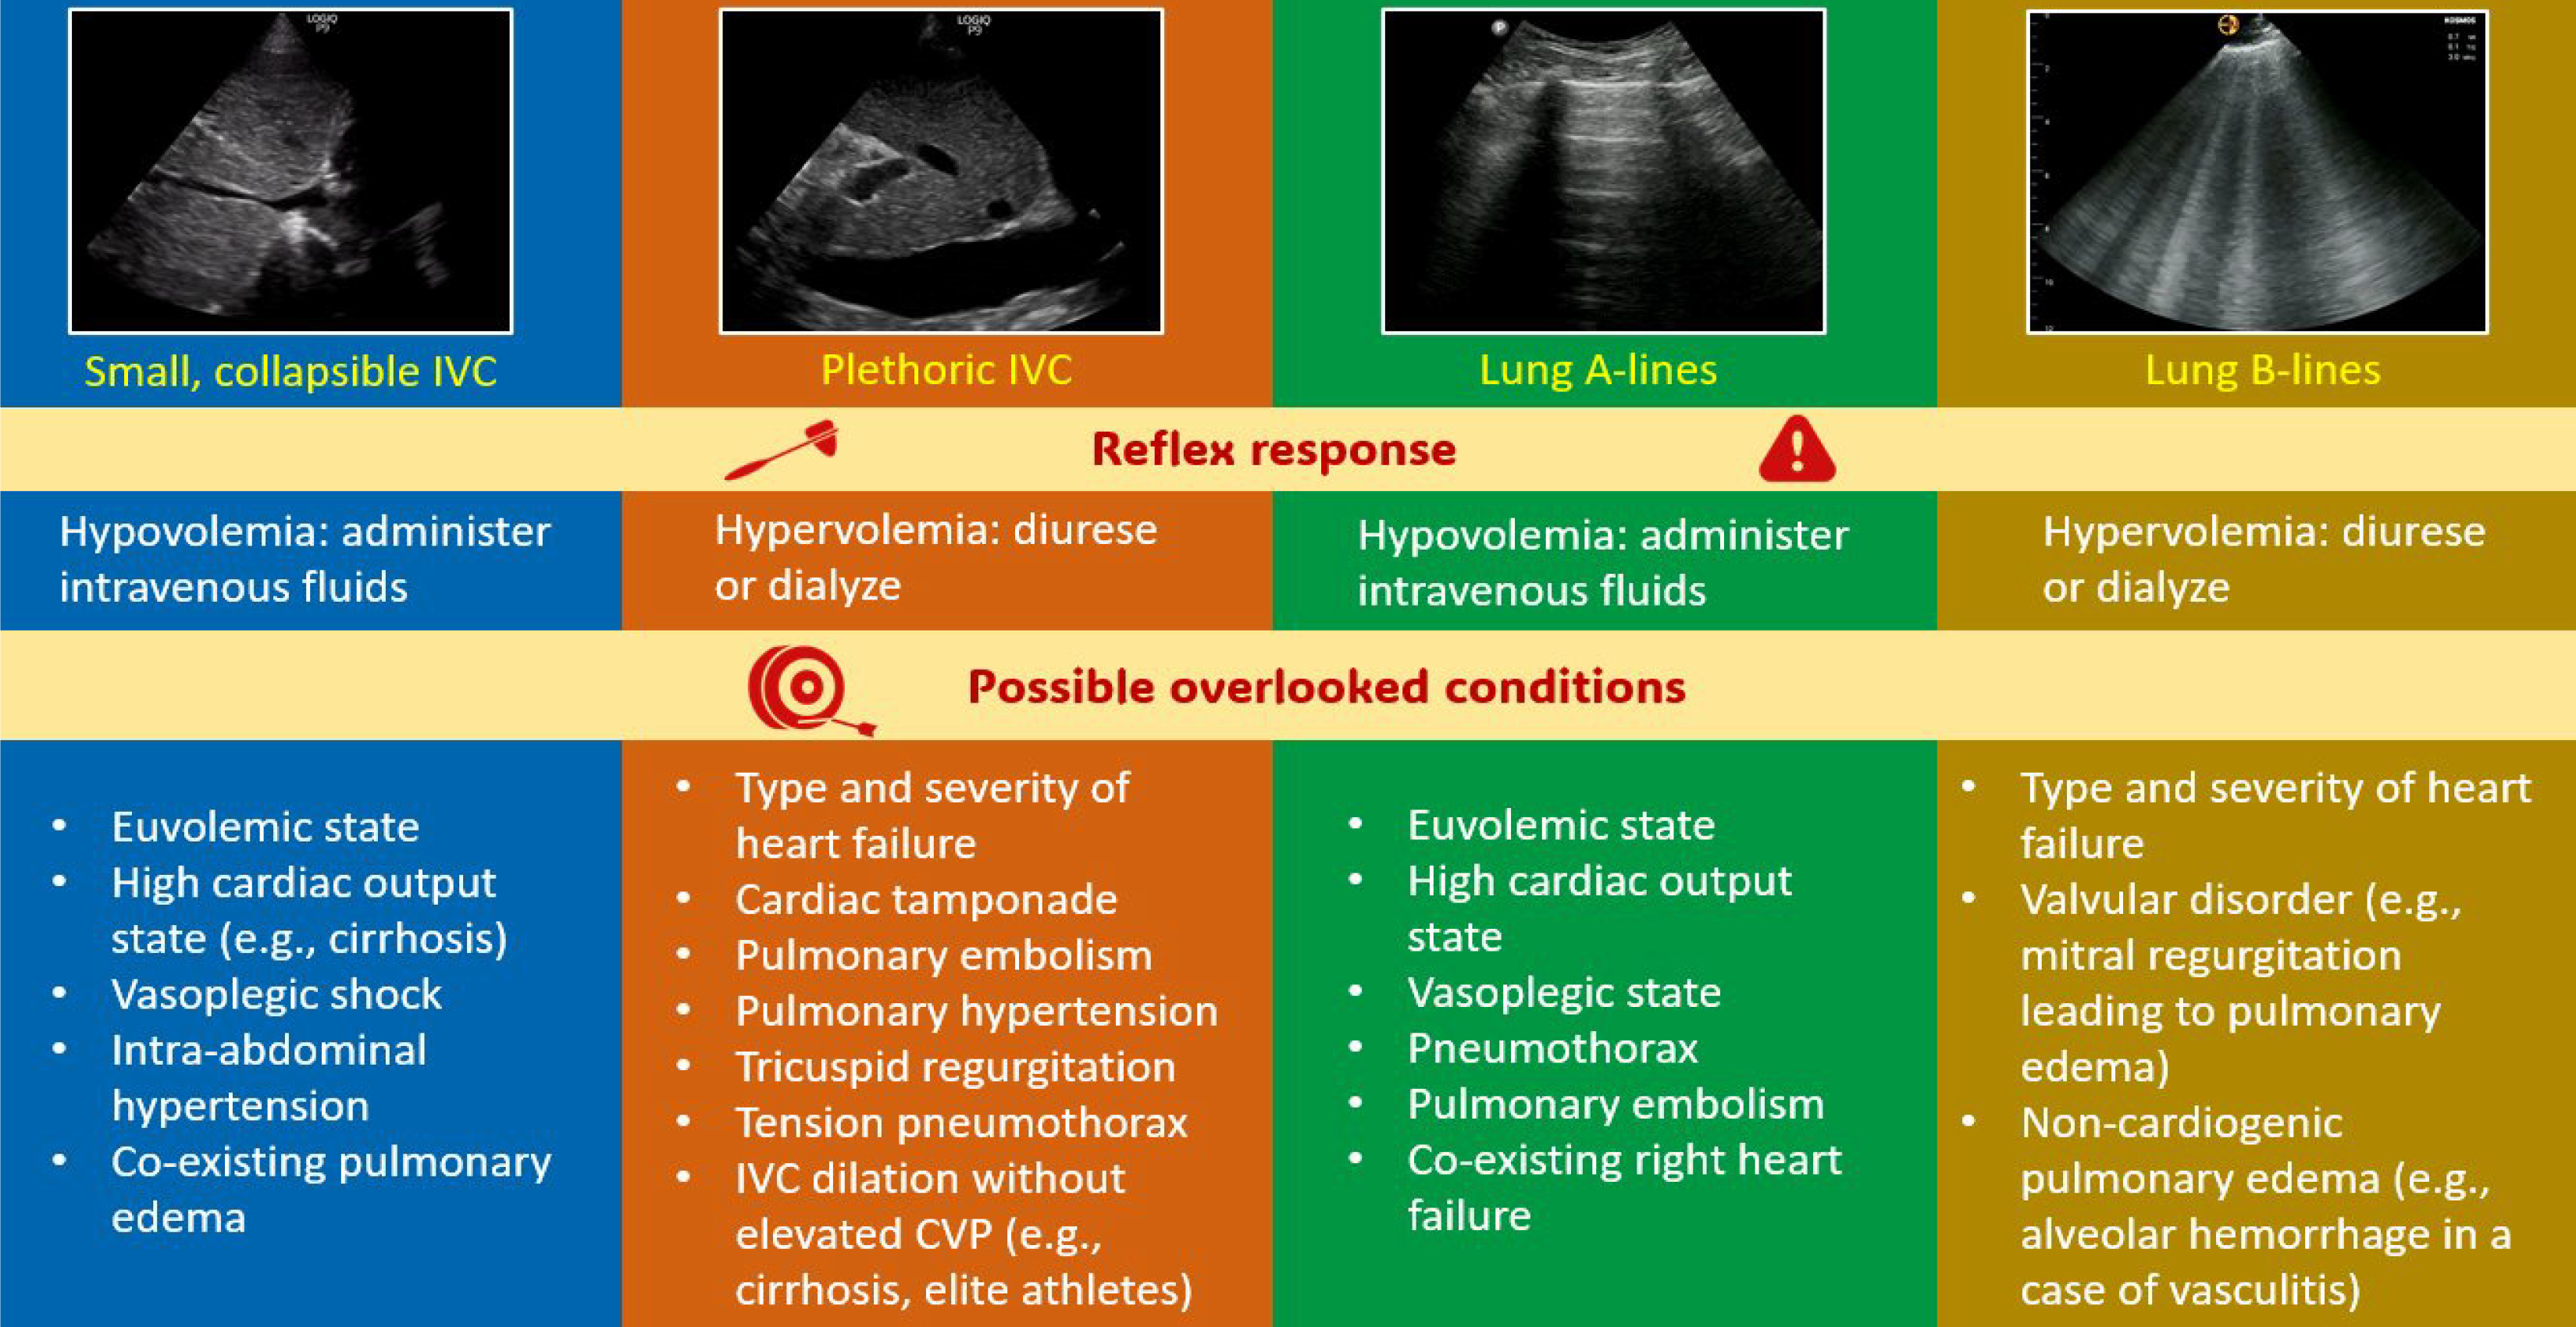
Figure 6 Pitfalls of excessive reliance on individual organ ultrasound and knee-jerk clinical decision-making.
Comprehensive bedside hemodynamic evaluation should almost always involve focused cardiac ultrasound, interpreting all these observations in the relevant clinical context. This applies to both initial diagnosis and monitoring selected parameters during follow-up examinations. *In intra-abdominal hypertension, inferior vena cava is small irrespective of central venous pressure and typically does not exhibit respiratory variation. Reproduced from Kazory et al[62]. IVC: Inferior vena cava; CVP: Central venous pressure. Citation: Kazory A, Olaoye OA, Koratala A. Nuances of Point-of-Care Ultrasound in Nephrology: A Clarion Call for Deeper Understanding. Blood Purif 2024; 53: 598-602. Copyright © 2024 S. Karger AG. Published by Karger Publishers. The authors have obtained the permission for figure using (Supplementary material).
- Citation: Diniz H, Ferreira F, Koratala A. Point-of-care ultrasonography in nephrology: Growing applications, misconceptions and future outlook. World J Nephrol 2025; 14(2): 105374
- URL: https://www.wjgnet.com/2220-6124/full/v14/i2/105374.htm
- DOI: https://dx.doi.org/10.5527/wjn.v14.i2.105374


