©The Author(s) 2025.
World J Nephrol. Mar 25, 2025; 14(1): 101078
Published online Mar 25, 2025. doi: 10.5527/wjn.v14.i1.101078
Published online Mar 25, 2025. doi: 10.5527/wjn.v14.i1.101078
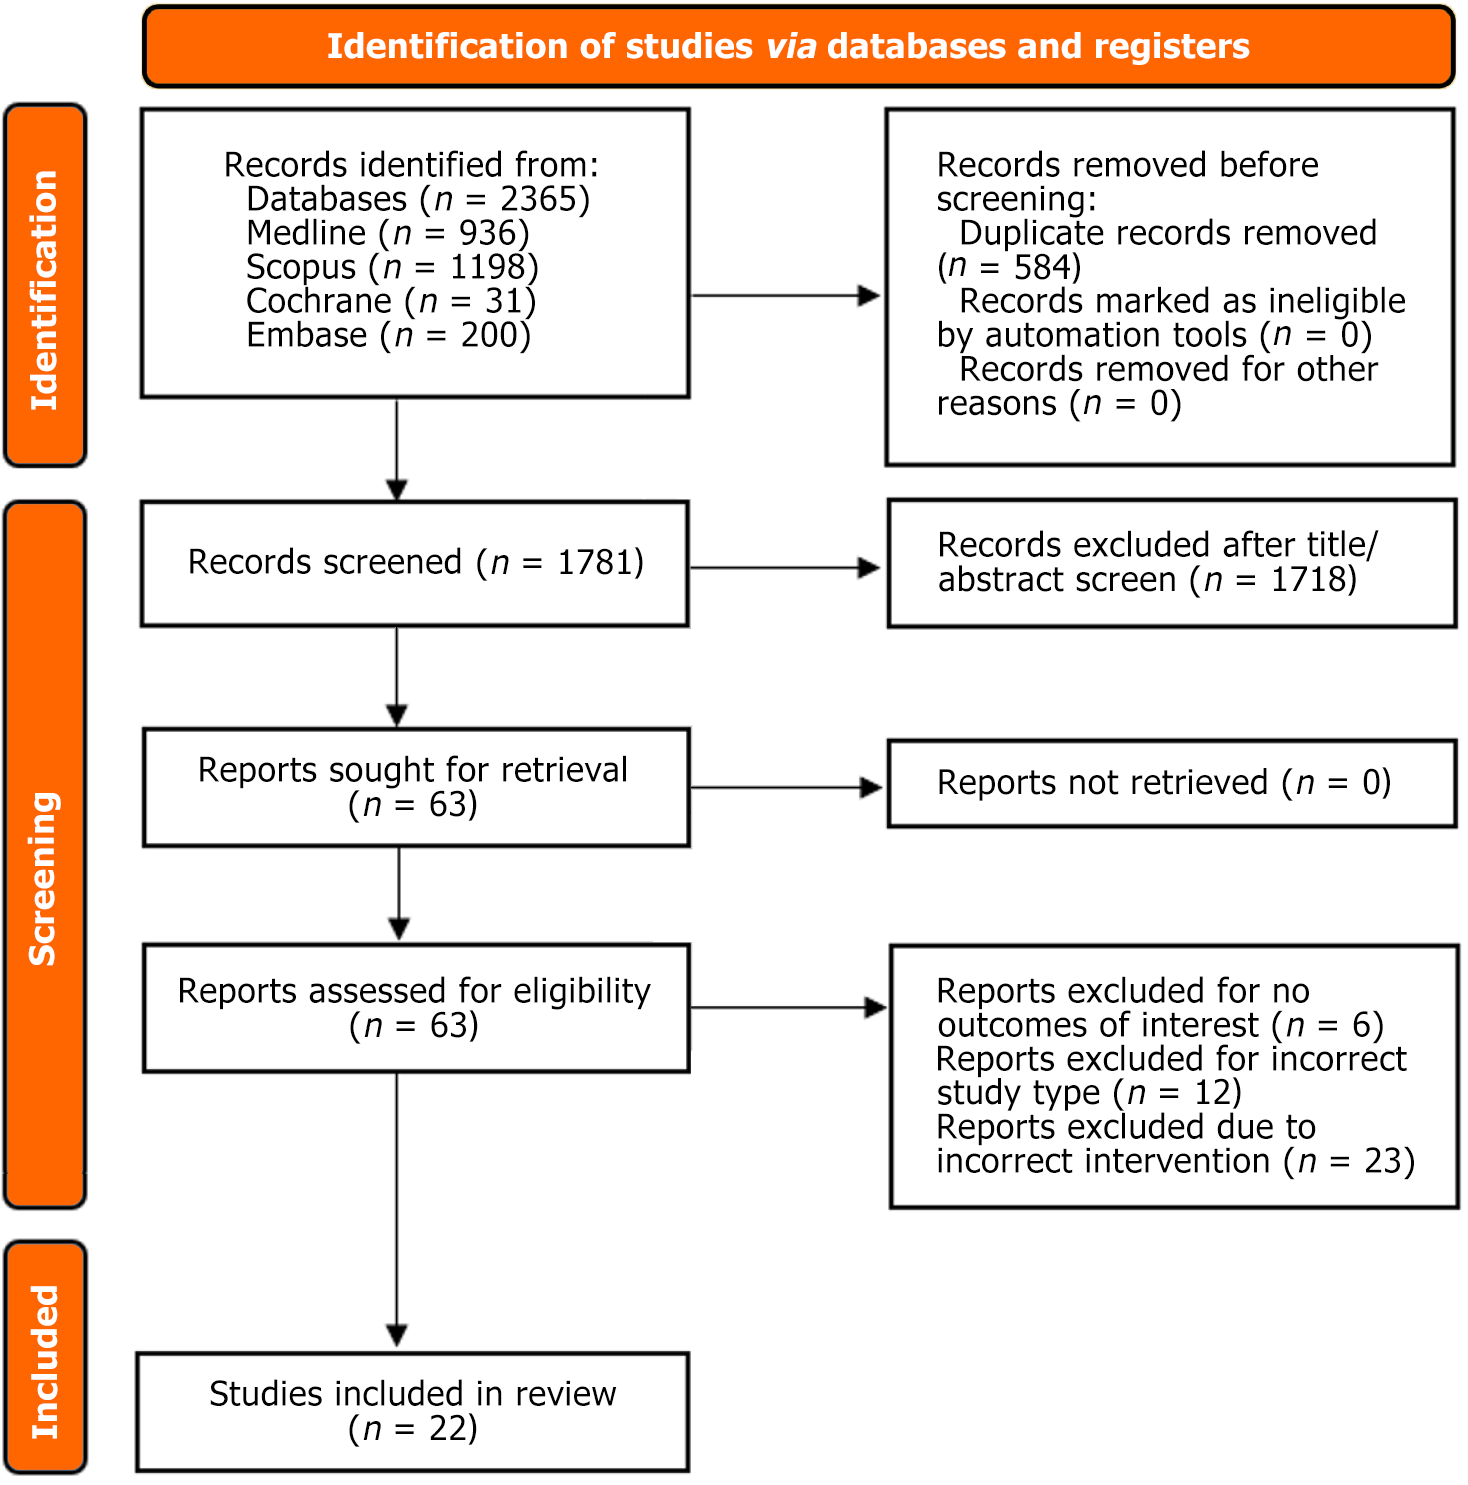
Figure 1 Preferred reporting items for systematic review and meta-analyses flowchart.
Figure 2 Forest plot of changes in estimated glomerular filtration rate.
IV: Inverse variance.
Figure 3 Forest plot of change in serum bicarbonate.
IV: Inverse variance.
Figure 4 Forest plot of death/prolonged hospitalization outcome.
M-H: Mantel-Haenszel.
Figure 5 Forest plot of gastrointestinal disorders outcome.
M-H: Mantel-Haenszel.
Figure 6 Forest plot of worsening edema outcome.
M-H: Mantel-Haenszel.
- Citation: Siddiqui AH, Batool F, Khan S, Rizvi SS, Usman S, Jawed H, Ali MH, Zehra T, Adil AR, Anwar M, Hanif A, Hassan SK, Noble MW, Moeed A, Surani S. Safety and efficacy of sodium bicarbonate for treating metabolic acidosis in chronic kidney disease: A systematic review and meta-analysis. World J Nephrol 2025; 14(1): 101078
- URL: https://www.wjgnet.com/2220-6124/full/v14/i1/101078.htm
- DOI: https://dx.doi.org/10.5527/wjn.v14.i1.101078


