©The Author(s) 2018.
World J Transplant. Feb 24, 2018; 8(1): 23-37
Published online Feb 24, 2018. doi: 10.5500/wjt.v8.i1.23
Published online Feb 24, 2018. doi: 10.5500/wjt.v8.i1.23
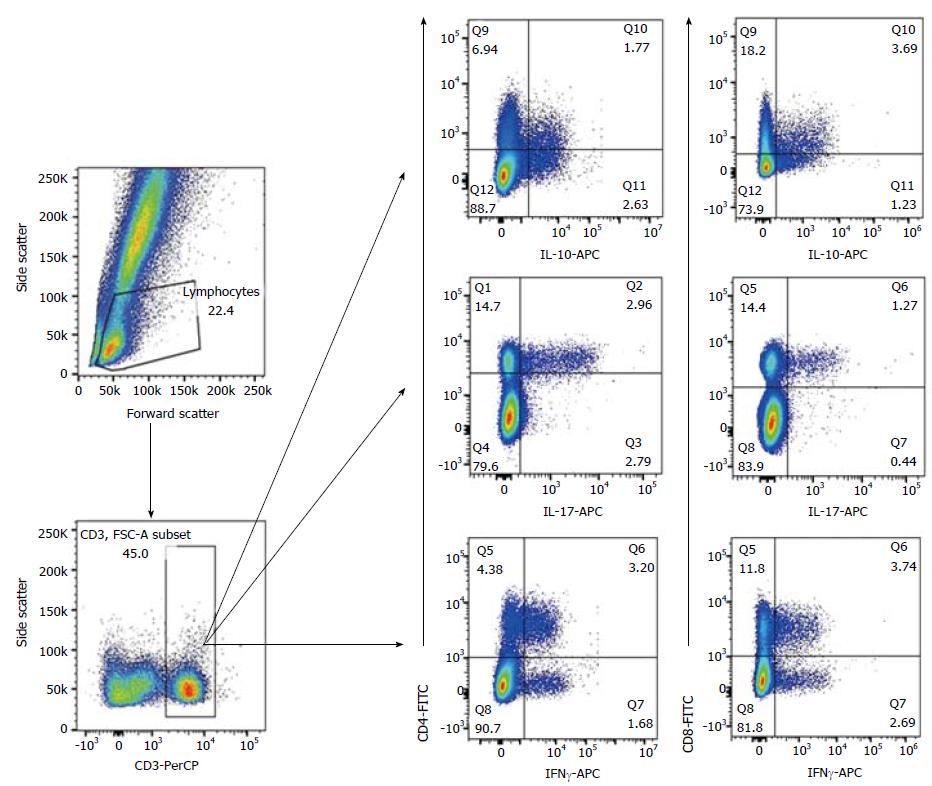
Figure 1 FACS analysis of cultured CD3+ T lymphocyte.
Whole blood peripheral CD4+ and CD8+ T lymphocytes from individual ESLF and ESRF patients as well as HC subjects were stain with anti-CD3, anti-CD8, anti-CD69, anti-IL-17, anti-IL-10 and anti-IFNγ monoclonal antibodies following manufacture’s guidelines upon in vitro stimulation with Io and PMA. CD4+ and CD8+ lymphocytes were gated within CD3+CD69+ population following polyclonal activation for 4 h. CD4+ T cells were consider to approximate CD3+CD8- T cells. At least 50000 events were acquired. Io: Ionomycin; PMA: Phorbol myristate acetate.
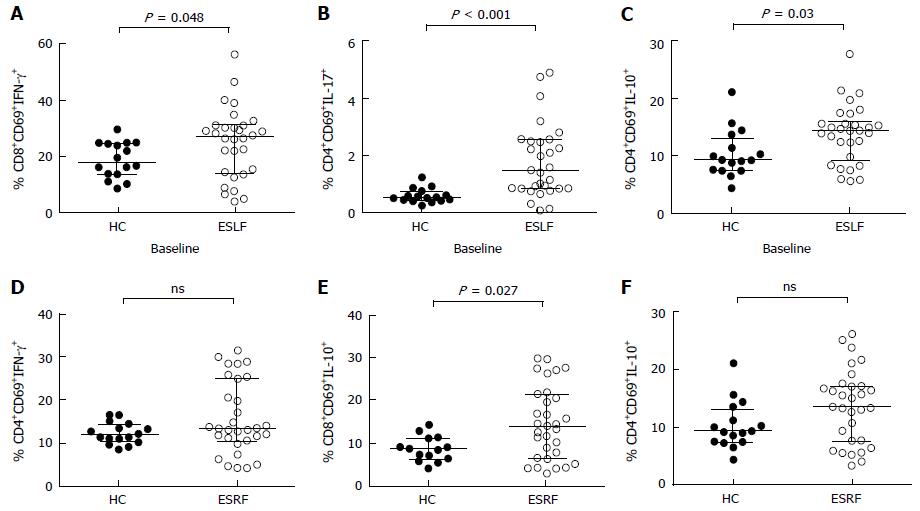
Figure 2 Quantitative analysis of cultured CD4 + and CD8 + T lymphocytes from individual end-stage liver failure, end-stage renal failure and healthy control subjects.
A: % CD4+CD69+INFγ+; B: CD4+CD69+IL-17+; C: CD4+CD69+IL-10+ cells in ESLF patients and HC individuals; D: % CD4+CD69+INF-γ+; E: CD8+CD69+IL-10+; F: CD4+CD69+IL-10+ cells in ESRF patients and HC individuals. The horizontal lines reflect median values for each group and vertical lines reflect interquartile range. ESLF: End-stage liver failure; ESRF: End-stage renal failure; HC: Healthy control.
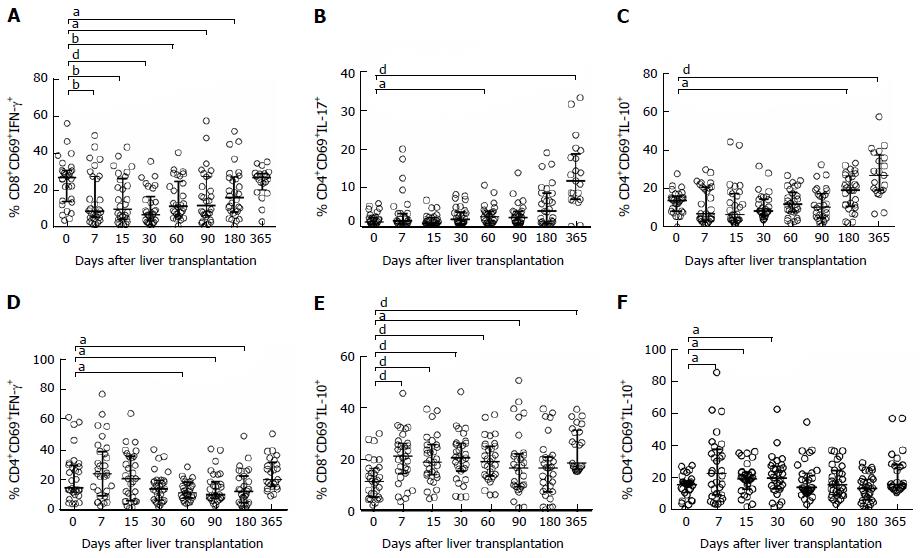
Figure 3 Cytokine-producing CD4+ and CD8+ T cells follow-up along first year after liver and kidney transplantation.
A: % of cultured IFNγ-producing CD8+ lymphocytes; B: % of cultured TH17 lymphocytes; C: % of cultured TH2 lymphocytes in LTr; D: % of cultured TH1 lymphocytes; E: % of cultured IL-10-producing CD8 T lymphocytes; F: % of cultured TH2 lymphocytes inKTr. The horizontal lines reflect median values for each group and vertical lines reflect interquartile range. aP < 0.05, bP < 0.01, dP < 0.001. Significances express the difference against baseline level.
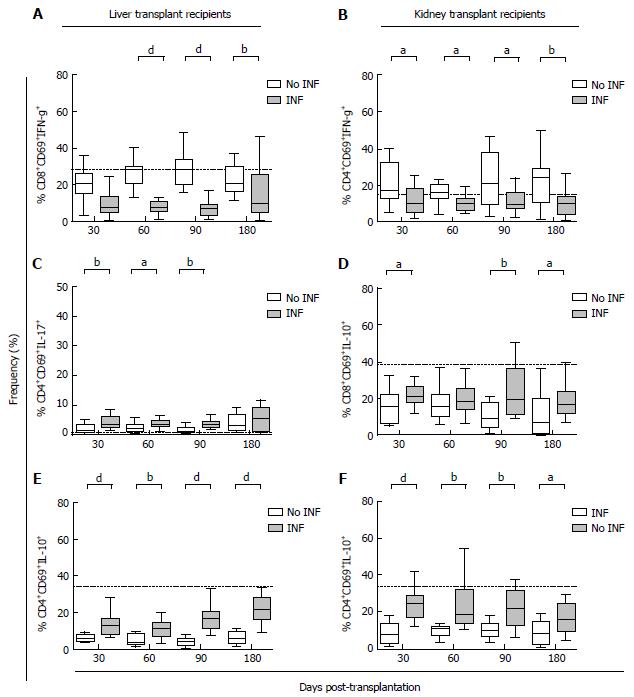
Figure 4 Stratification analysis of the percentage for the intracellular cytokine production capacity of CD4+ and CD8+ T lymphocytes between the 1st and 6th month post-transplantation.
A: % of CD8+CD69+IFNγ+ T lymphocytes in LTr with and without OI; B: % of CD4+CD69+IFNγ+ T lymphocytes in KTr with and without OI; C: % of CD4+CD69+IL-17+ T lymphocytes in LTr with and without OI; D: % of CD8+CD69+IL-10+ T lymphocytes in KTr with and without OI; E: % of CD4+CD69+IL-10+ T lymphocytes in LTr with and without OI; F: % of CD4+CD69+IL-10+ T lymphocytes in KTr with and without OI. LTr: liver transplant recipients; KTr: kidney transplant recipients. aP < 0.05, bP < 0.01, dP < 0.001.
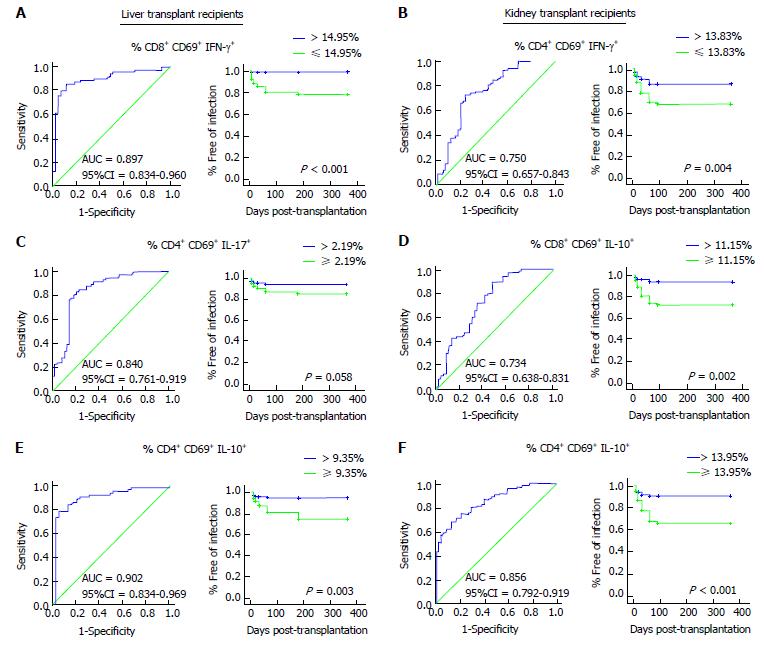
Figure 5 Post-transplantation receiver operating characteristic curve for the intracellular cytokine production capacity and the effect of the % of intracellular cytokine production capacity in stimulated T lymphocytes cut-off values for the discrimination of liver and kidney recipients likely to develop opportunistic infection between the 1st and 6th month post-transplantation (Kaplan–Meier analysis).
A: Post-transplant % of CD8+CD69+IFNγ+ in LTr; B: Post-transplant % of CD4+CD69+IFNγ+ in KTr; C: Post-transplant % of CD4+CD69+IL-17+ in LTr; D: Post-transplant % of CD8+CD69+IL-10+ in KTr; E: Post-transplant % of CD4+CD69+IL-10+ in LTr; F: post-transplant % of CD4+CD69+IL-10+ in KTr. LTr: Liver transplant recipients; KTr: Kidney transplant recipients.
- Citation: Boix F, Llorente S, Eguía J, Gonzalez-Martinez G, Alfaro R, Galián JA, Campillo JA, Moya-Quiles MR, Minguela A, Pons JA, Muro M. In vitro intracellular IFNγ, IL-17 and IL-10 producing T cells correlates with the occurrence of post-transplant opportunistic infection in liver and kidney recipients. World J Transplant 2018; 8(1): 23-37
- URL: https://www.wjgnet.com/2220-3230/full/v8/i1/23.htm
- DOI: https://dx.doi.org/10.5500/wjt.v8.i1.23


