©The Author(s) 2016.
World J Transplant. Mar 24, 2016; 6(1): 155-164
Published online Mar 24, 2016. doi: 10.5500/wjt.v6.i1.155
Published online Mar 24, 2016. doi: 10.5500/wjt.v6.i1.155
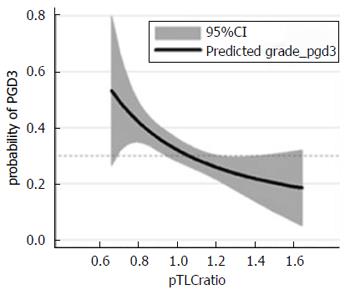
Figure 1 Lung size mismatch (the donor to recipient predicted total lung capacity ratio) is associated with the probability of primary graft dysfunction grade 3.
The relationship of pTLCratio (pTLCdonor/pTLCrecipeint) and predicted probability of any grade PGD grade 3 within 72 h is shown using a fractional polynomial fit with 95%CIs (gray area). Adapted with permission from Eberlein et al[14]. pTLC: Predicted total lung capacity; PGD: Primary graft dysfunction.
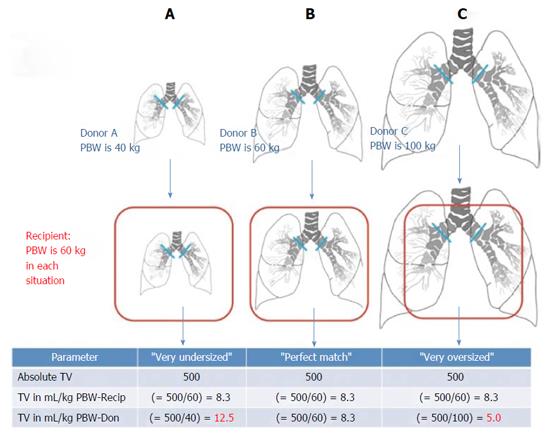
Figure 2 Conceptual graphic on the possible effect of lung size mismatch on mechanical ventilation tidal volumes expressed as mL/kg predicted body weights of the donor.
Reproduced with permission from Dezube et al[15]. Recip recipient, Don donor. PBW: Predicted body weight; TV: Tidal volume.
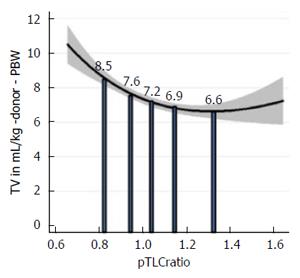
Figure 3 Lung size mismatch (predicted total lung capacity ratio) is associated with the mechanical ventilation tidal volumes at reperfusion, when the tidal volumes is related to the size of the allograft.
Fractional polynomial regression of the TV in mL/kg donor-predicted body weight (PBW) plotted against the pTLCratio (pTLCdonor/pTLCrecipeint). The solid vertical bars represent the mean values of the TV in mL/kg donor-PBW according to pTLCratio-quintiles. Adapted with permission from Eberlein et al[14]. TV: Tidal volumes; pTLC: Predicted total lung capacity.
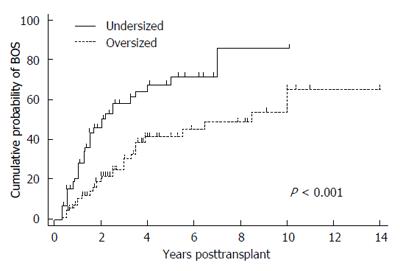
Figure 4 Kaplan Meier estimates of proportion of patients with bronchiolitis obliterans syndrome stratified by recipients of undersized or oversized donor lungs.
Oversized was defined as a donor to recipient predicted total lung capacity (pTLC) ratio > 1.0 and undersized as pTLCratio ≤ 1.0. Comparison between over- and undersized cohorts was via log-rank test. Adapted with permission from Eberlein et al[5]. BOS: Bronchiolitis obliterans syndrome.
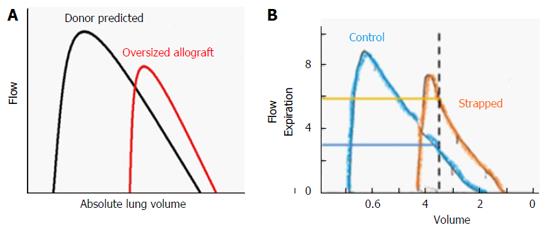
Figure 5 Oversized allograft (A) and chest wall strapping (B) analogy.
A: Schematic flow volume loops according to donor predicted values (black line) and measured mean values of recipients of oversized allografts (red line) during the early post-transplant period (1-6 mo). Flows are plotted against absolute lung volume; B: Control (blue) and chest wall strapped (orange) flow volume loops are shown. Adapted with permission from Eberlein et al[5,28].
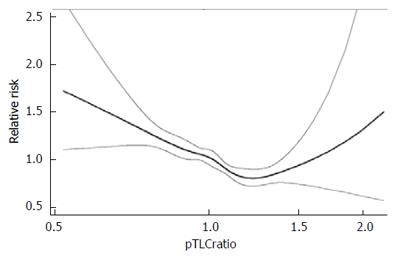
Figure 6 Impact of predicted total lung capacity ratio on the risk of death after lung transplant.
Adapted with permission from Eberlein et al[6]. pTLC: Predicted total lung capacity.
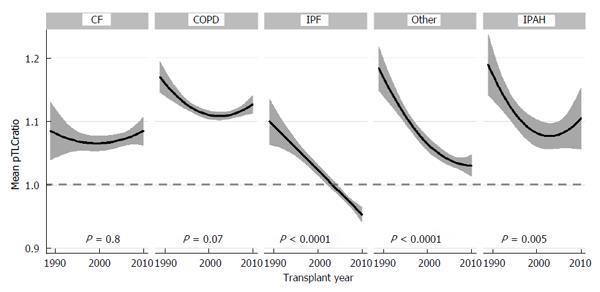
Figure 7 Mean predicted total lung capacity ratio according to transplant year stratified by lung transplant indication.
Adapted with permission from Taher et al[34]. pTLC: Predicted total lung capacity; CF: Cystic fibrosis; COPD: Chronic obstructive pulmonary disease; IPF: Idiopathic pulmonary fibrosis; IPAH: Idiopathic pulmonary arterial hypertension.
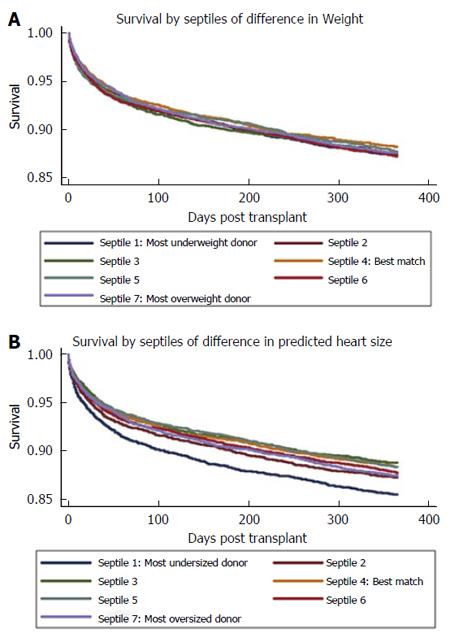
Figure 8 Unadjusted Kaplan-Meier graphs of survival, by septiles of matching by body weight (A) vs predicted total heart mass (B).
Adapted with permission from Reed et al[2].
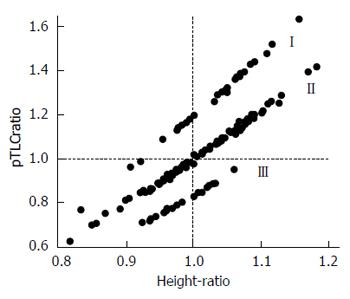
Figure 9 Relationship between predicted total lung capacity ratio and height ratio.
The separation between clusters I (male donor-female recipient), II (sex matched) and III (female to male) is due to effects of sex on lung size. Adapted with permission from Eberlein et al[7]. pTLC: Predicted total lung capacity.
- Citation: Eberlein M, Reed RM. Donor to recipient sizing in thoracic organ transplantation. World J Transplant 2016; 6(1): 155-164
- URL: https://www.wjgnet.com/2220-3230/full/v6/i1/155.htm
- DOI: https://dx.doi.org/10.5500/wjt.v6.i1.155


