Copyright
©The Author(s) 2025.
World J Transplant. Sep 18, 2025; 15(3): 102378
Published online Sep 18, 2025. doi: 10.5500/wjt.v15.i3.102378
Published online Sep 18, 2025. doi: 10.5500/wjt.v15.i3.102378
Figure 1 Surgical technique of middle hepatic vein tirubatiries reconstruction.
A: V-5 is anastomosed with polytetrafluoroethylene (PTFE) graft end-to-end manner directly entering inferior vena cava (IVC); B: V8 is anastomosed with PTFE graft end-to-end manner directly entering IVC; C: V5 is anastomosed with PTFE graft end-to-end manner, V8 is anastomosed with PTFE graft end-to-side manner and entering IVC directly; D: V5 is anastomosed with PTFE graft in end-to-end manner, V8 is anastomosed with PTFE graft in end-to-side manner, then the proximal end of PTFE graft is combined with Triangulation method with right hepatic vein. IVC: Inferior vena cava; RHV: Right hepatic vein.
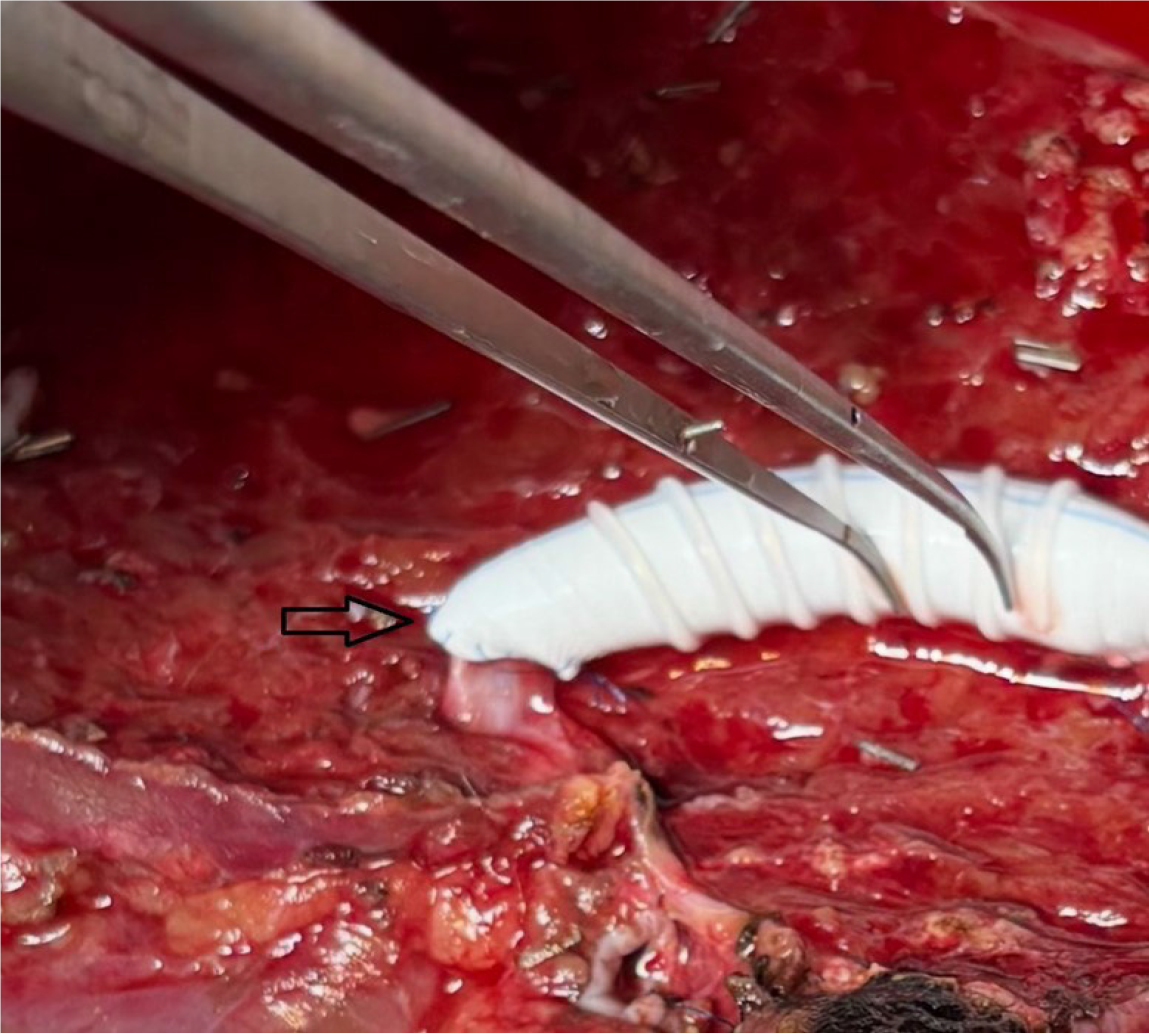
Figure 2
Bench procedure black arrow shows reconstructed V5 vein with prosthetic graft (end-to-end anastomosis).
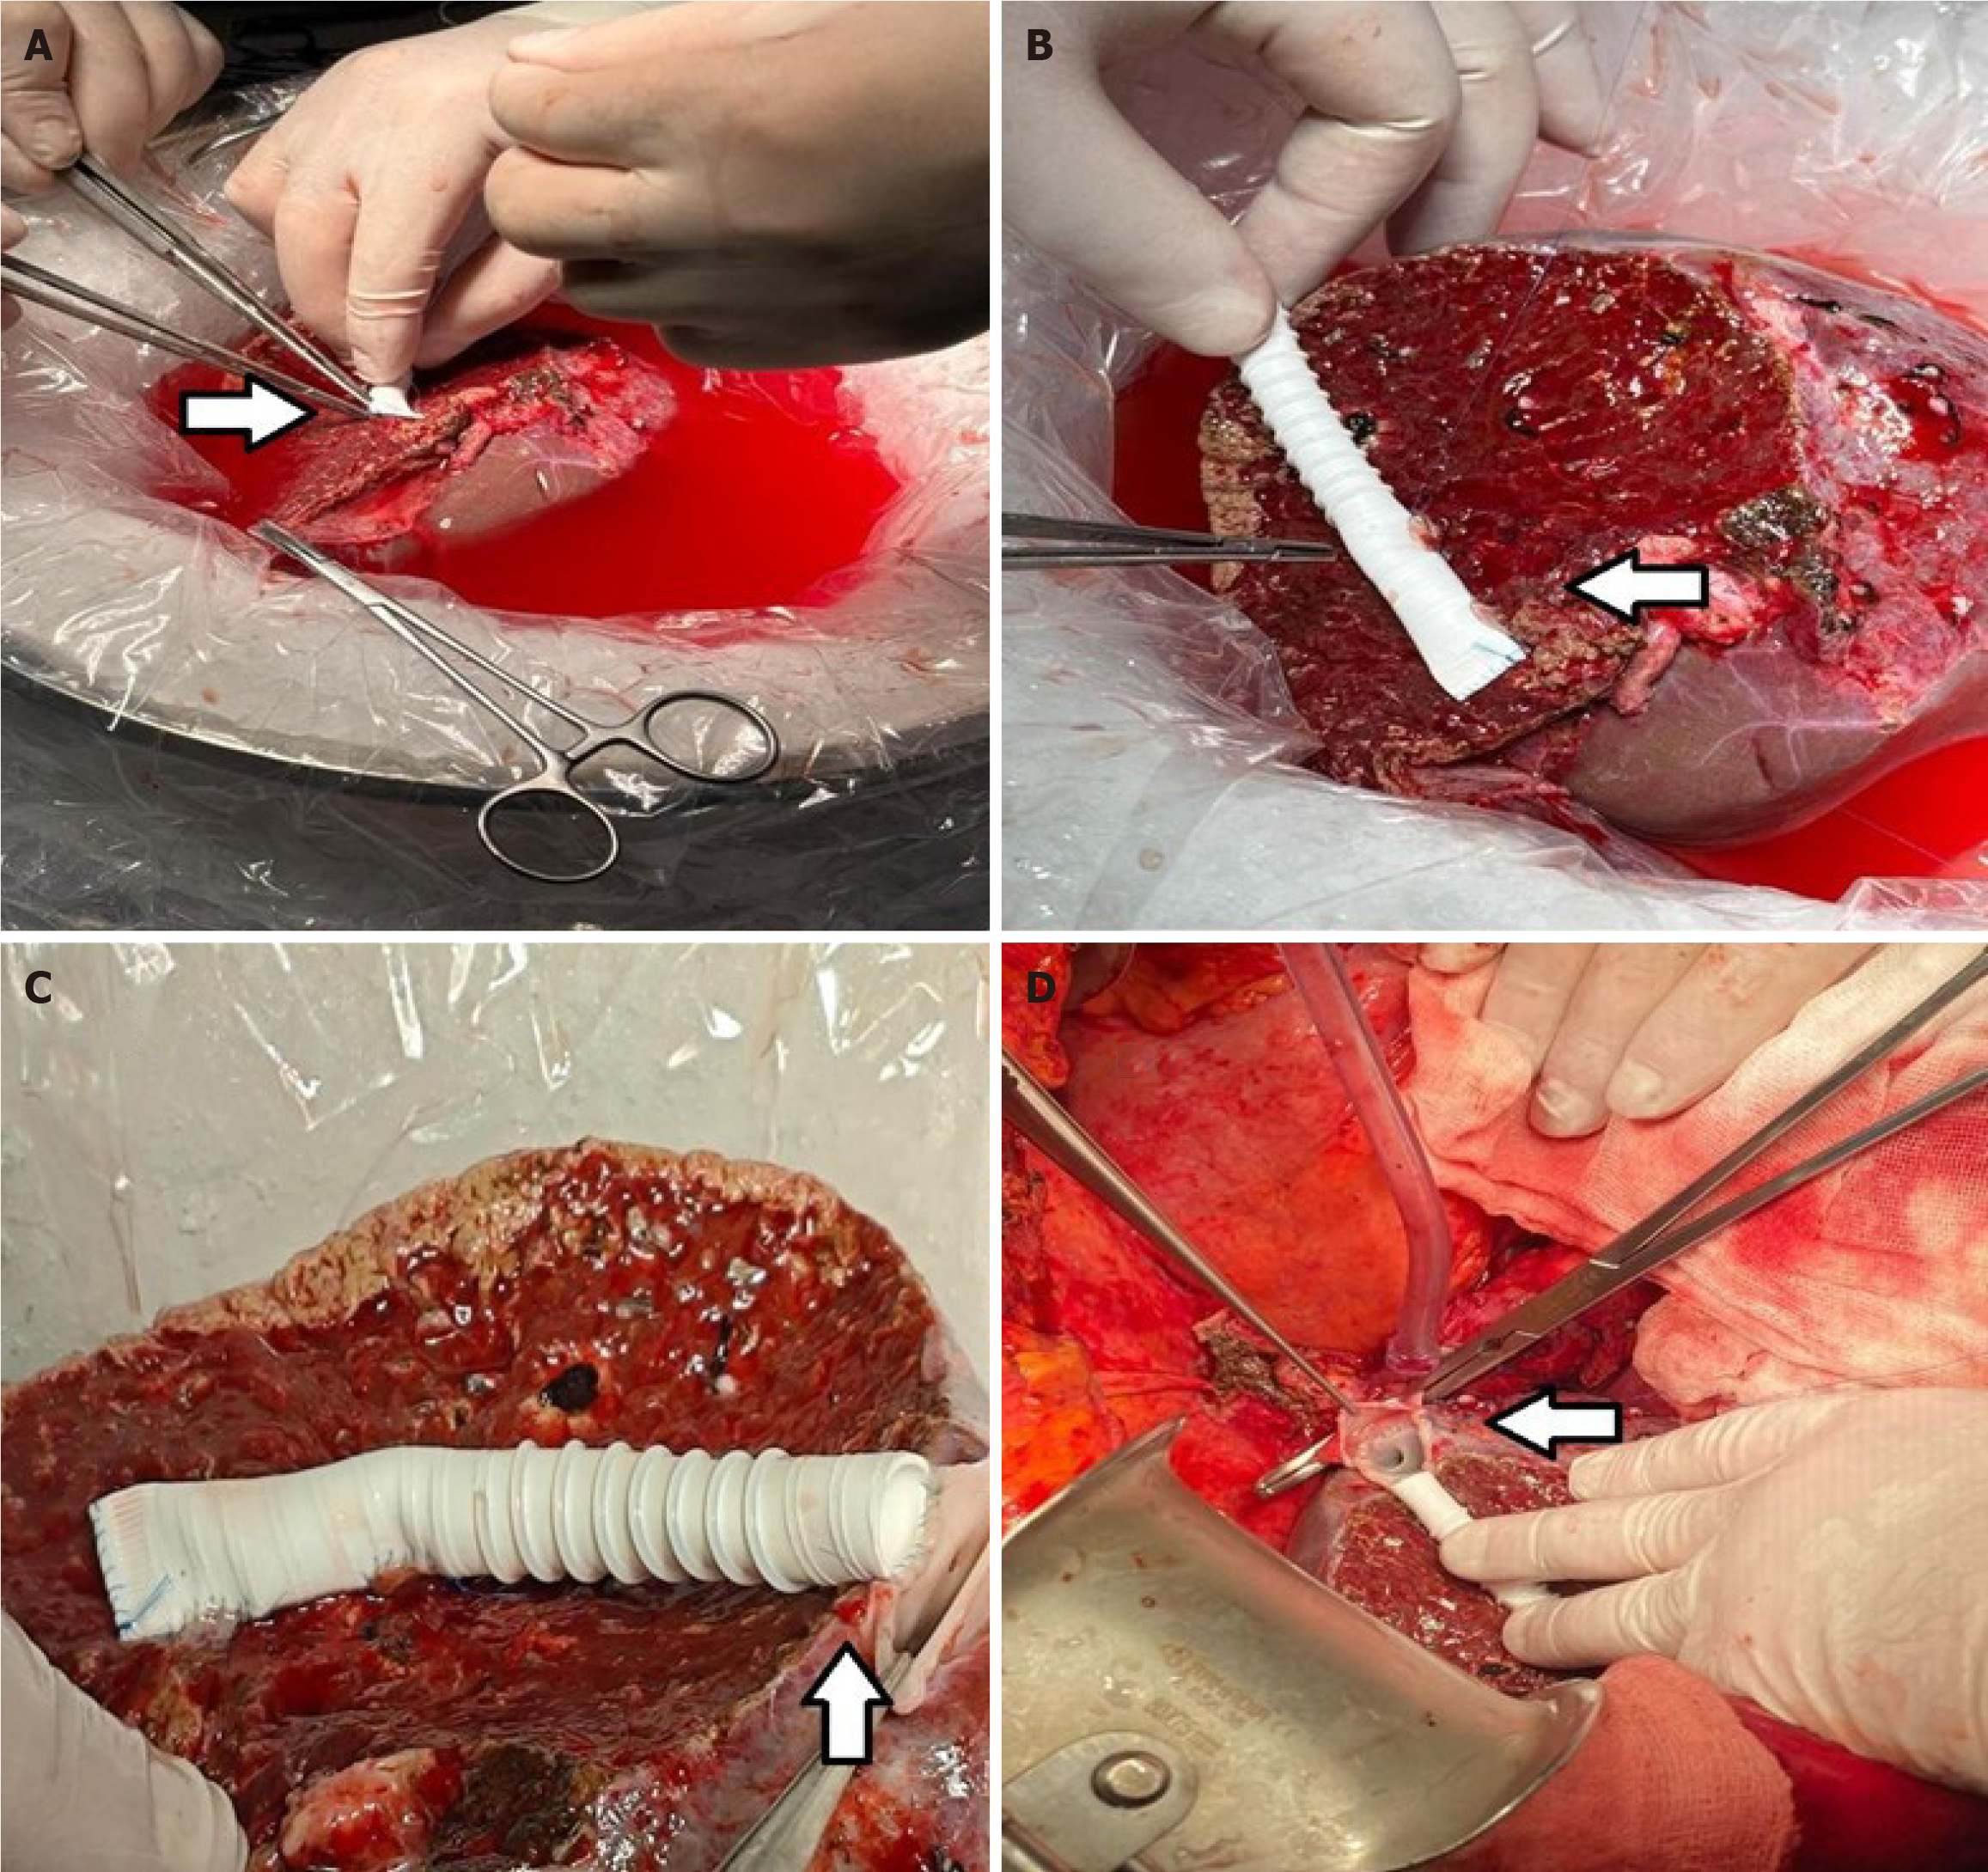
Figure 3 Bench procedure reconstruction of V5-V8 with prosthetic graft–triangulation with right hepatic vein and implantation.
A: Reconstruction of V5 branch-in end-to-end anastomosis with polytetrafluoroethylene (PTFE) graft; B: Reconstructed V8 branch side-to-side anastomosis with PTFE graft; C: Reconstructed PTFE-right hepatic vein (RHV) triangulation; D: Implantation process-clamped recipients RHV to graft RHV + PTFE graft.
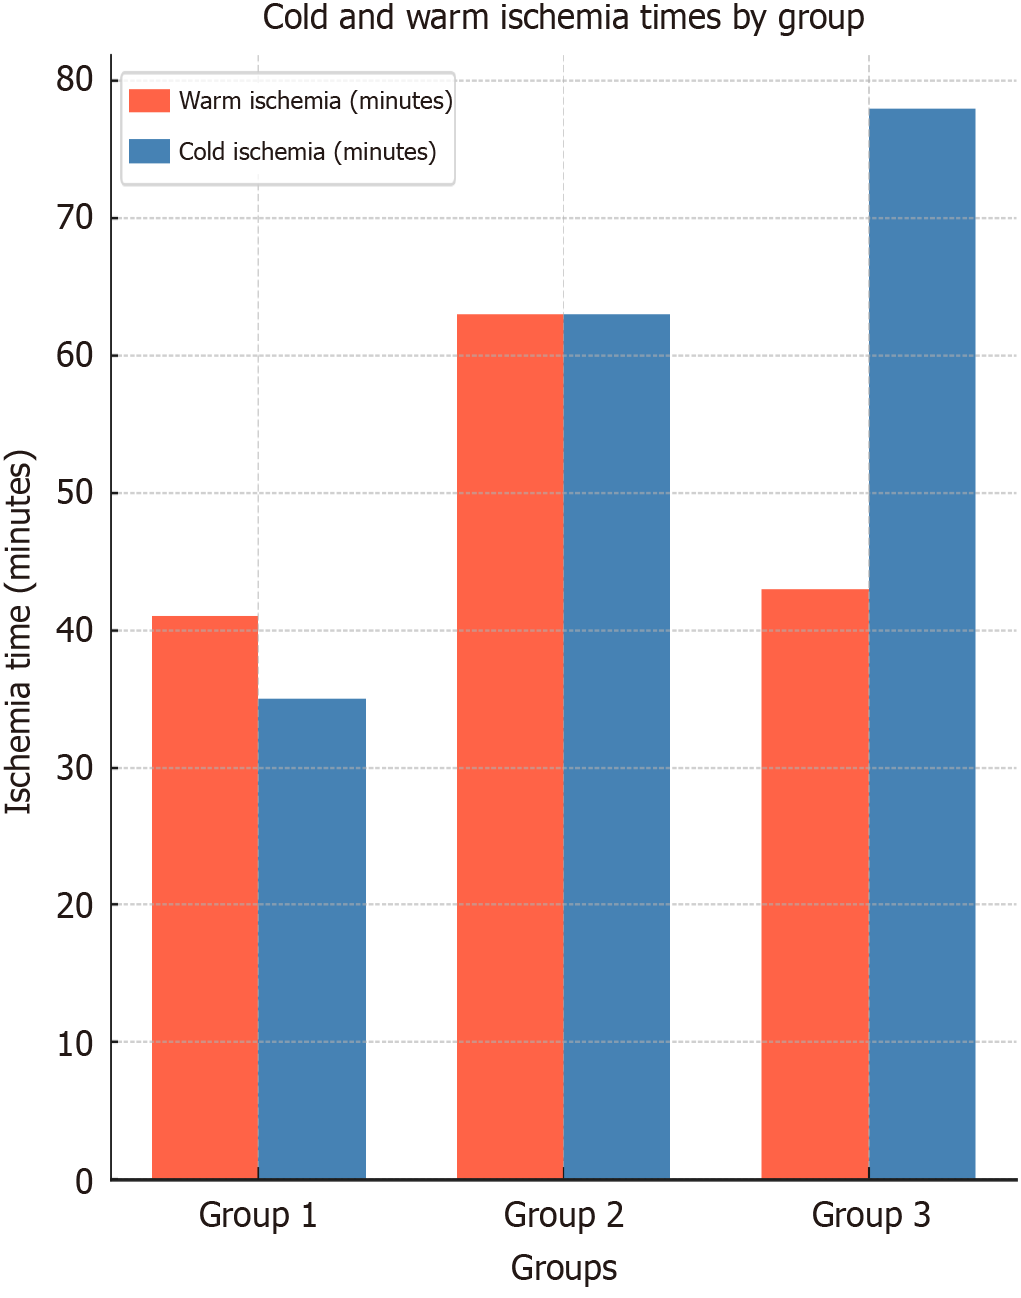
Figure 4
Cold and warm ischemia times by groups.
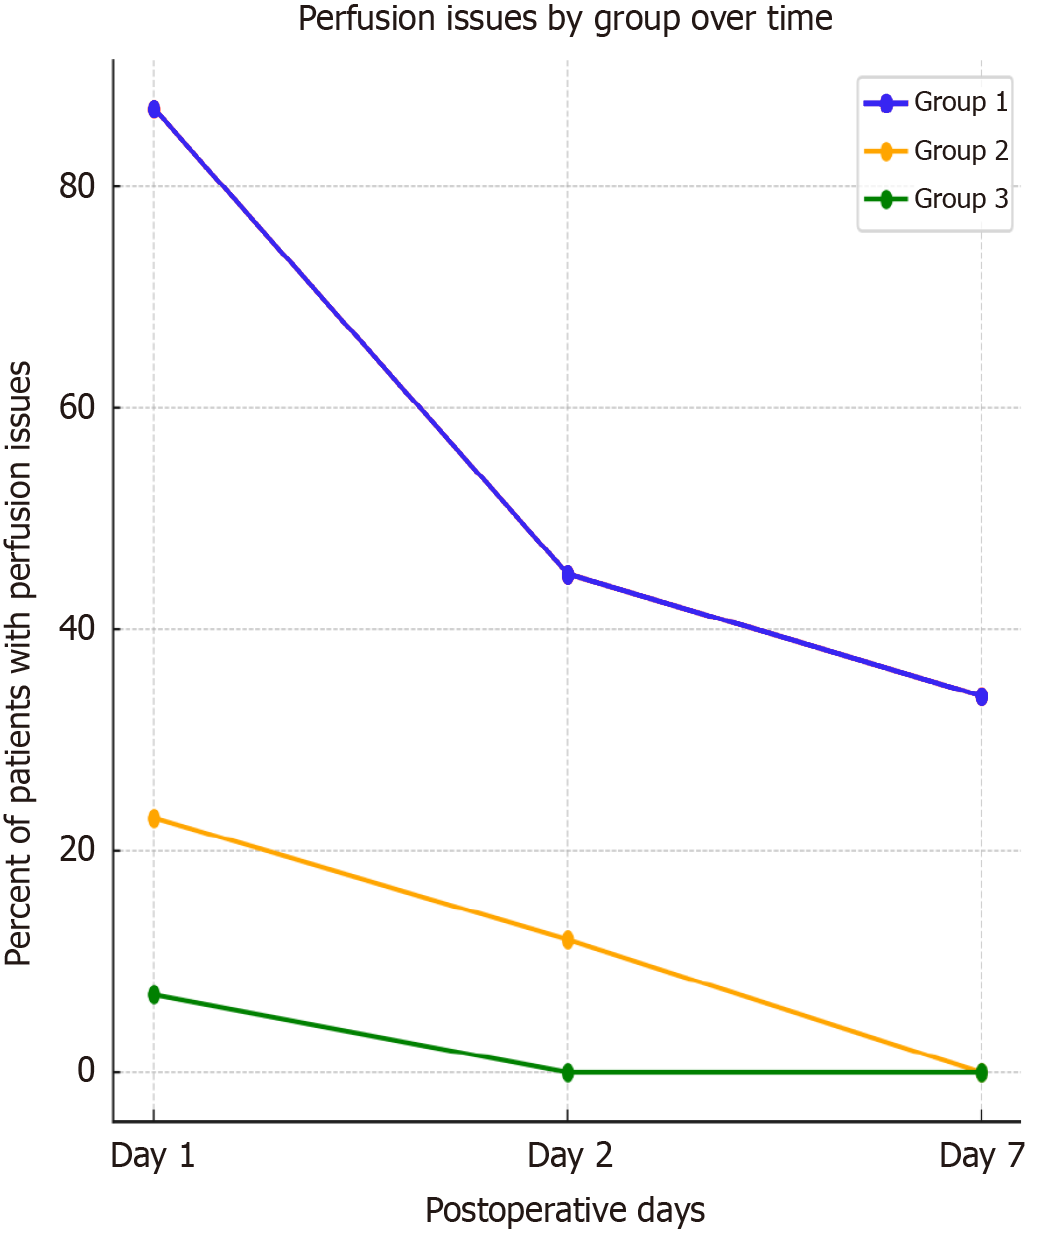
Figure 5
Graft perfusion issues by group over time.
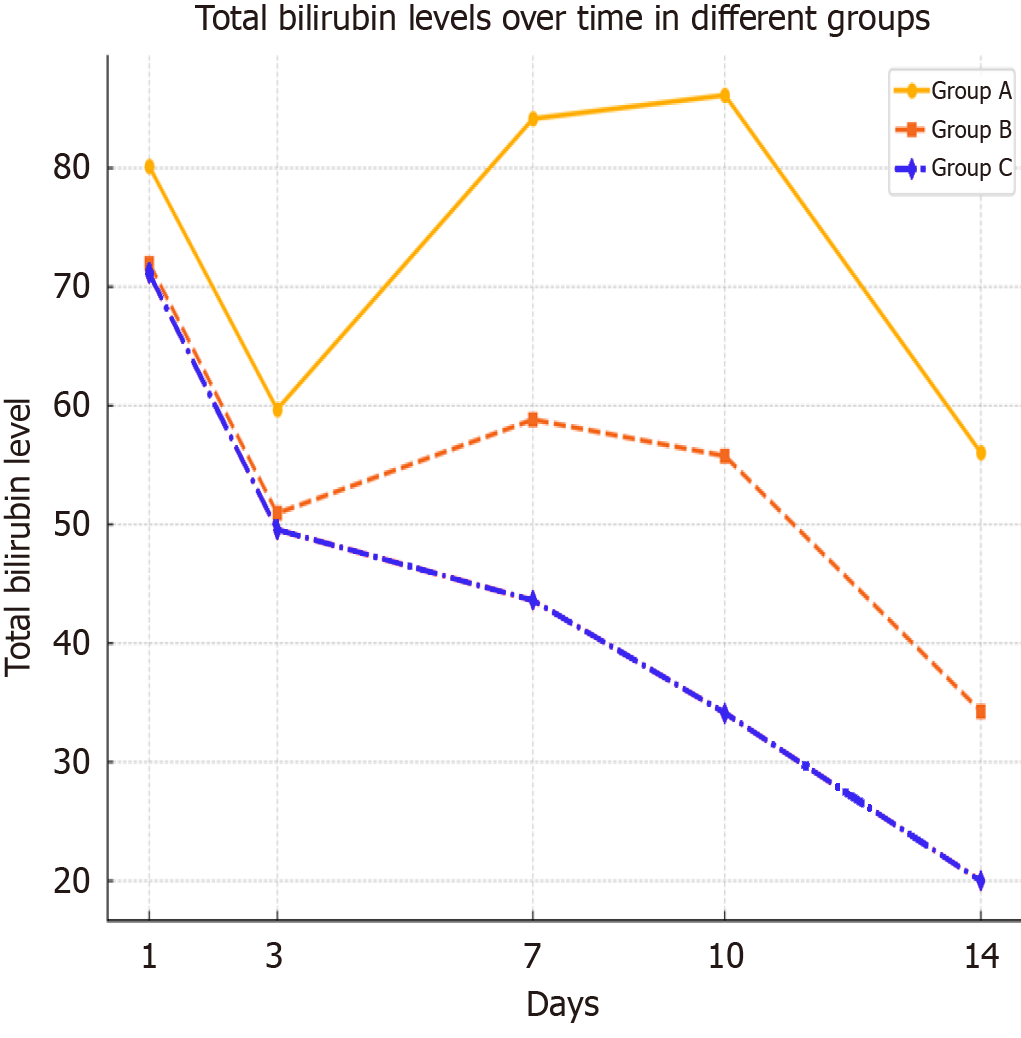
Figure 6 The graph shows the total bilirubin levels across different days for group 1, group 2, and group 3.
Group 1 starts at a higher level compared to the other groups, experiencing fluctuations over the period, while group 2 and group 3 show a more consistent decrease.
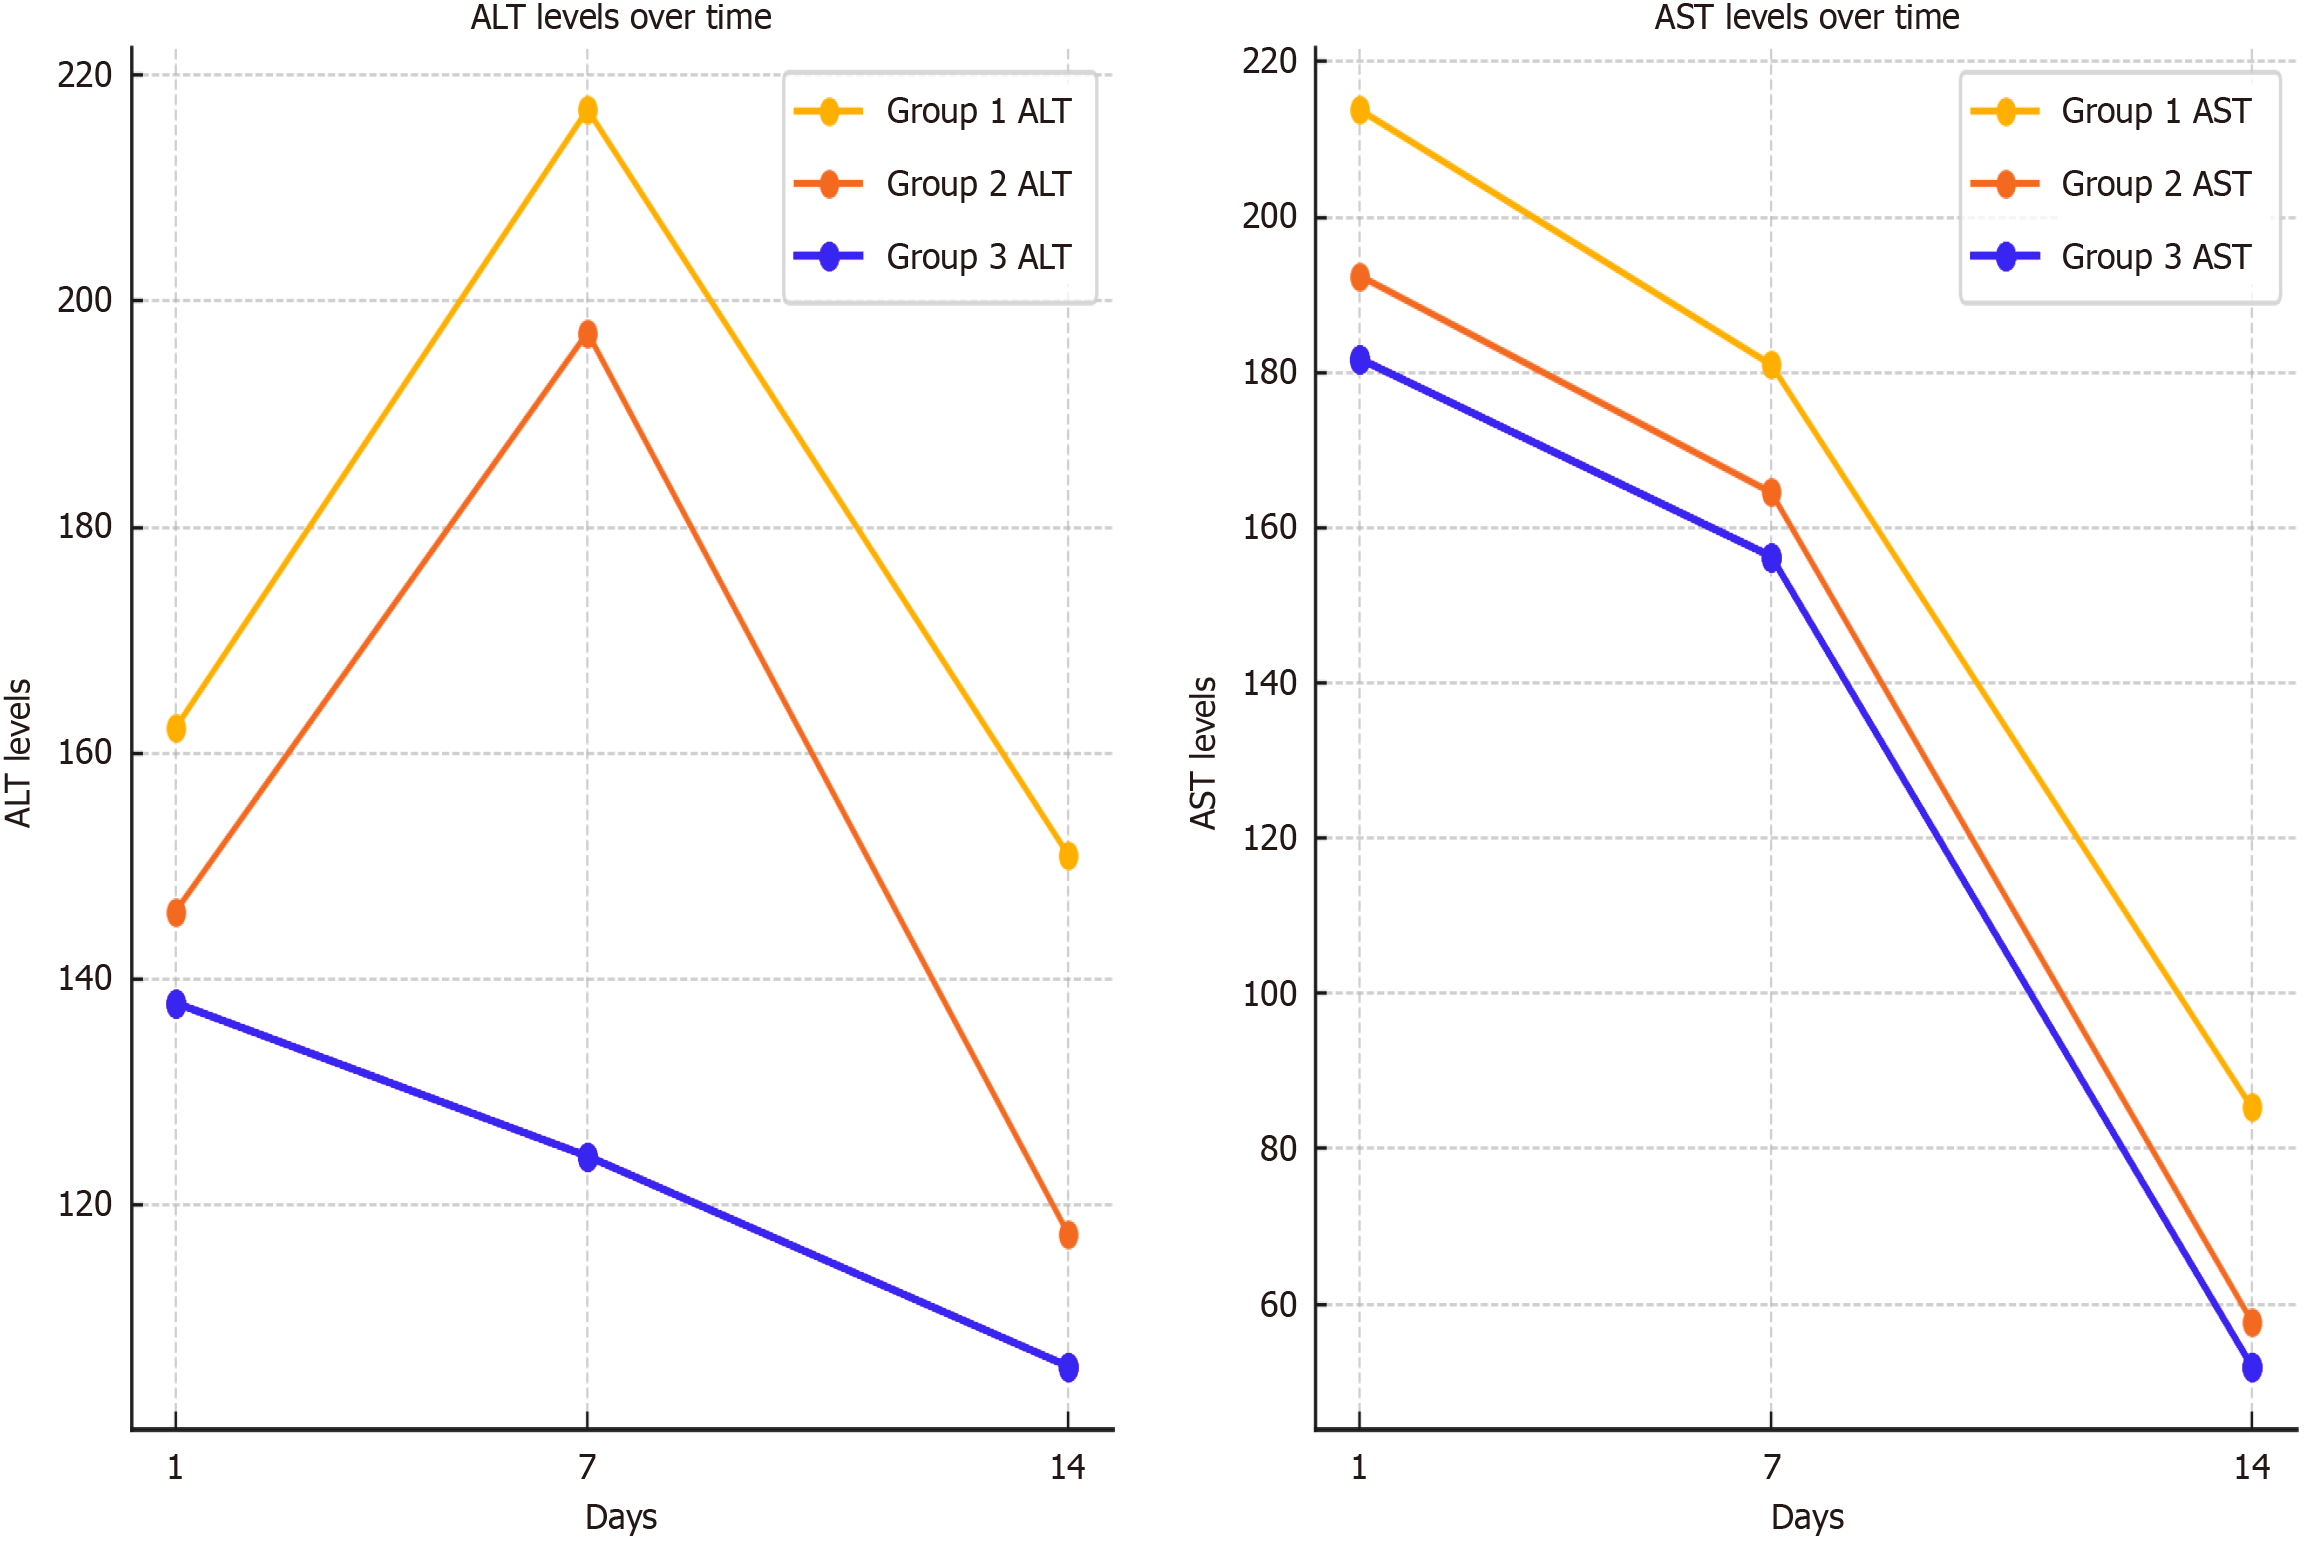
Figure 7 Alanine aminotransferase/aspartate aminotransferase levels over time.
This diagram illustrates the changes in alanine aminotransferase (ALT) and aspartate aminotransferase (AST) levels over time for three different groups on day 1, day 7, and day 14. Group 1 shows an initial rise in both ALT and AST levels followed by a decline. Group 2 shows a similar trend but with a lower peak on day 7. Group 3 displays a consistent decrease in both ALT and AST levels over the 14 days, indicating a different response pattern compared to the other groups. ALT: Alanine aminotransferase; AST: Aspartate aminotransferase.
- Citation: Beridze D, Mikeladze L, Tomadze G, Kordzaia D, Kashibadze K. Peculiarities of implantation of the right graft veins into the inferior vena cava during living donor liver transplantation. World J Transplant 2025; 15(3): 102378
- URL: https://www.wjgnet.com/2220-3230/full/v15/i3/102378.htm
- DOI: https://dx.doi.org/10.5500/wjt.v15.i3.102378


