Copyright
©The Author(s) 2025.
World J Transplant. Jun 18, 2025; 15(2): 98228
Published online Jun 18, 2025. doi: 10.5500/wjt.v15.i2.98228
Published online Jun 18, 2025. doi: 10.5500/wjt.v15.i2.98228
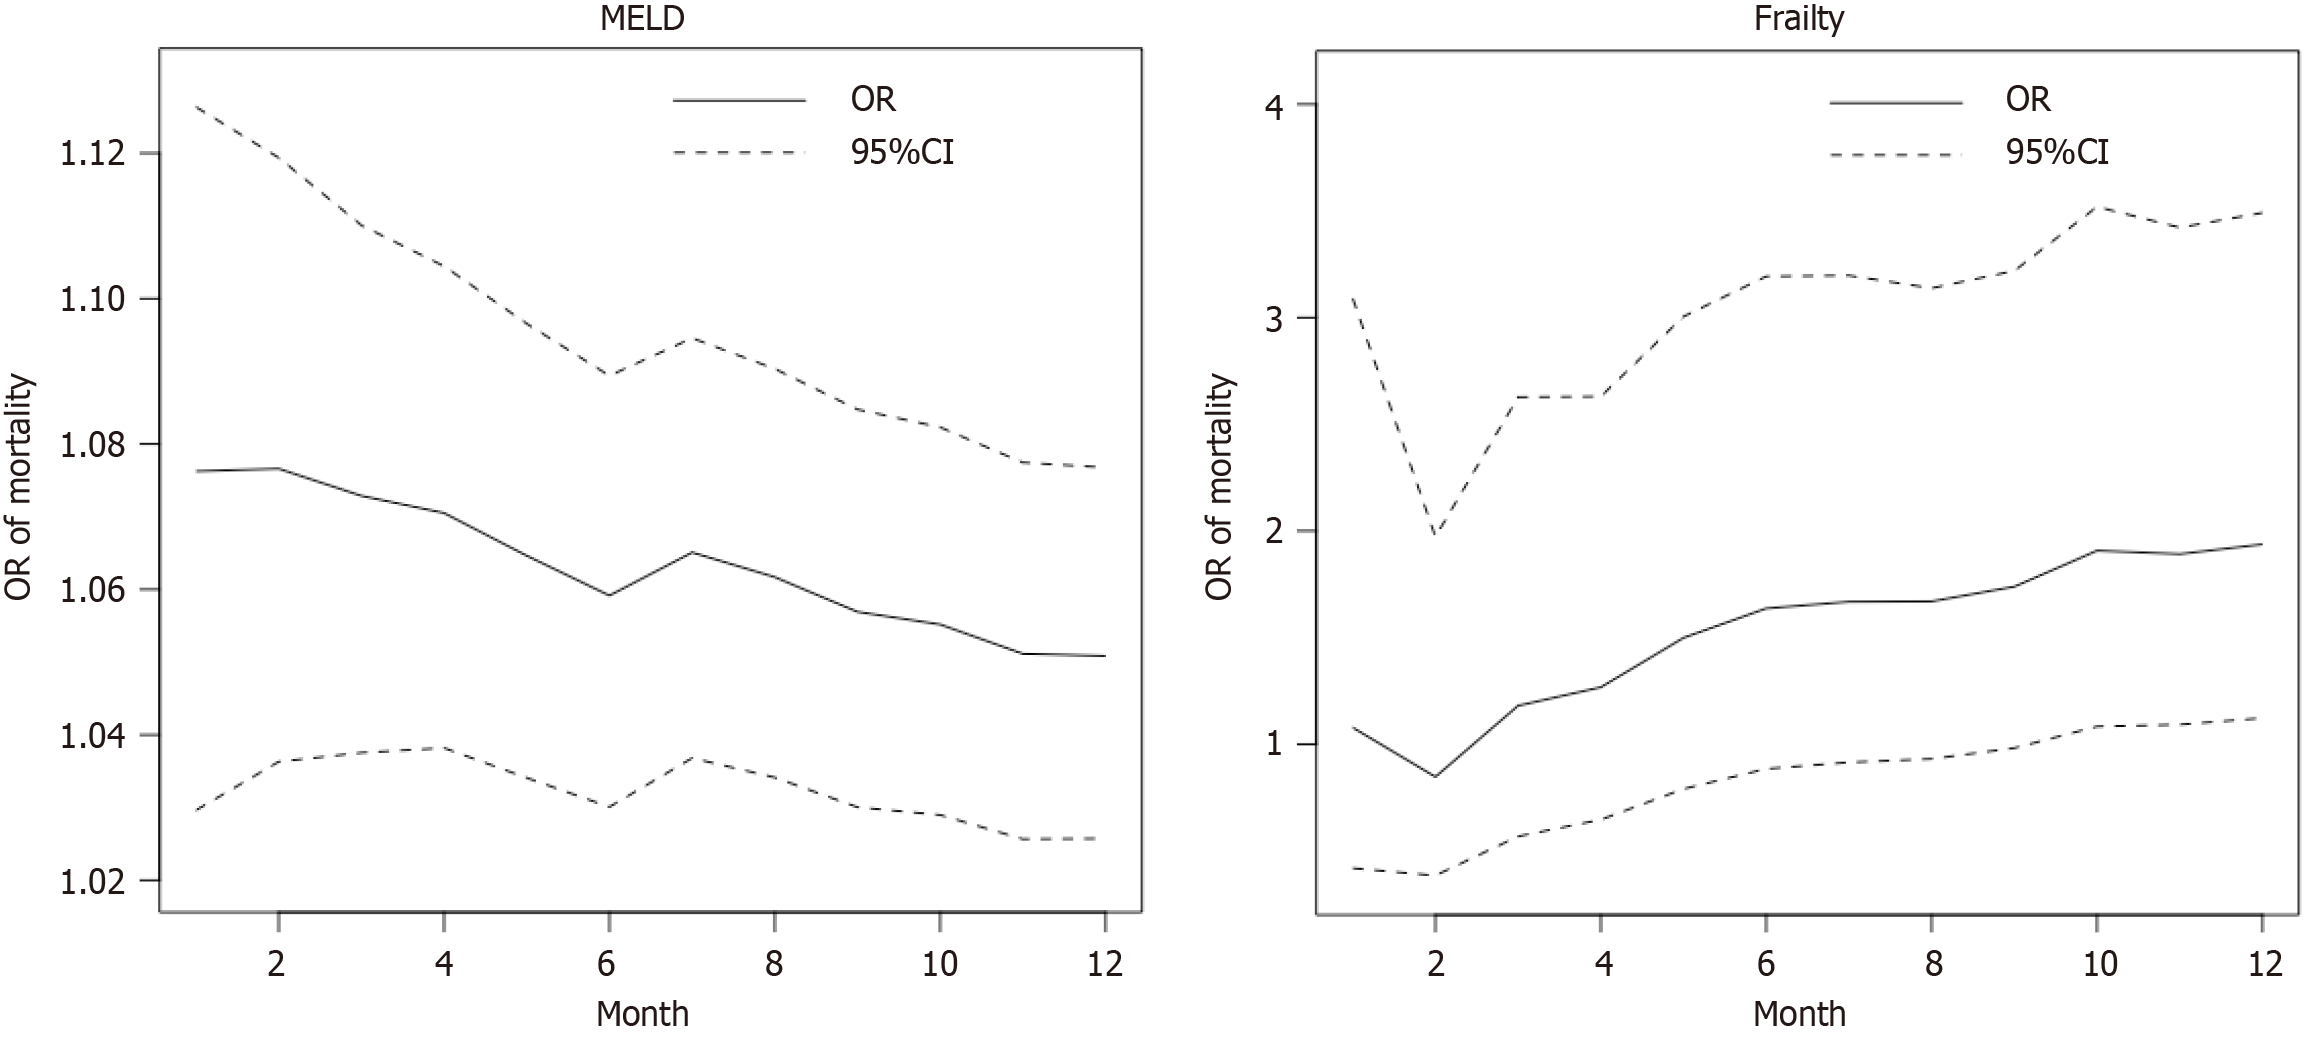
Figure 1 Trend of odds ratios of mortality.
The trend for the association of odds ratios of mortality with model for end-stage liver disease score (left) and Frailty (right) for different models with mortality within 1-12 months. MELD: Model for end-stage liver disease; OR: Odds ratio.
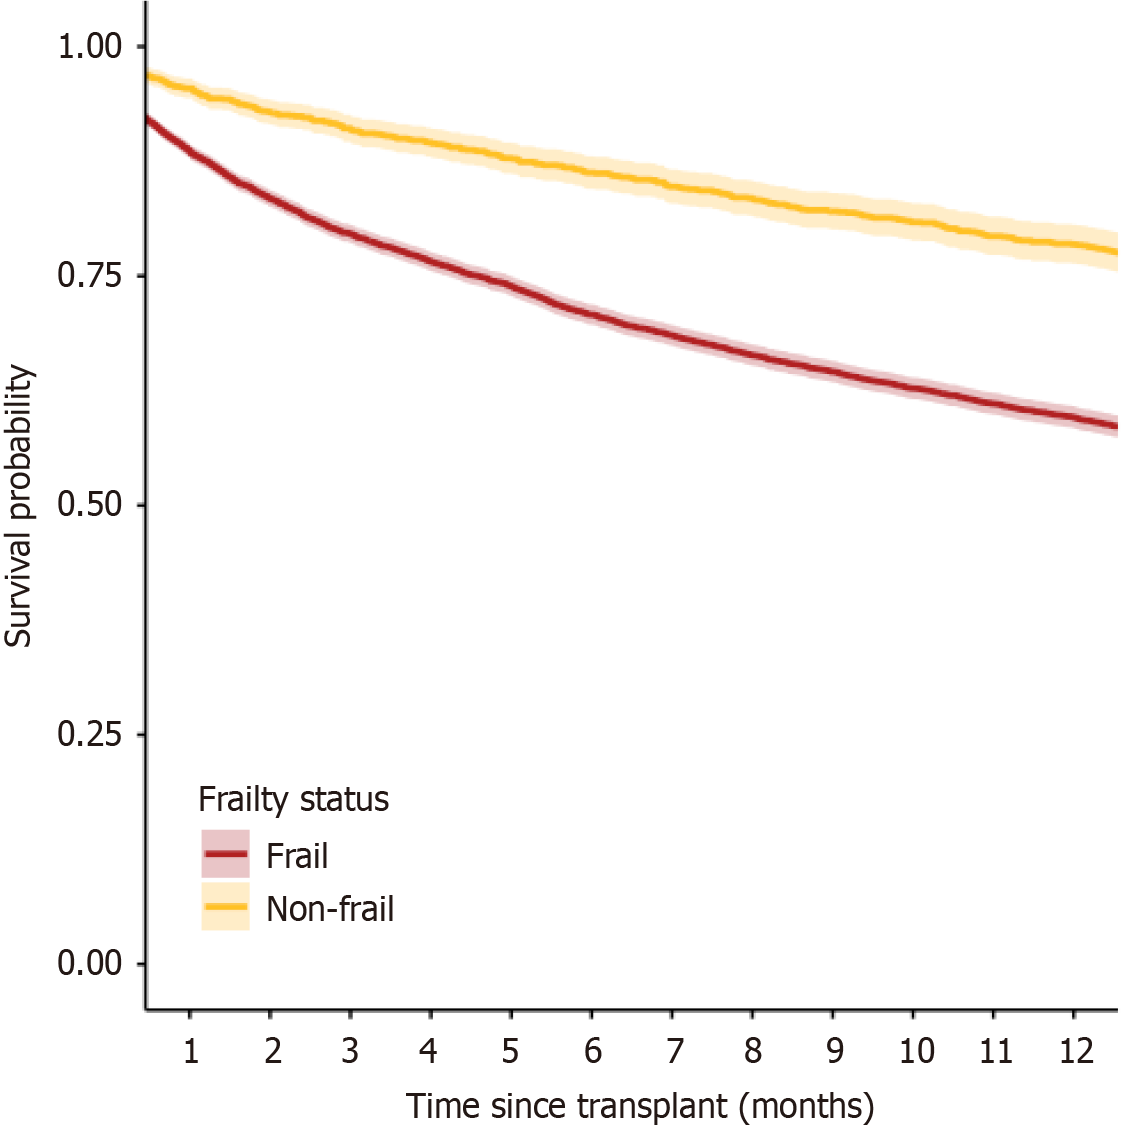
Figure 2 Survival curves 1-12 months.
The survival curves within the first 12 months following liver transplant for the two frailty subgroups are presented.
- Citation: Balogh J, Mubashir T, Li Y, Digbeu BD, Hegde N, Pour FM, Rezapour M, Lai HY, West K, Chaudhry RA, Williams GW, Maroufy V. Effect of frailty as measured by functional impairment on long-term outcomes in liver transplantation in the United States. World J Transplant 2025; 15(2): 98228
- URL: https://www.wjgnet.com/2220-3230/full/v15/i2/98228.htm
- DOI: https://dx.doi.org/10.5500/wjt.v15.i2.98228


