©The Author(s) 2024.
World J Transplant. Mar 18, 2024; 14(1): 89255
Published online Mar 18, 2024. doi: 10.5500/wjt.v14.i1.89255
Published online Mar 18, 2024. doi: 10.5500/wjt.v14.i1.89255
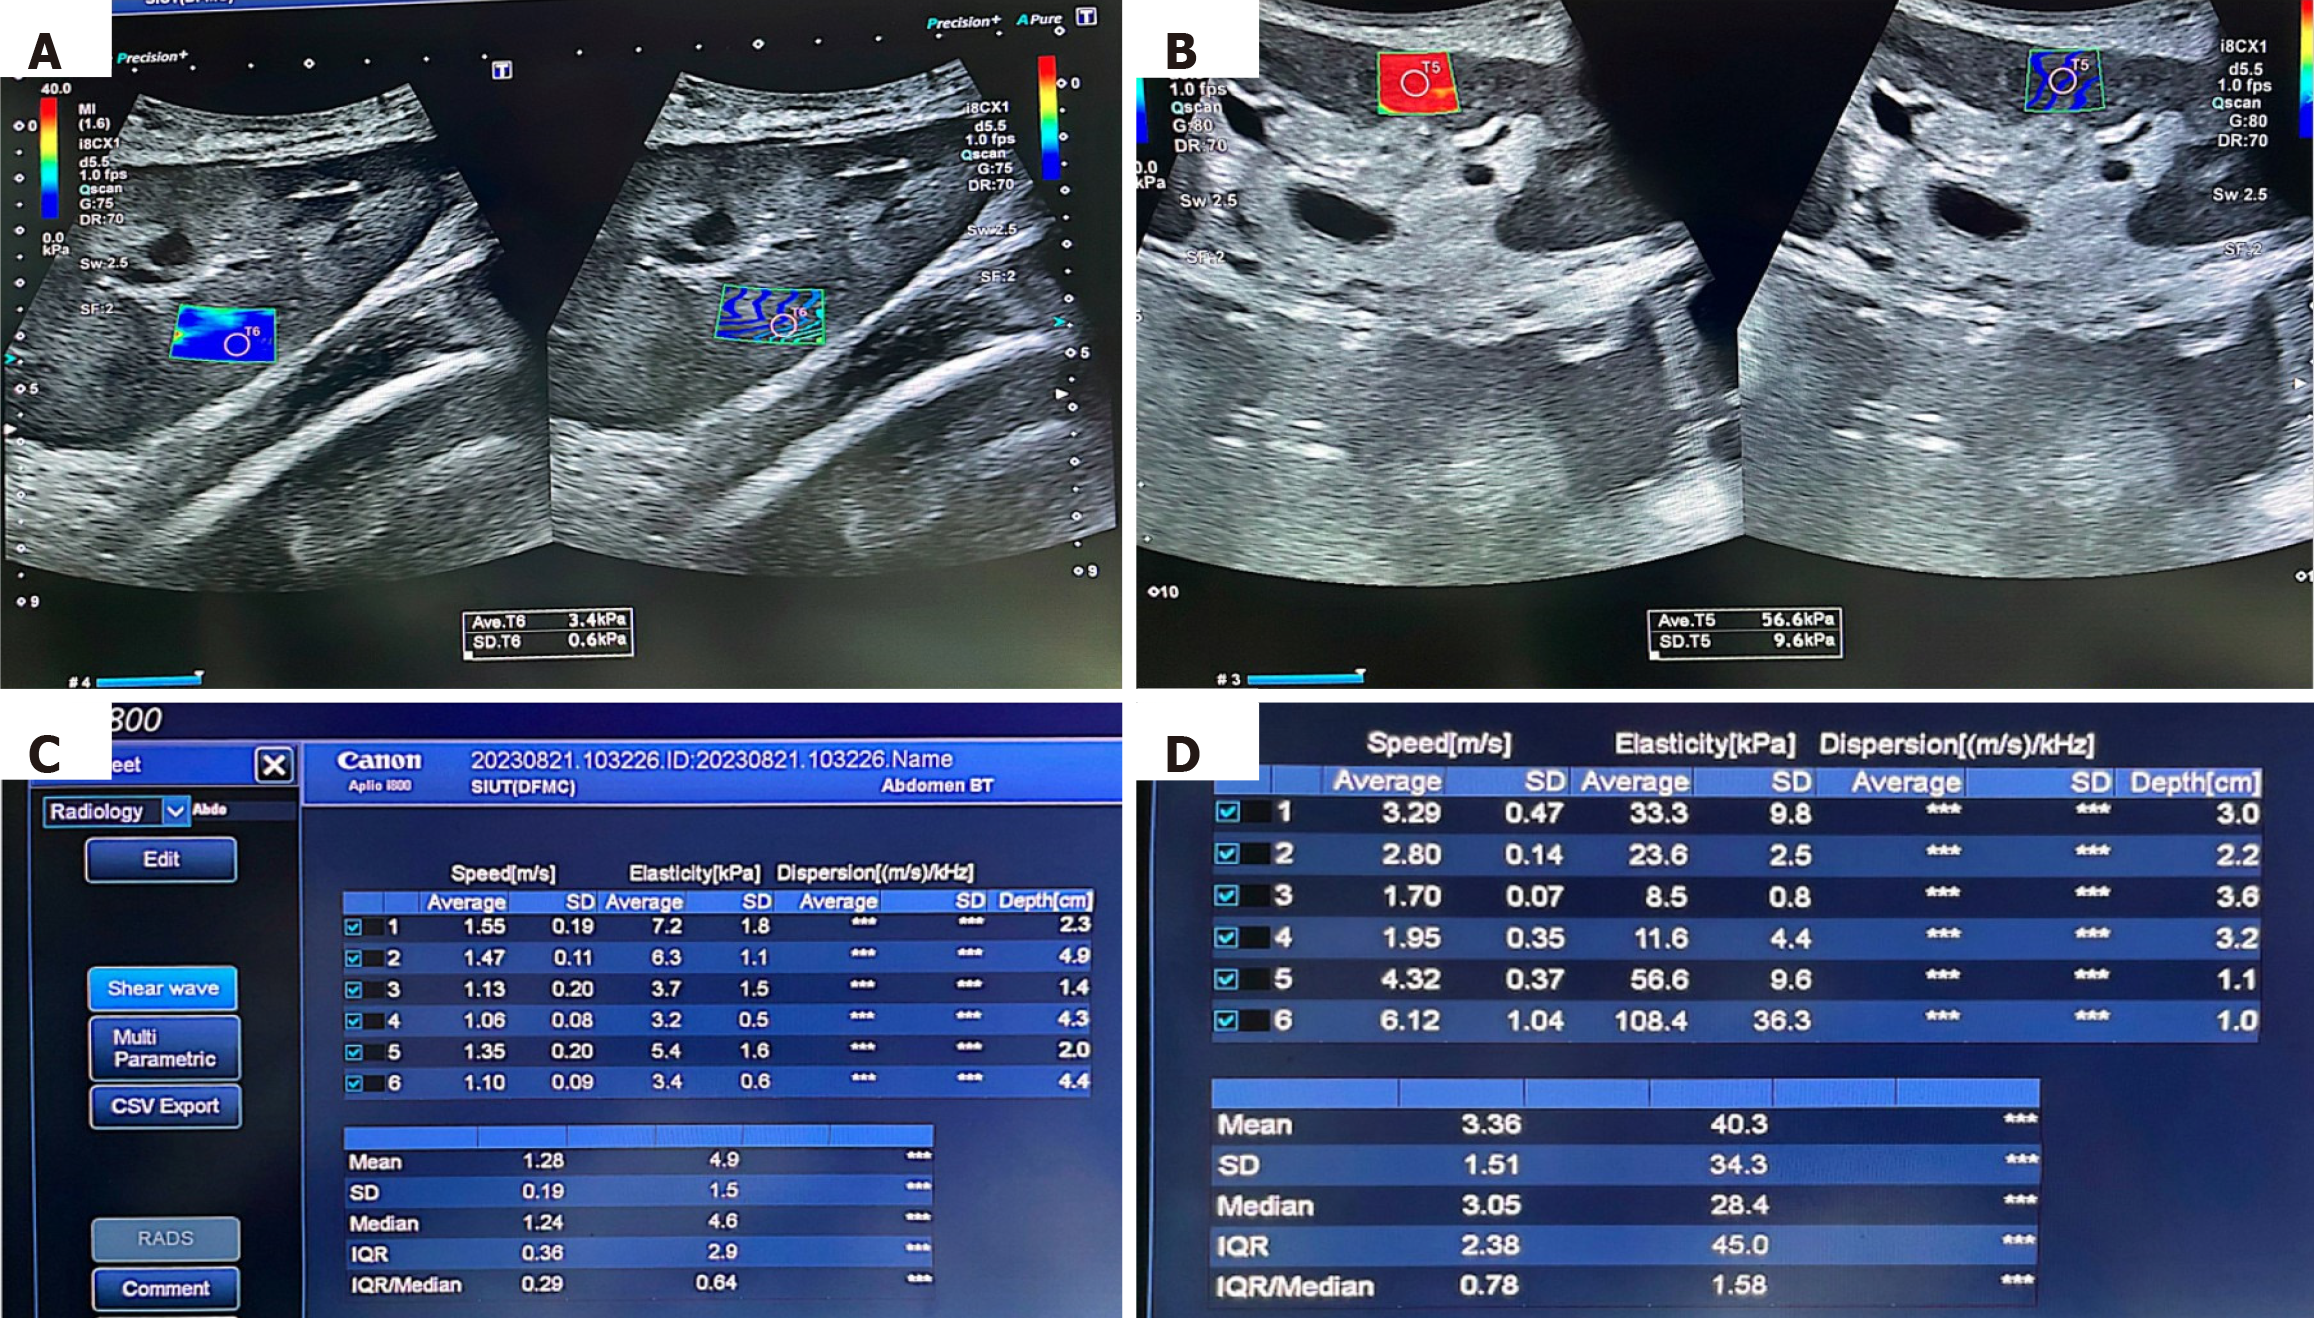
Figure 1 Shear wave elastography results from a case of stable graft function and with chronic kidney allograft dysfunction.
A: Shear wave elastography of the kidney graft parenchyma. Tissue elasticity is determined within the selected one region of interest and visually displayed as blue color; B: Shear wave elastography of the kidney graft parenchyma in this case is showing red colour which denotes increased tissue stiffness of the parenchyma; C: Quantitative report in kPa. The mean of the elasticity is 4.9 kPa, which is within the normal range; D: The quantitative value in kPa in this case is 40.3 kPa, which is clearly increased.
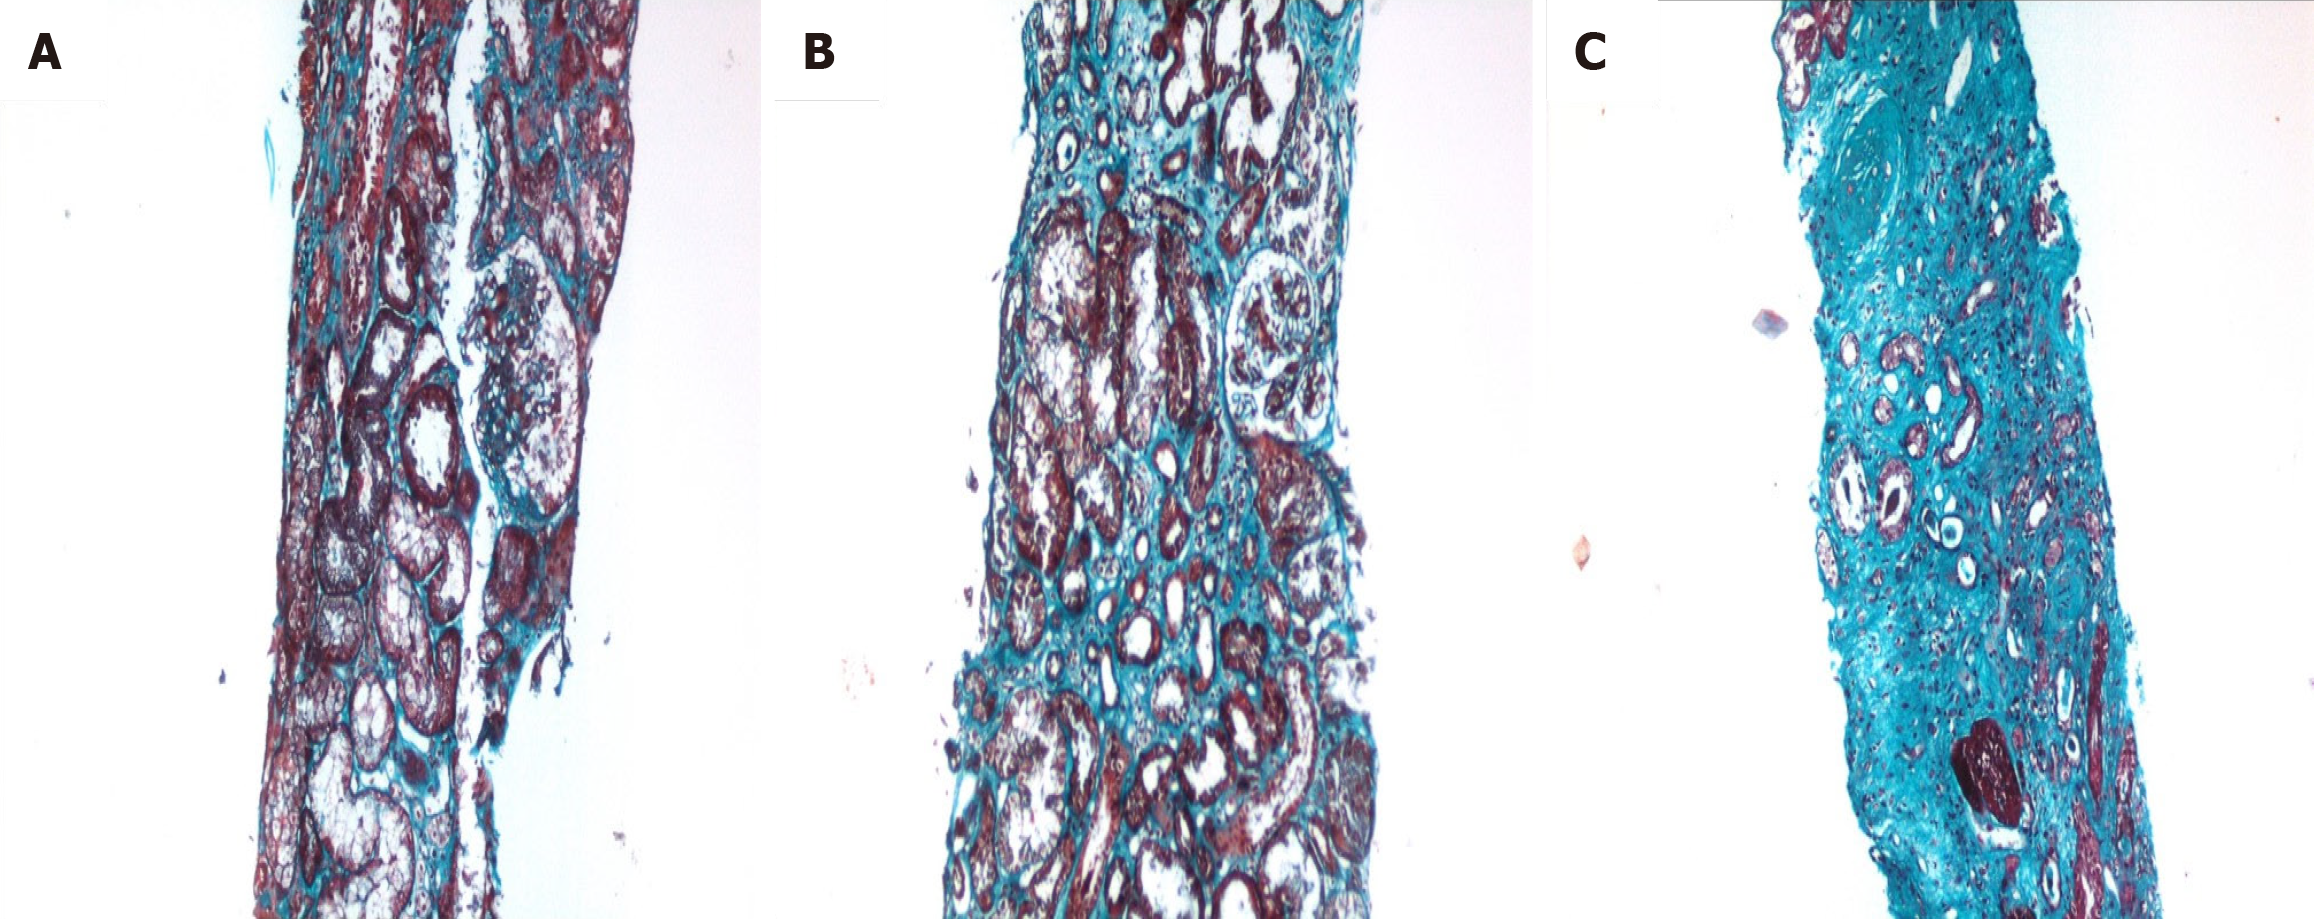
Figure 2 Histopathology results from allograft biopsies.
A: In this case, there is early deposition of blue collagen in between the tubules, which are showing only mild atrophy. One glomerulus included is intact (Trichrome stain, × 200); B: In this example, there is moderate amount of fibrous tissue in the graft parenchyma and moderate tubular atrophy. One glomerulus included is intact (Trichrome stain, × 200); C: In this case, there is severe tubular atrophy associated with severe interstitial fibrosis. The included glomerulus is globally sclerosed (Trichrome stain, × 200).
- Citation: Jesrani AK, Faiq SM, Rashid R, Kalwar TA, Mohsin R, Aziz T, Khan NA, Mubarak M. Comparison of resistive index and shear-wave elastography in the evaluation of chronic kidney allograft dysfunction. World J Transplant 2024; 14(1): 89255
- URL: https://www.wjgnet.com/2220-3230/full/v14/i1/89255.htm
- DOI: https://dx.doi.org/10.5500/wjt.v14.i1.89255


