©The Author(s) 2024.
World J Transplant. Mar 18, 2024; 14(1): 88891
Published online Mar 18, 2024. doi: 10.5500/wjt.v14.i1.88891
Published online Mar 18, 2024. doi: 10.5500/wjt.v14.i1.88891
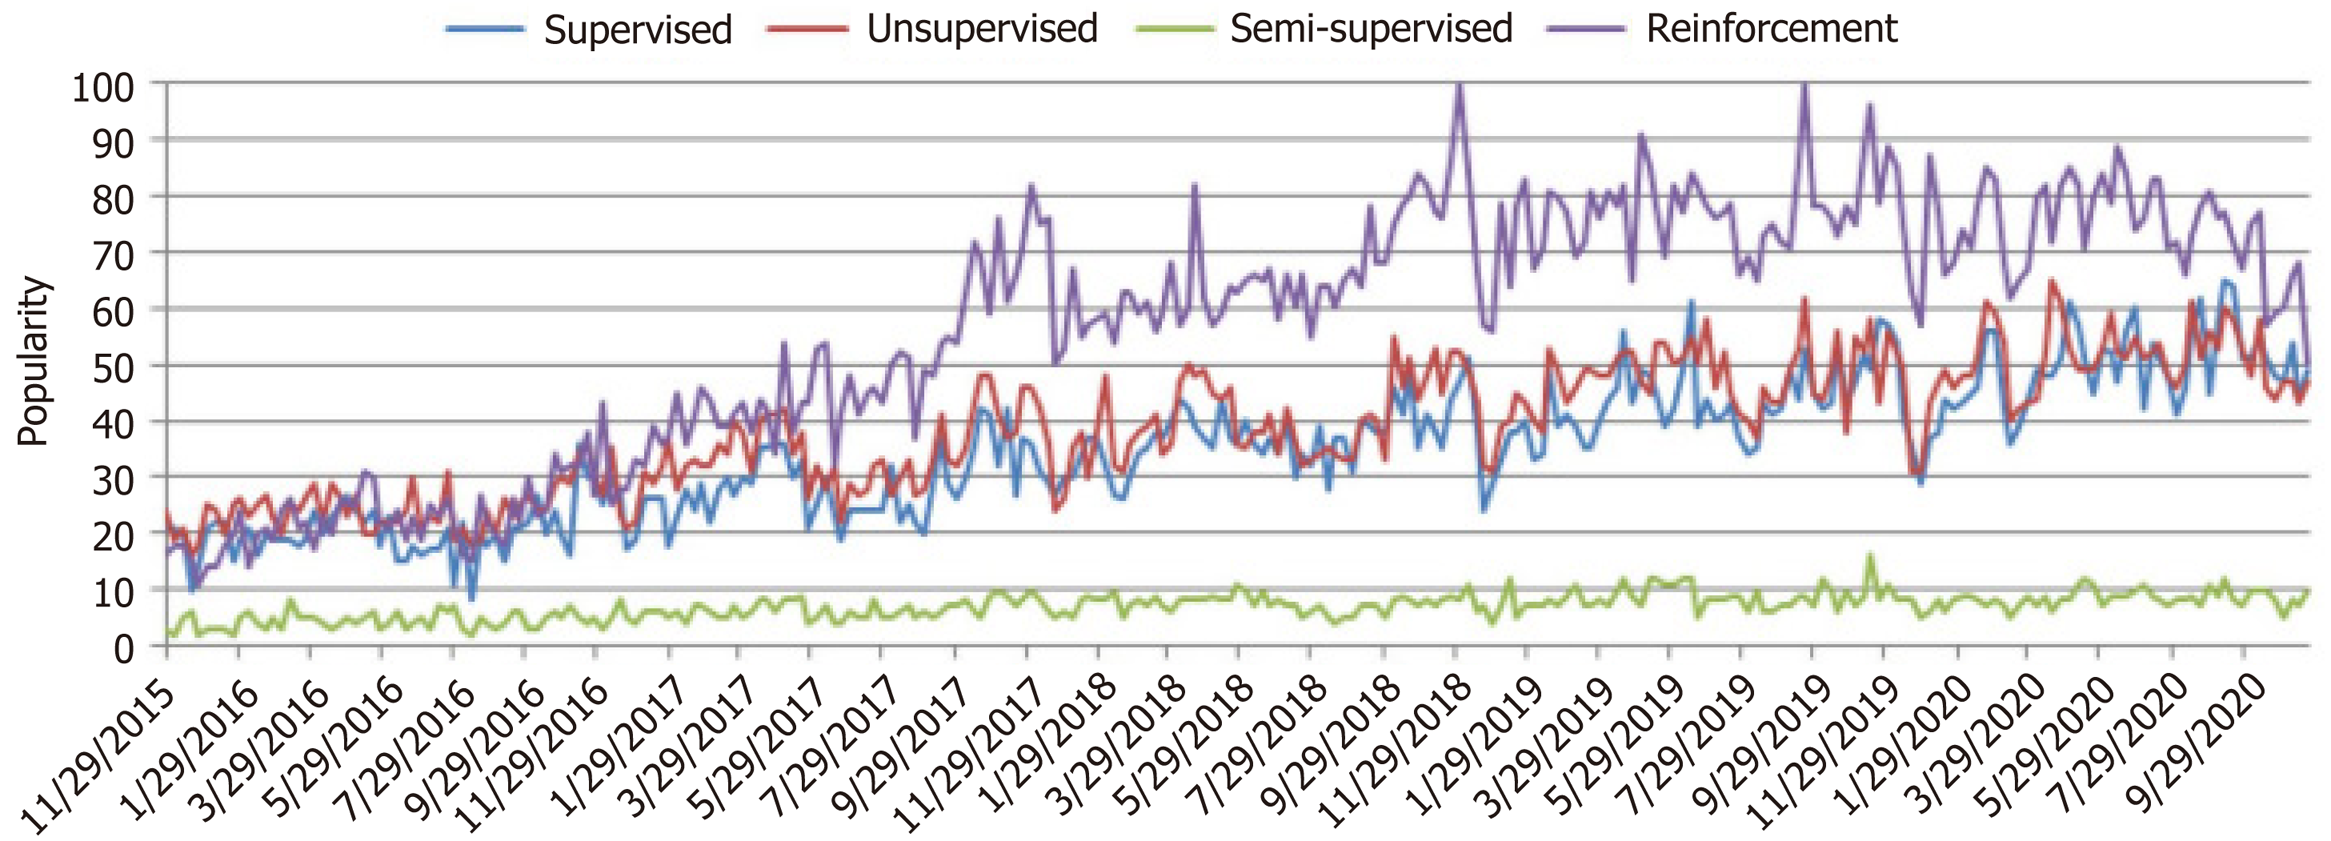
Figure 1 Machine learning popularity: Worldwide popularity score of different types of machine learning algorithms.
Popularity scores range from 0 (minimum) to 100 (maximum) and are plotted against the timestamp information on the x-axis. The y-axis represents the corresponding popularity score[44]. Citation: Sarker IH. Machine Learning: Algorithms, Real-World Applications and Research Directions. SN Comput Sci 2021; 2: 160. Copyright ©The Author(s) 2021. Published by Springer Nature.
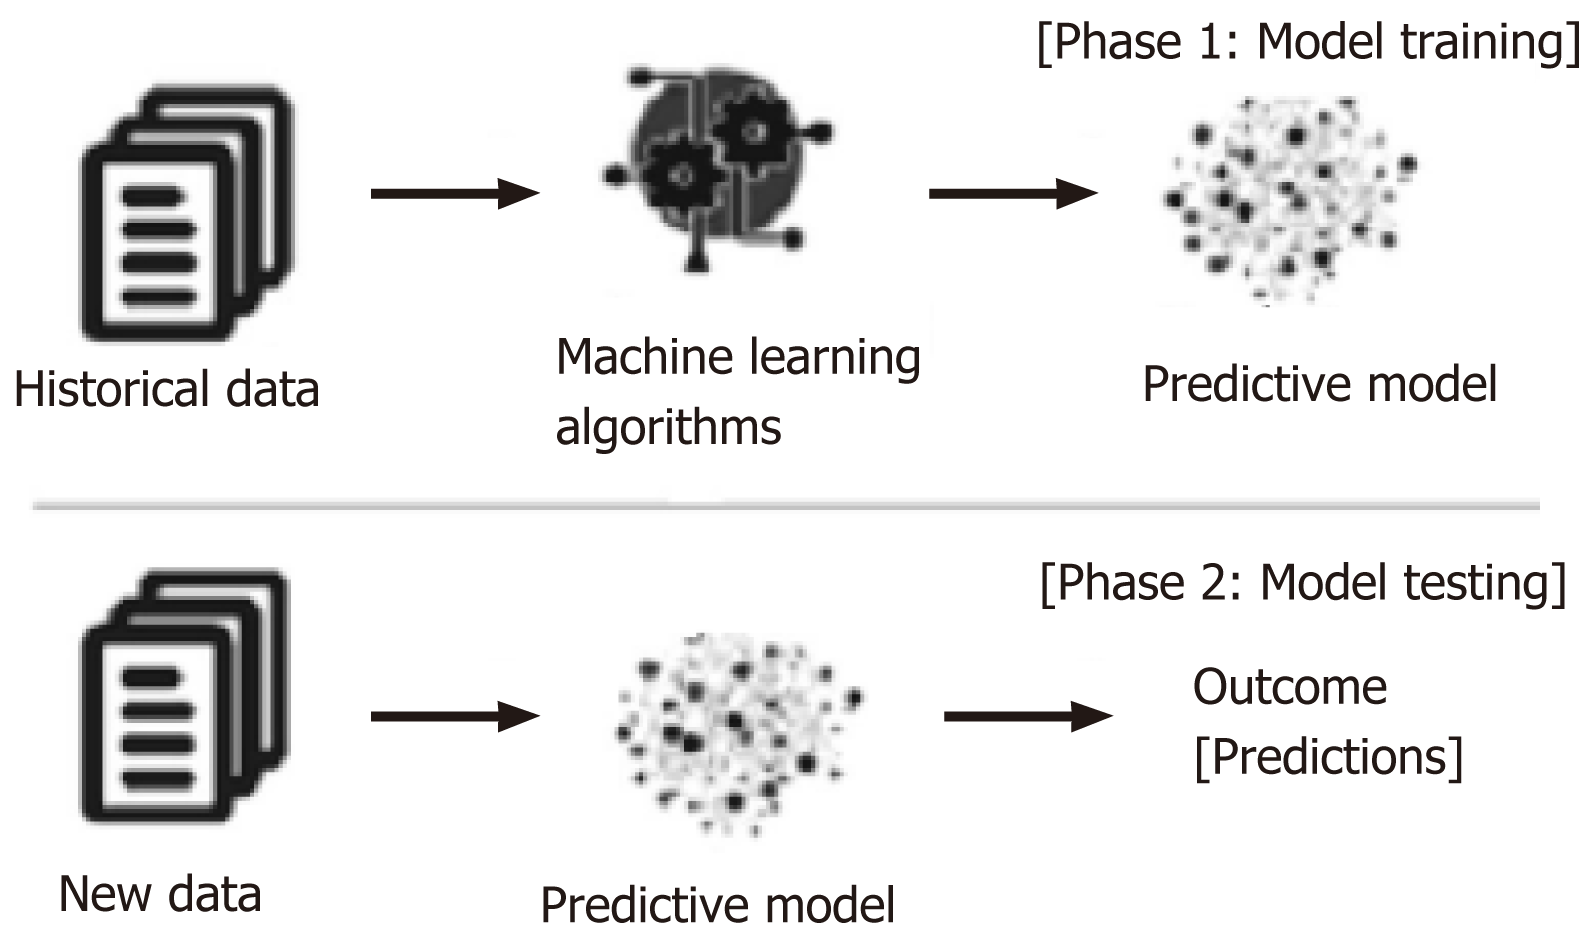
Figure 2 Basic machine learning model: Process of training and testing in machine learning[44].
Citation: Sarker IH. Machine Learning: Algorithms, Real-World Applications and Research Directions. SN Comput Sci 2021; 2: 160. Copyright ©The Author(s) 2021. Published by Springer Nature.
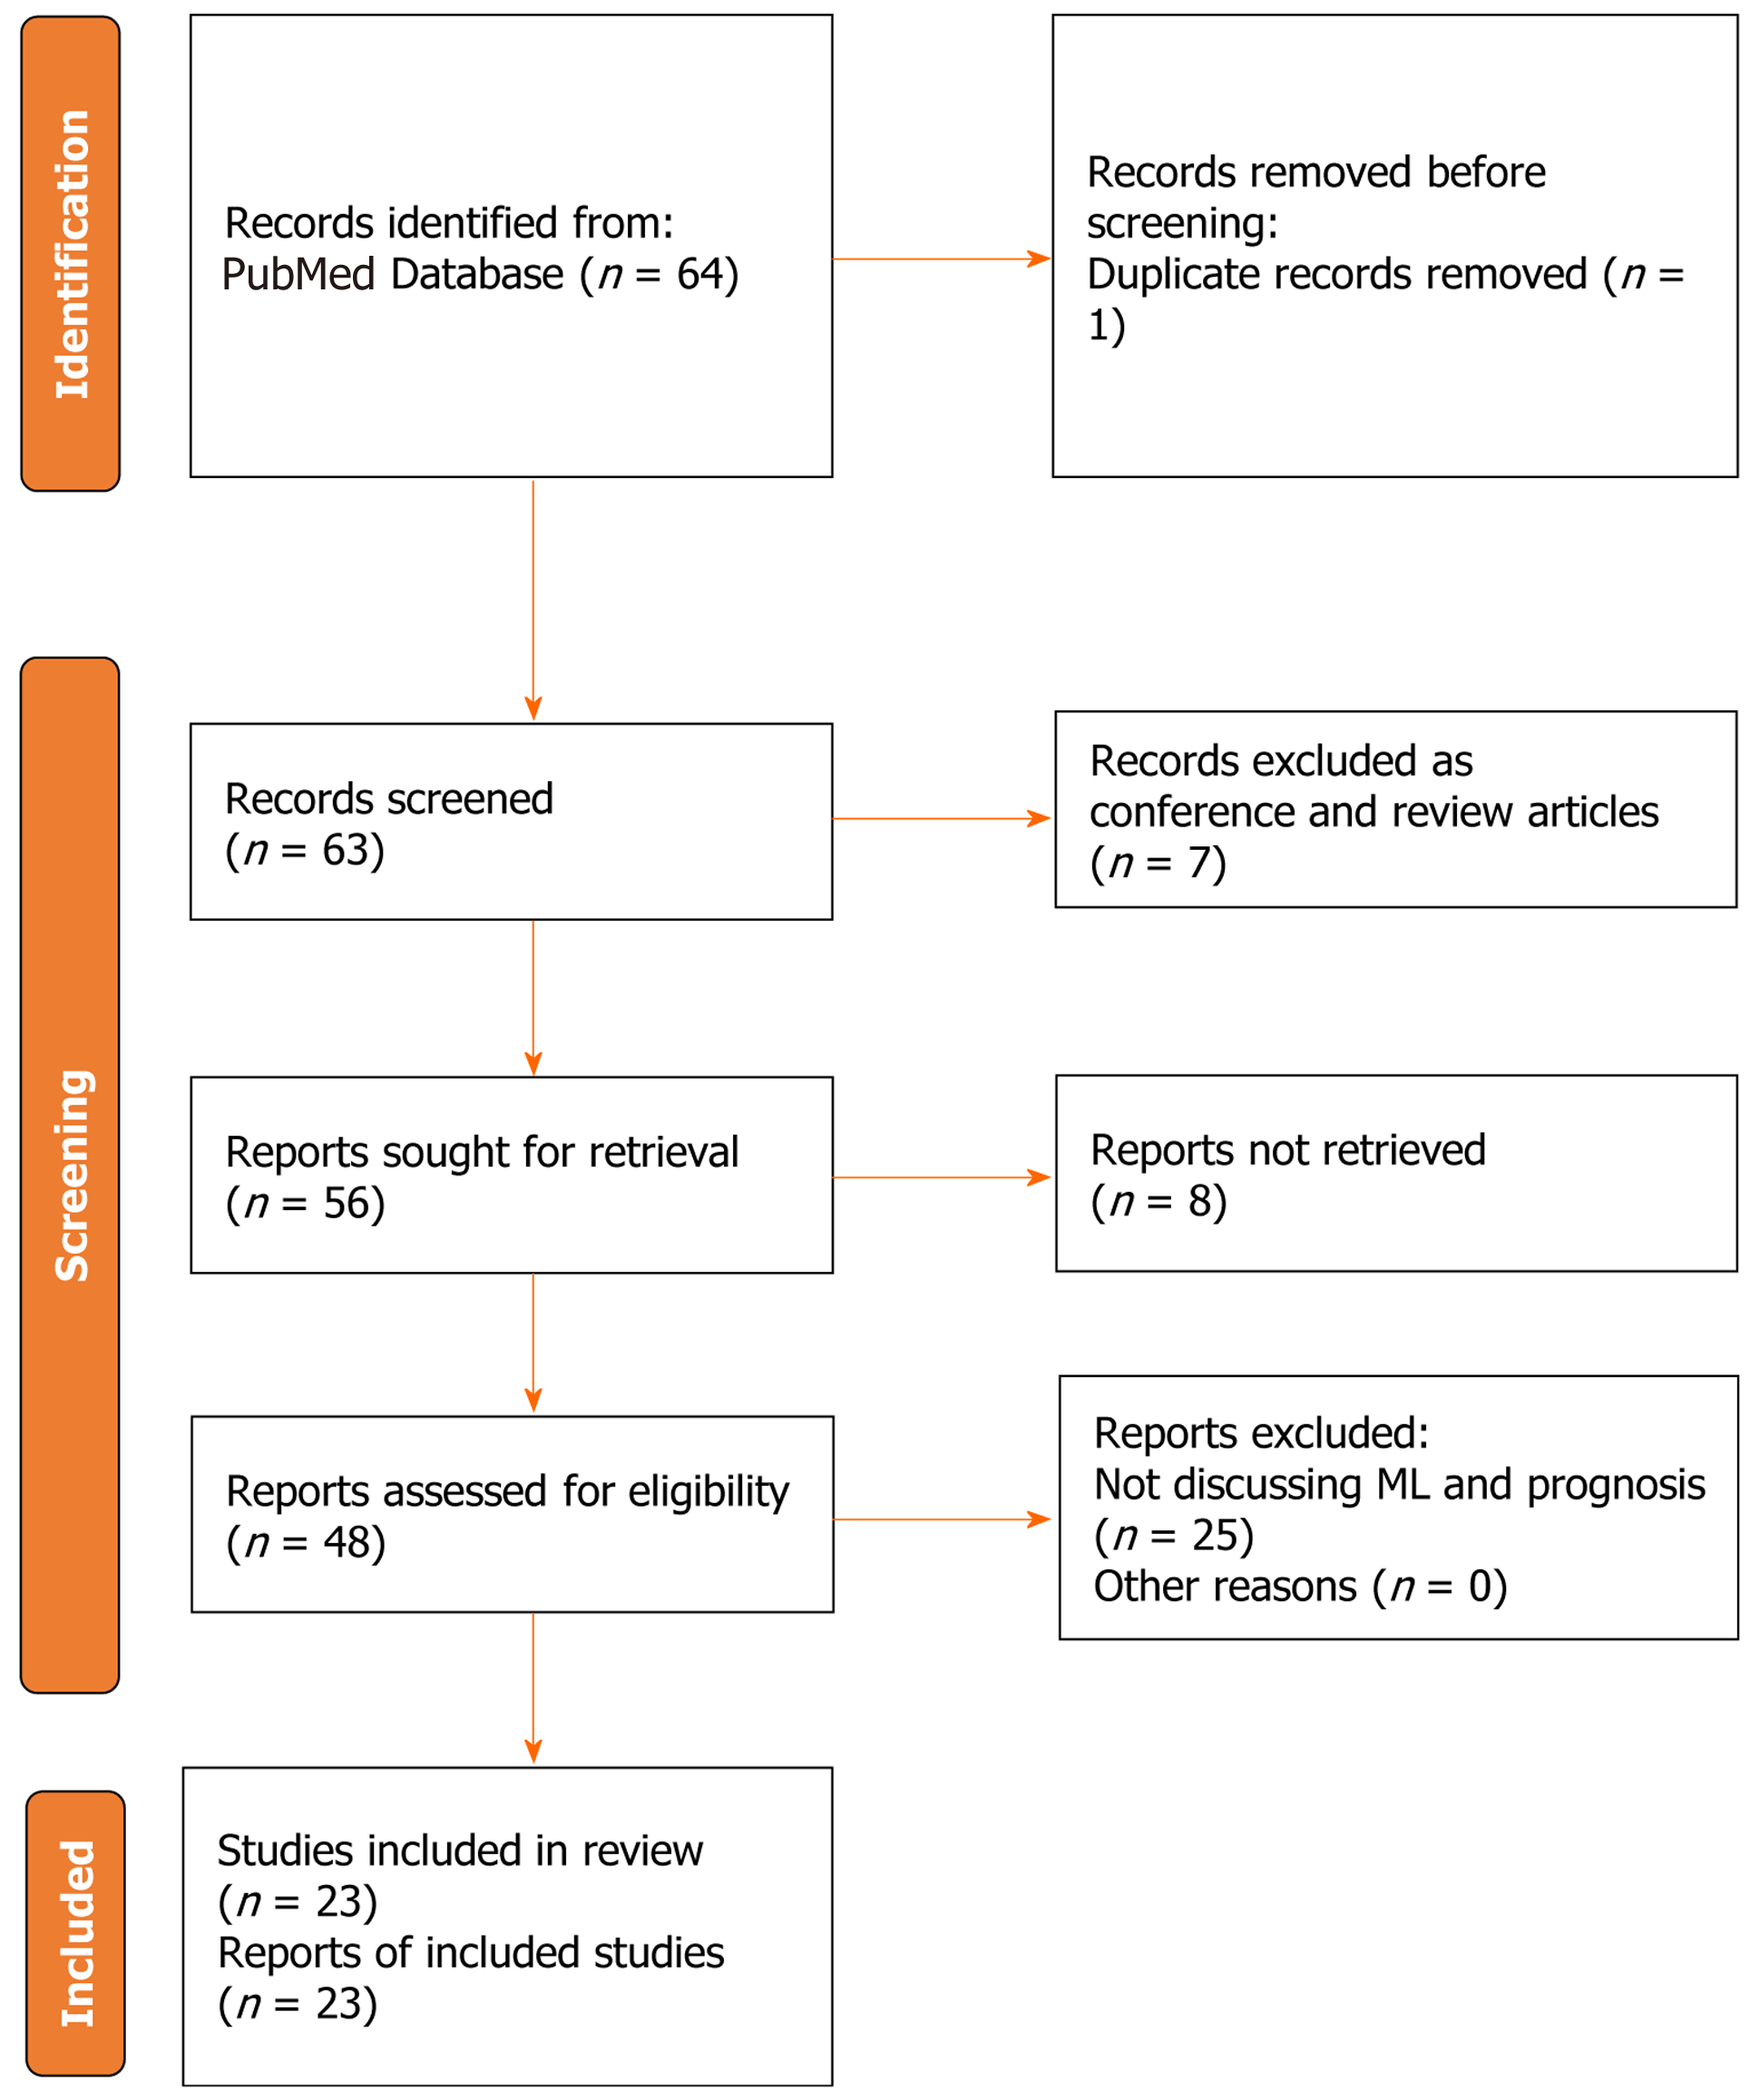
Figure 3 PRISMA flow chart of the selection process.
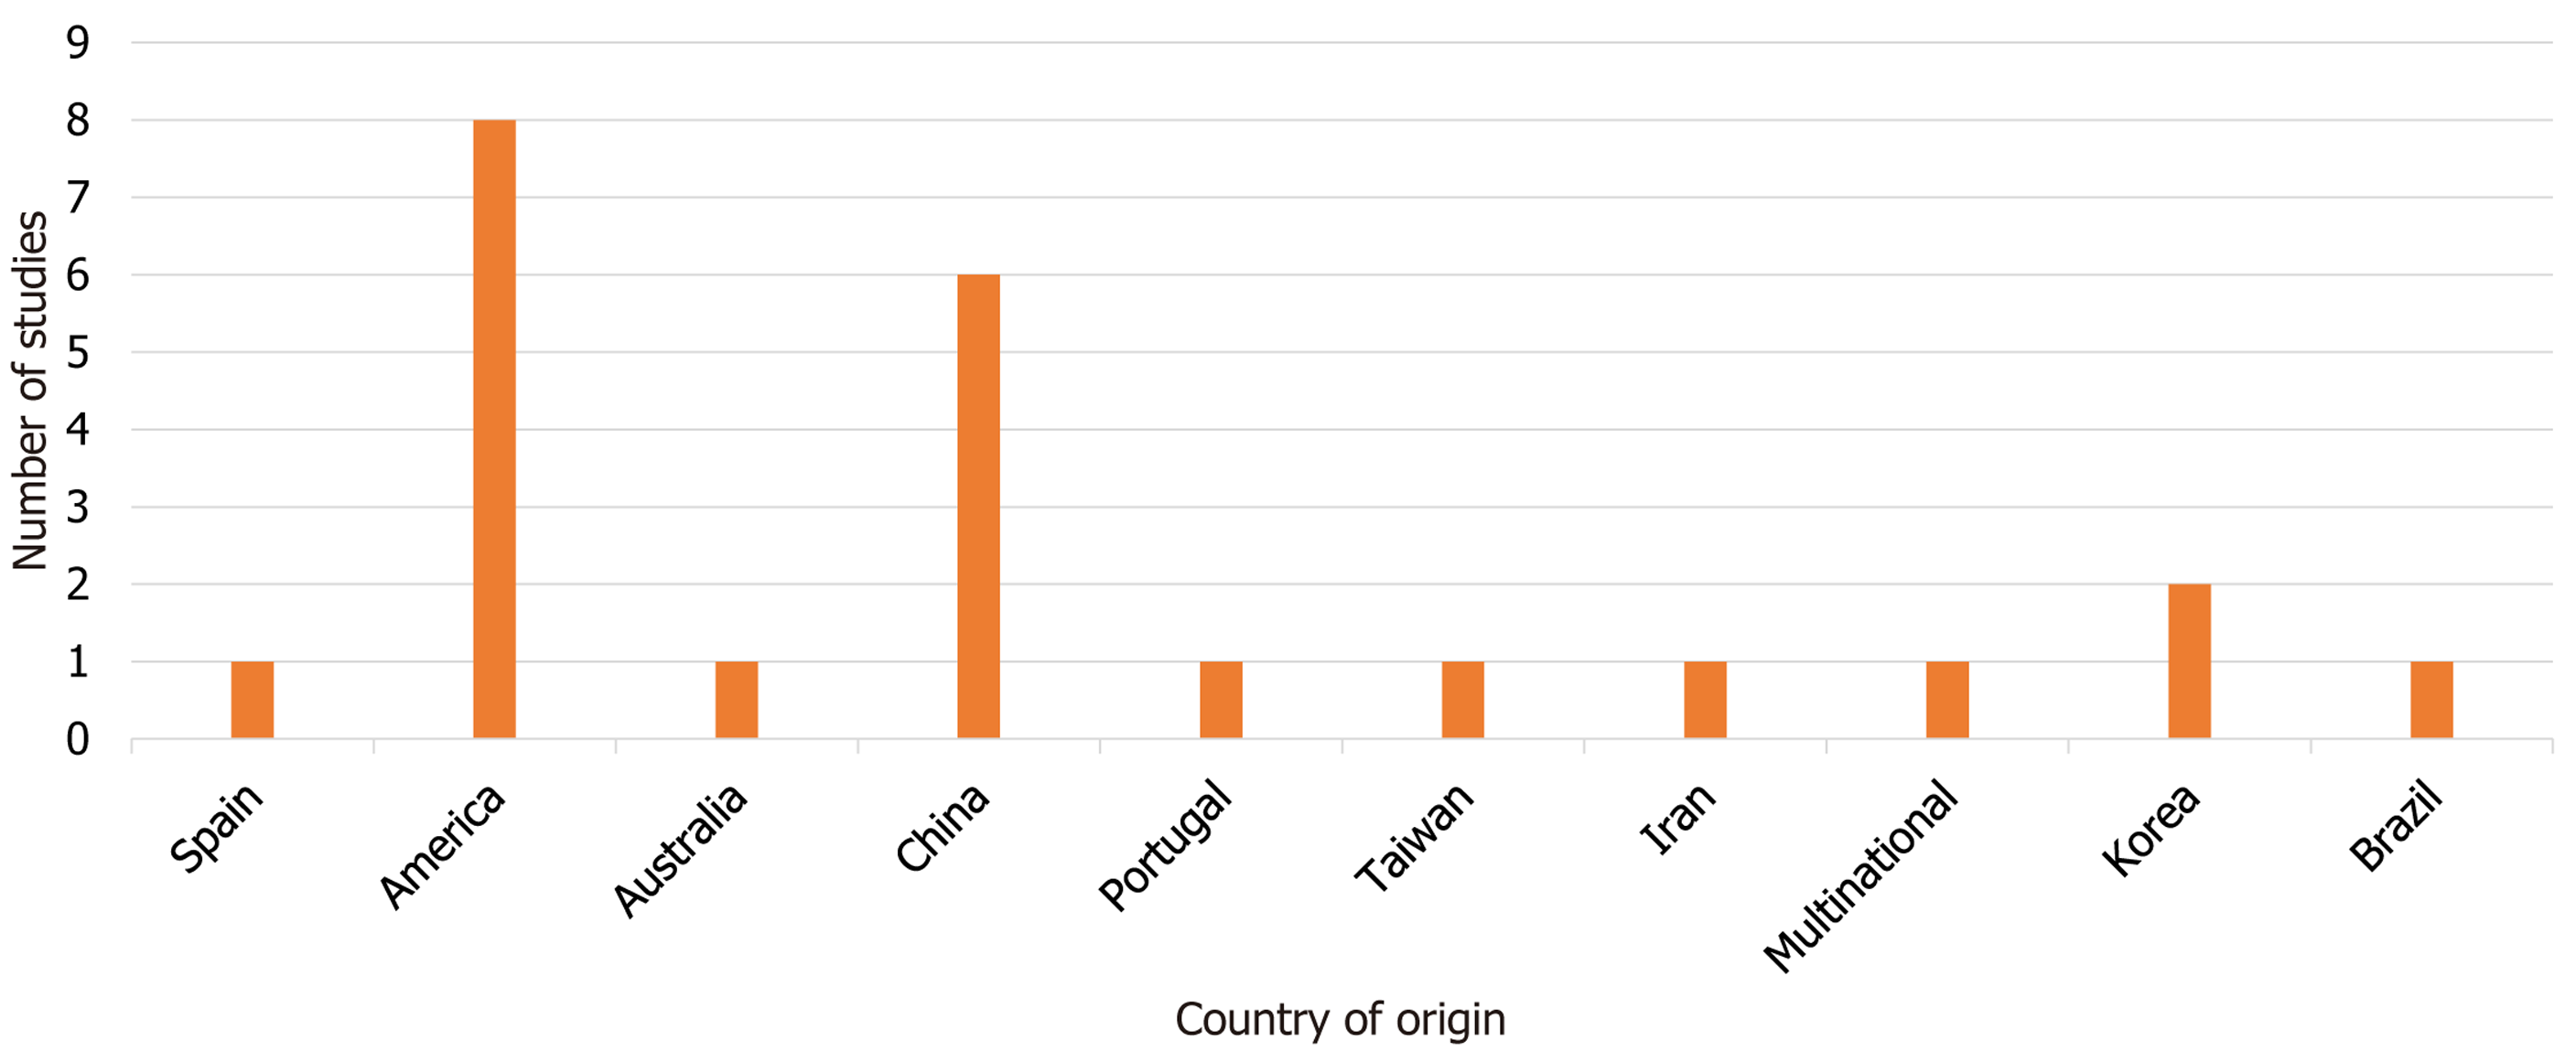
Figure 4 Countries that published machine learning studies related to liver transplantation and prognosis extracted from literature over the study period.
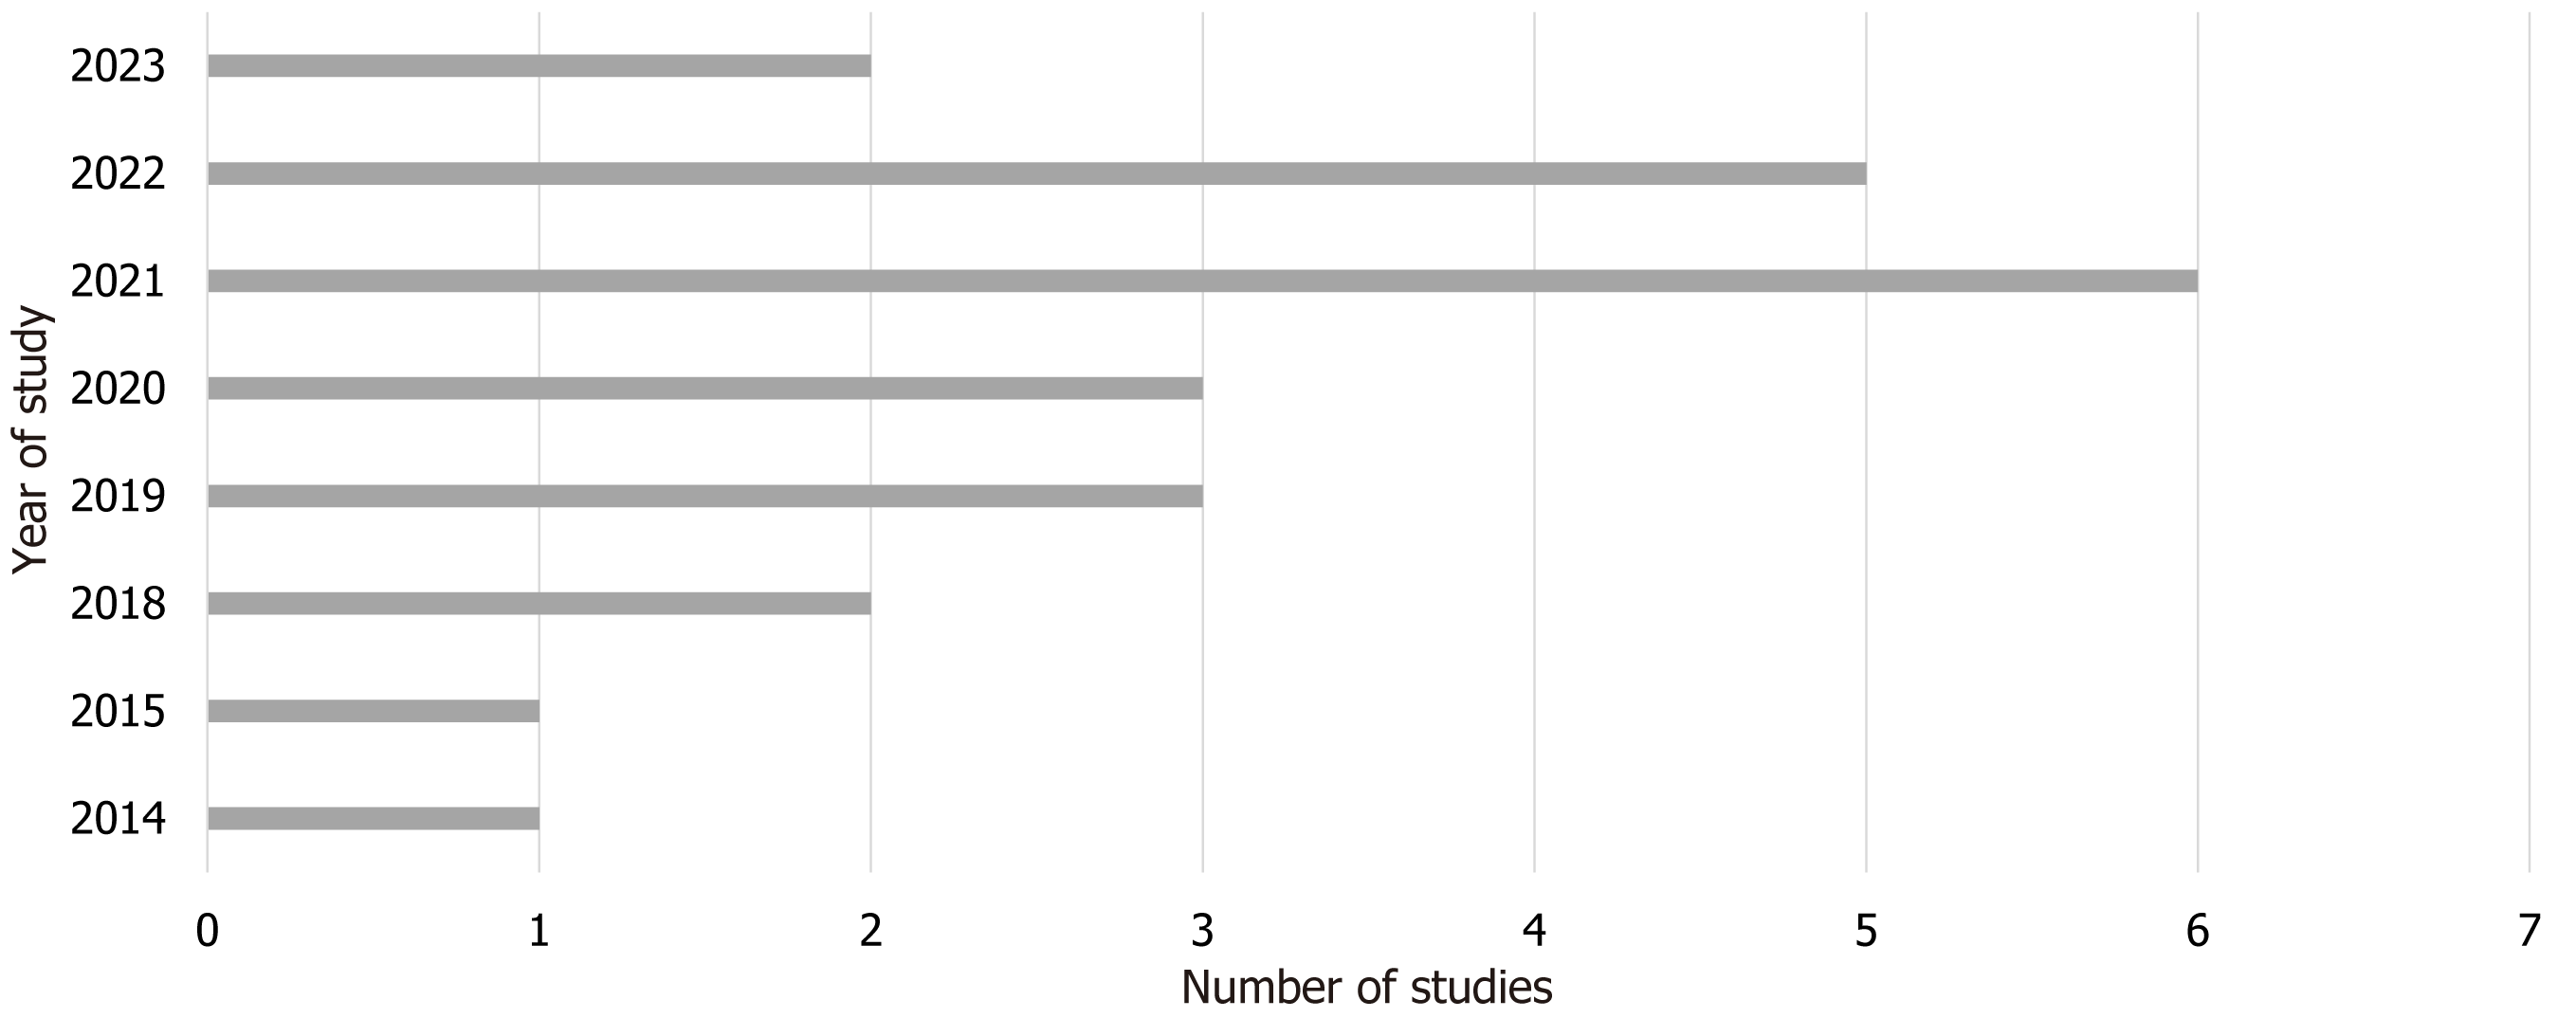
Figure 5 Increase in machine learning studies related to liver transplantation and prognosis in the past 5 years.
- Citation: Chongo G, Soldera J. Use of machine learning models for the prognostication of liver transplantation: A systematic review. World J Transplant 2024; 14(1): 88891
- URL: https://www.wjgnet.com/2220-3230/full/v14/i1/88891.htm
- DOI: https://dx.doi.org/10.5500/wjt.v14.i1.88891


