Copyright
©The Author(s) 2023.
World J Transplant. Dec 18, 2023; 13(6): 379-390
Published online Dec 18, 2023. doi: 10.5500/wjt.v13.i6.379
Published online Dec 18, 2023. doi: 10.5500/wjt.v13.i6.379
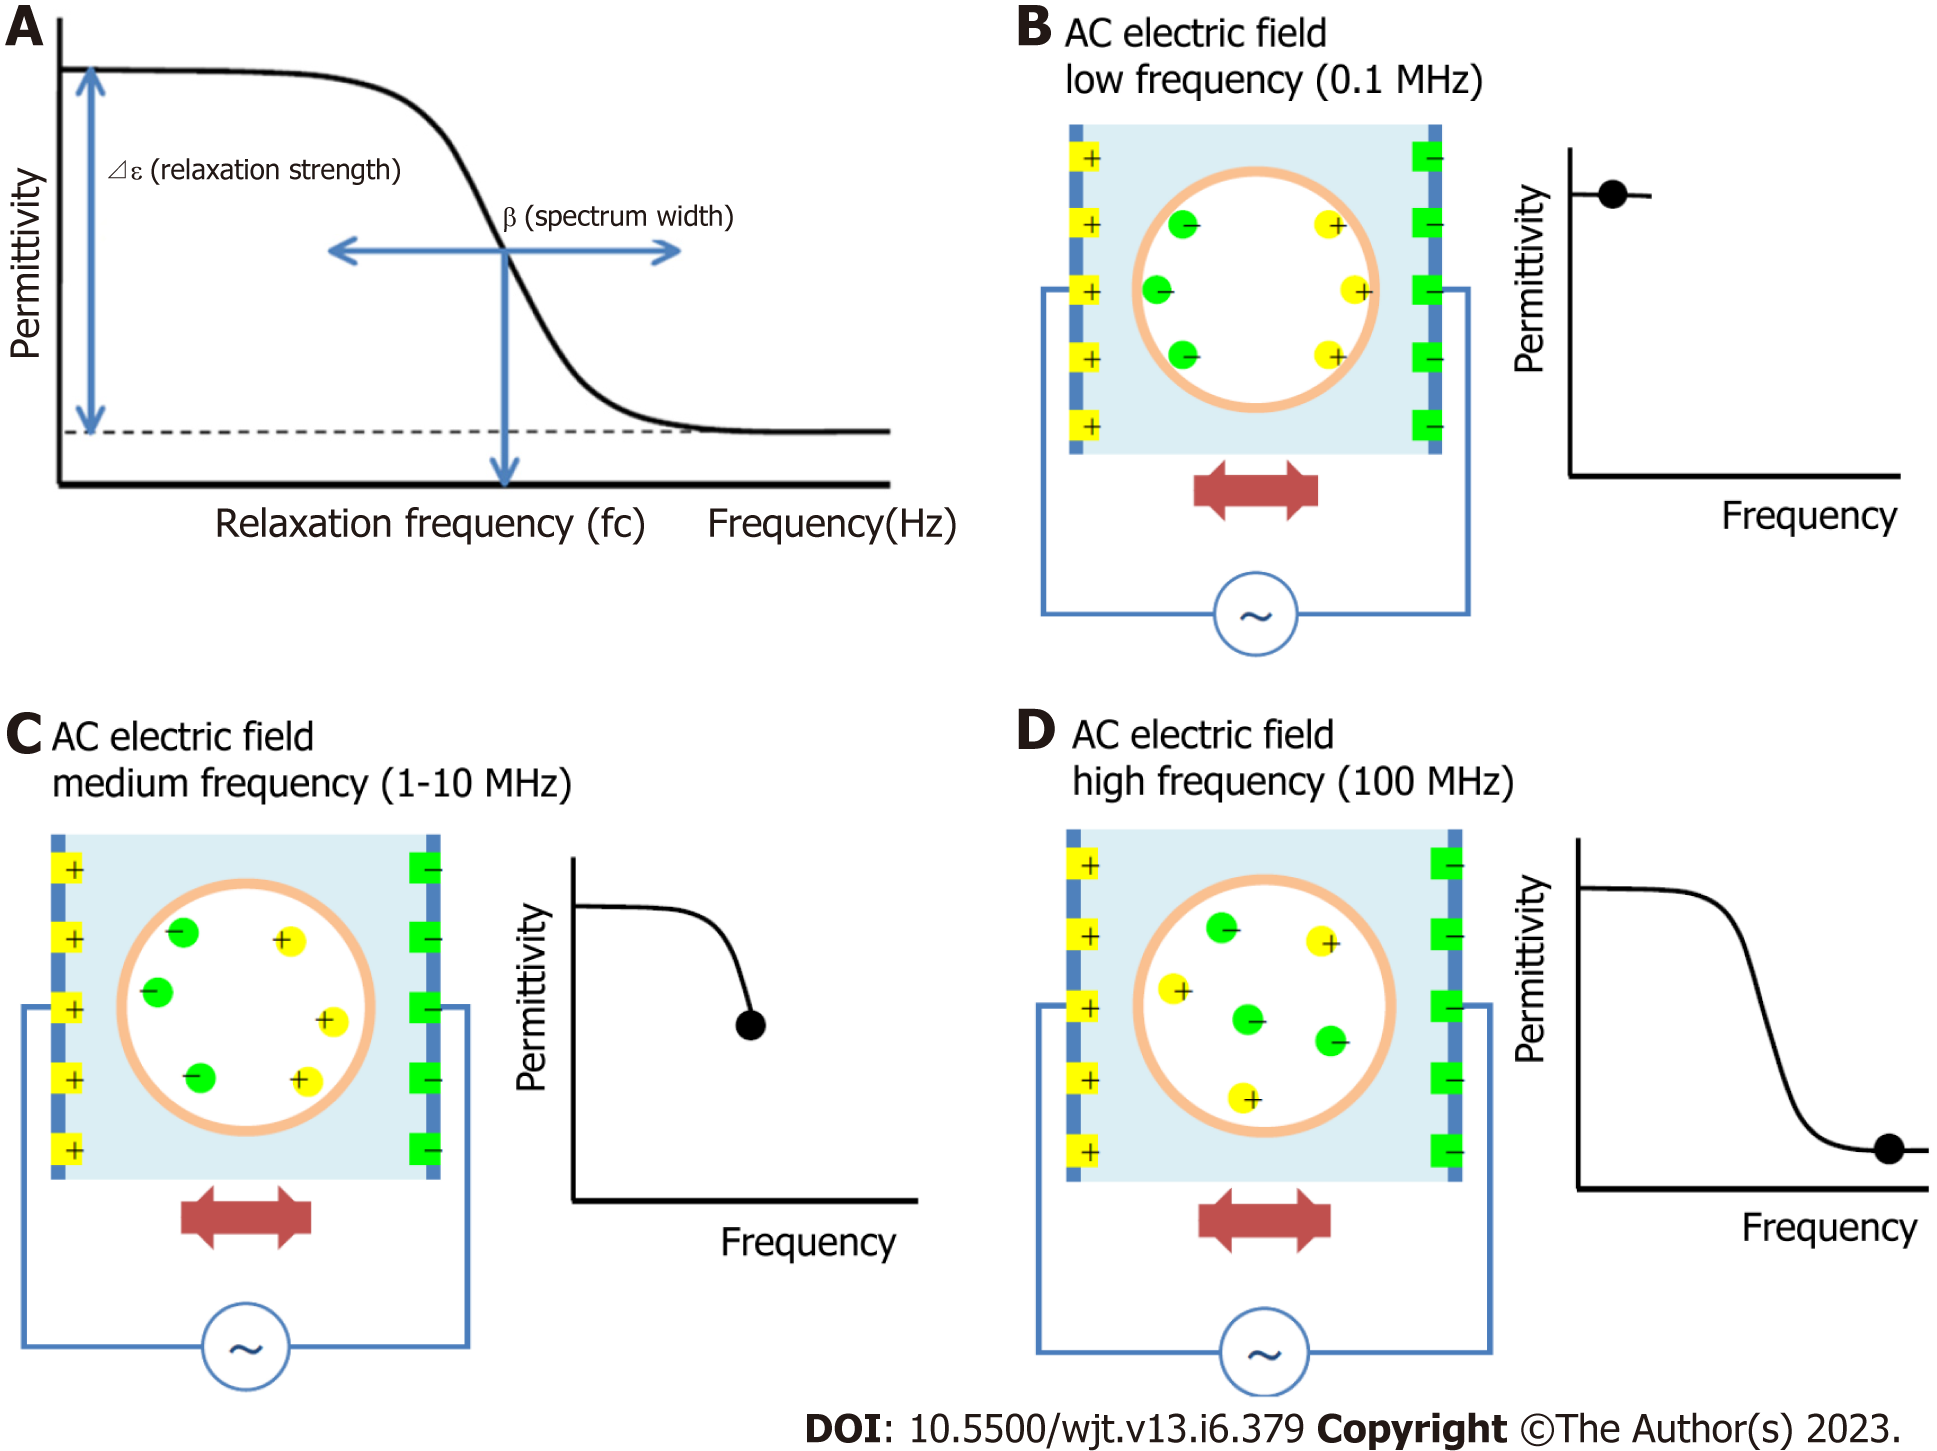
Figure 1 The principle of the dielectric measurement of whole blood is displayed.
A: Brief description of dielectric parameters; B: Sufficient ionization is achieved when a low frequency alternating voltage is applied; C: As the frequency of the AC voltage increases, the ionization cannot keep up with the frequency, and the dielectric strength gradually decreases; D: When the frequency of the AC voltage exceeds a certain level, no dielectric occurs and the dielectric strength stabilizes at a low value.
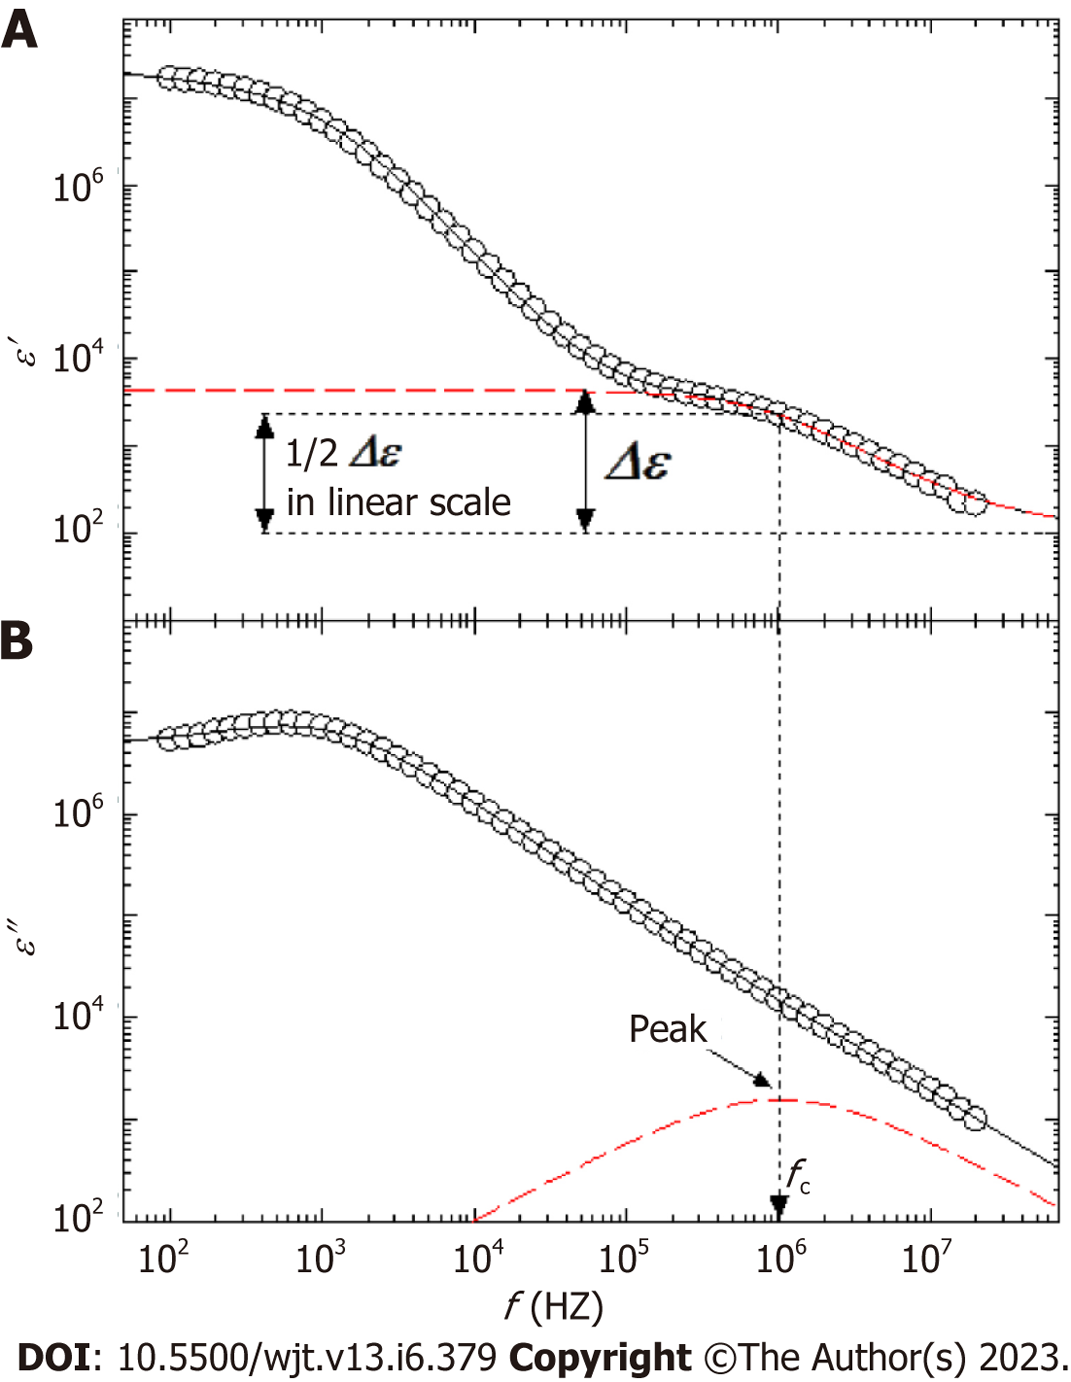
Figure 2 Understanding of the dielectric relaxation of whole blood, which is consist of plasma and blood cells.
A: Shows the real part; B: The imaginary part of the complex permittivity. The broken red lines are the result of an analysis of the interfacial polarization phenomenon according to a Cole−Cole type dielectric relaxation function. This function is characterized by the relaxation strength Δε corresponding to changes in ε′ (A) and the relaxation frequency fc that corresponds to the peak of this function observed in the imaginary part of permittivity, ε″ (B). The curved lines in the figure are the sum of all the assumed contributions in the analysis, and agree well with the experimental values.
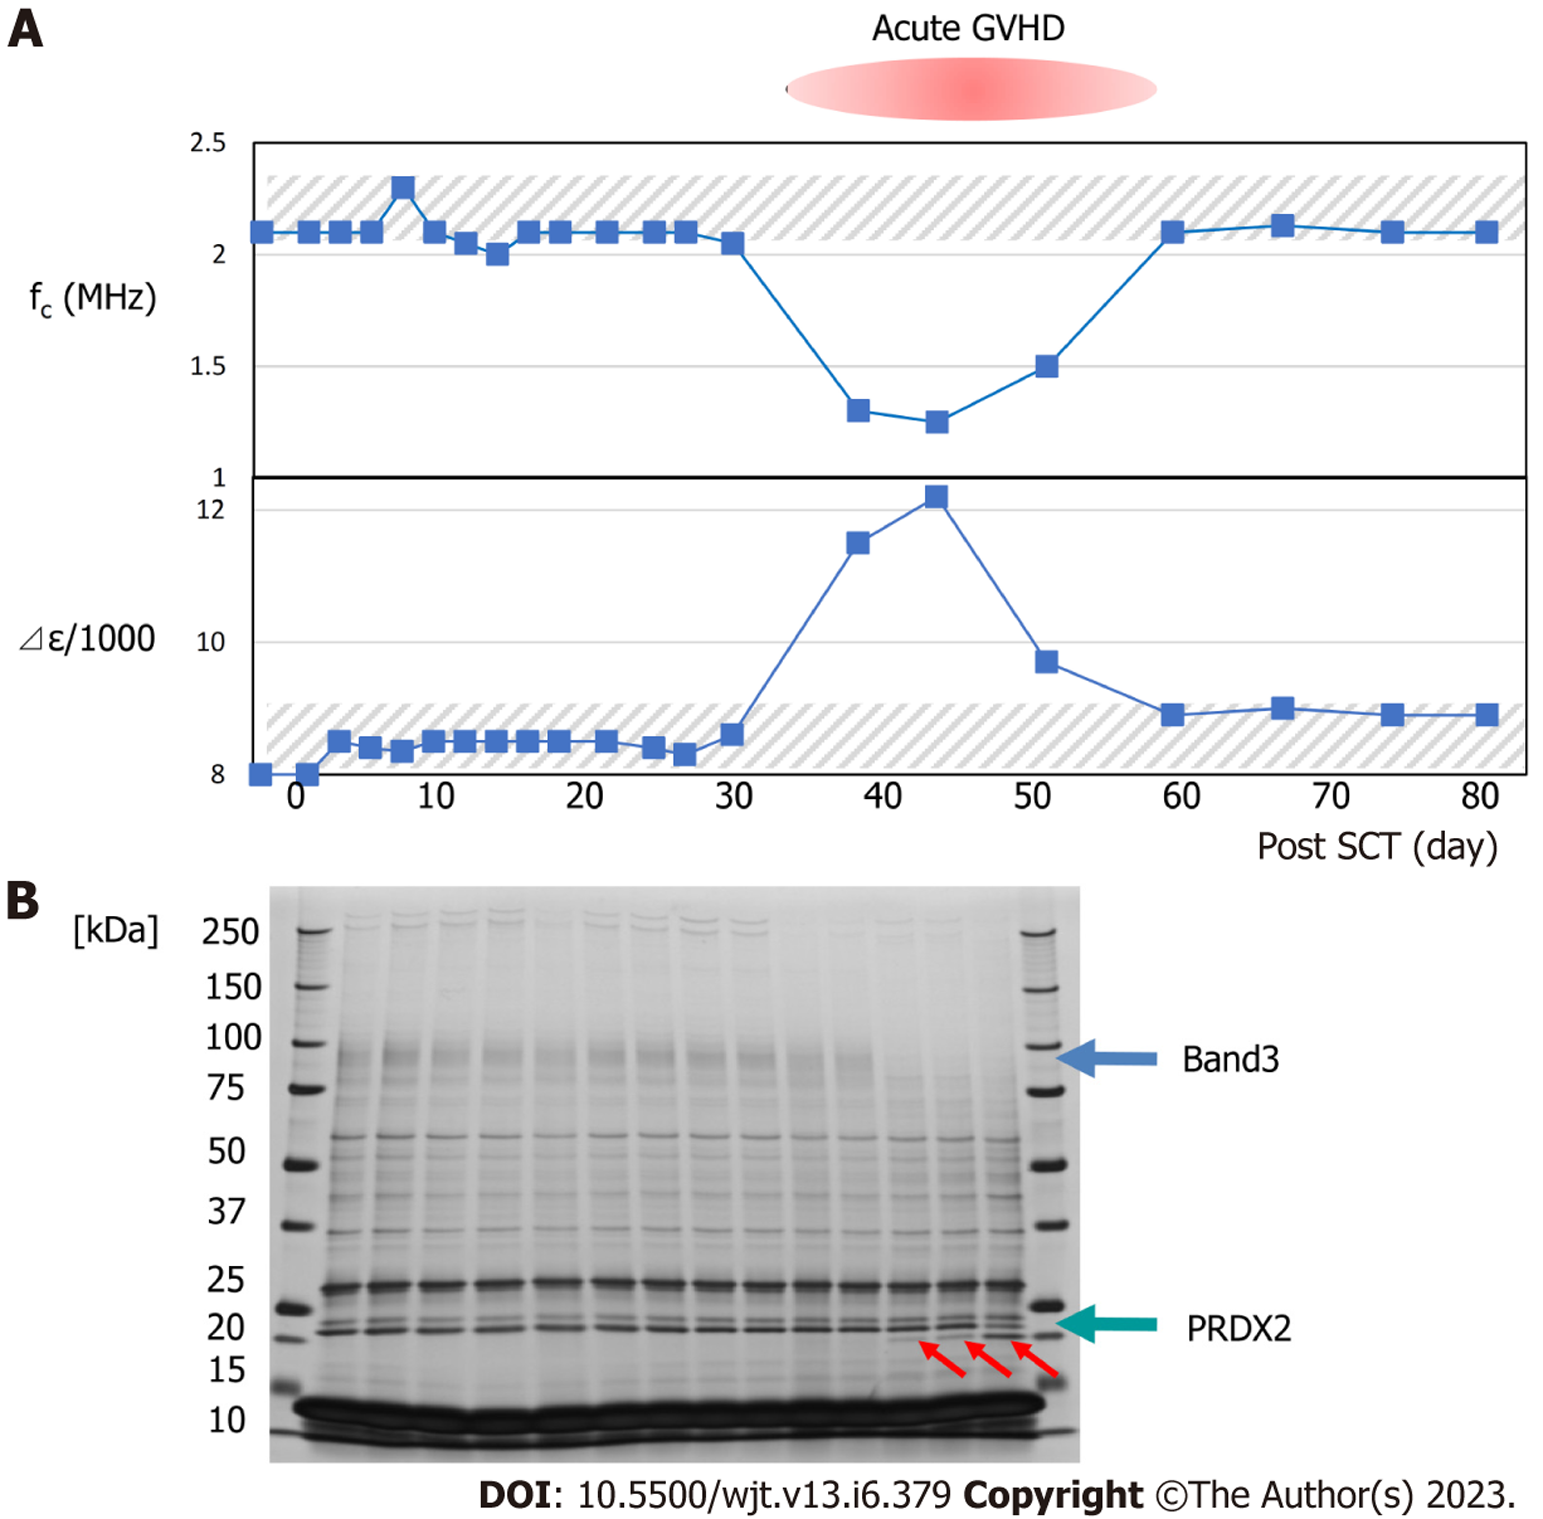
Figure 3 Changes in the relaxation frequency and relaxation intensity of whole blood after transplantation in a transplant patient who developed severe graft-versus-host disease during the course.
A: The hatched area indicates the normal range of relaxation frequency and relaxation intensity; B: The figure below shows the results of sodium dodecyl sulfate-polyacrylamide gel electrophoresis of erythrocyte proteins over time. Consistent with graft-versus-host disease, there is a decrease in band3 and the appearance of a 20KDa band (red arrows). The 20KDa band was found to be the C-terminal deleted PRDX2[37]. GVHD: Graft-versus-host disease.
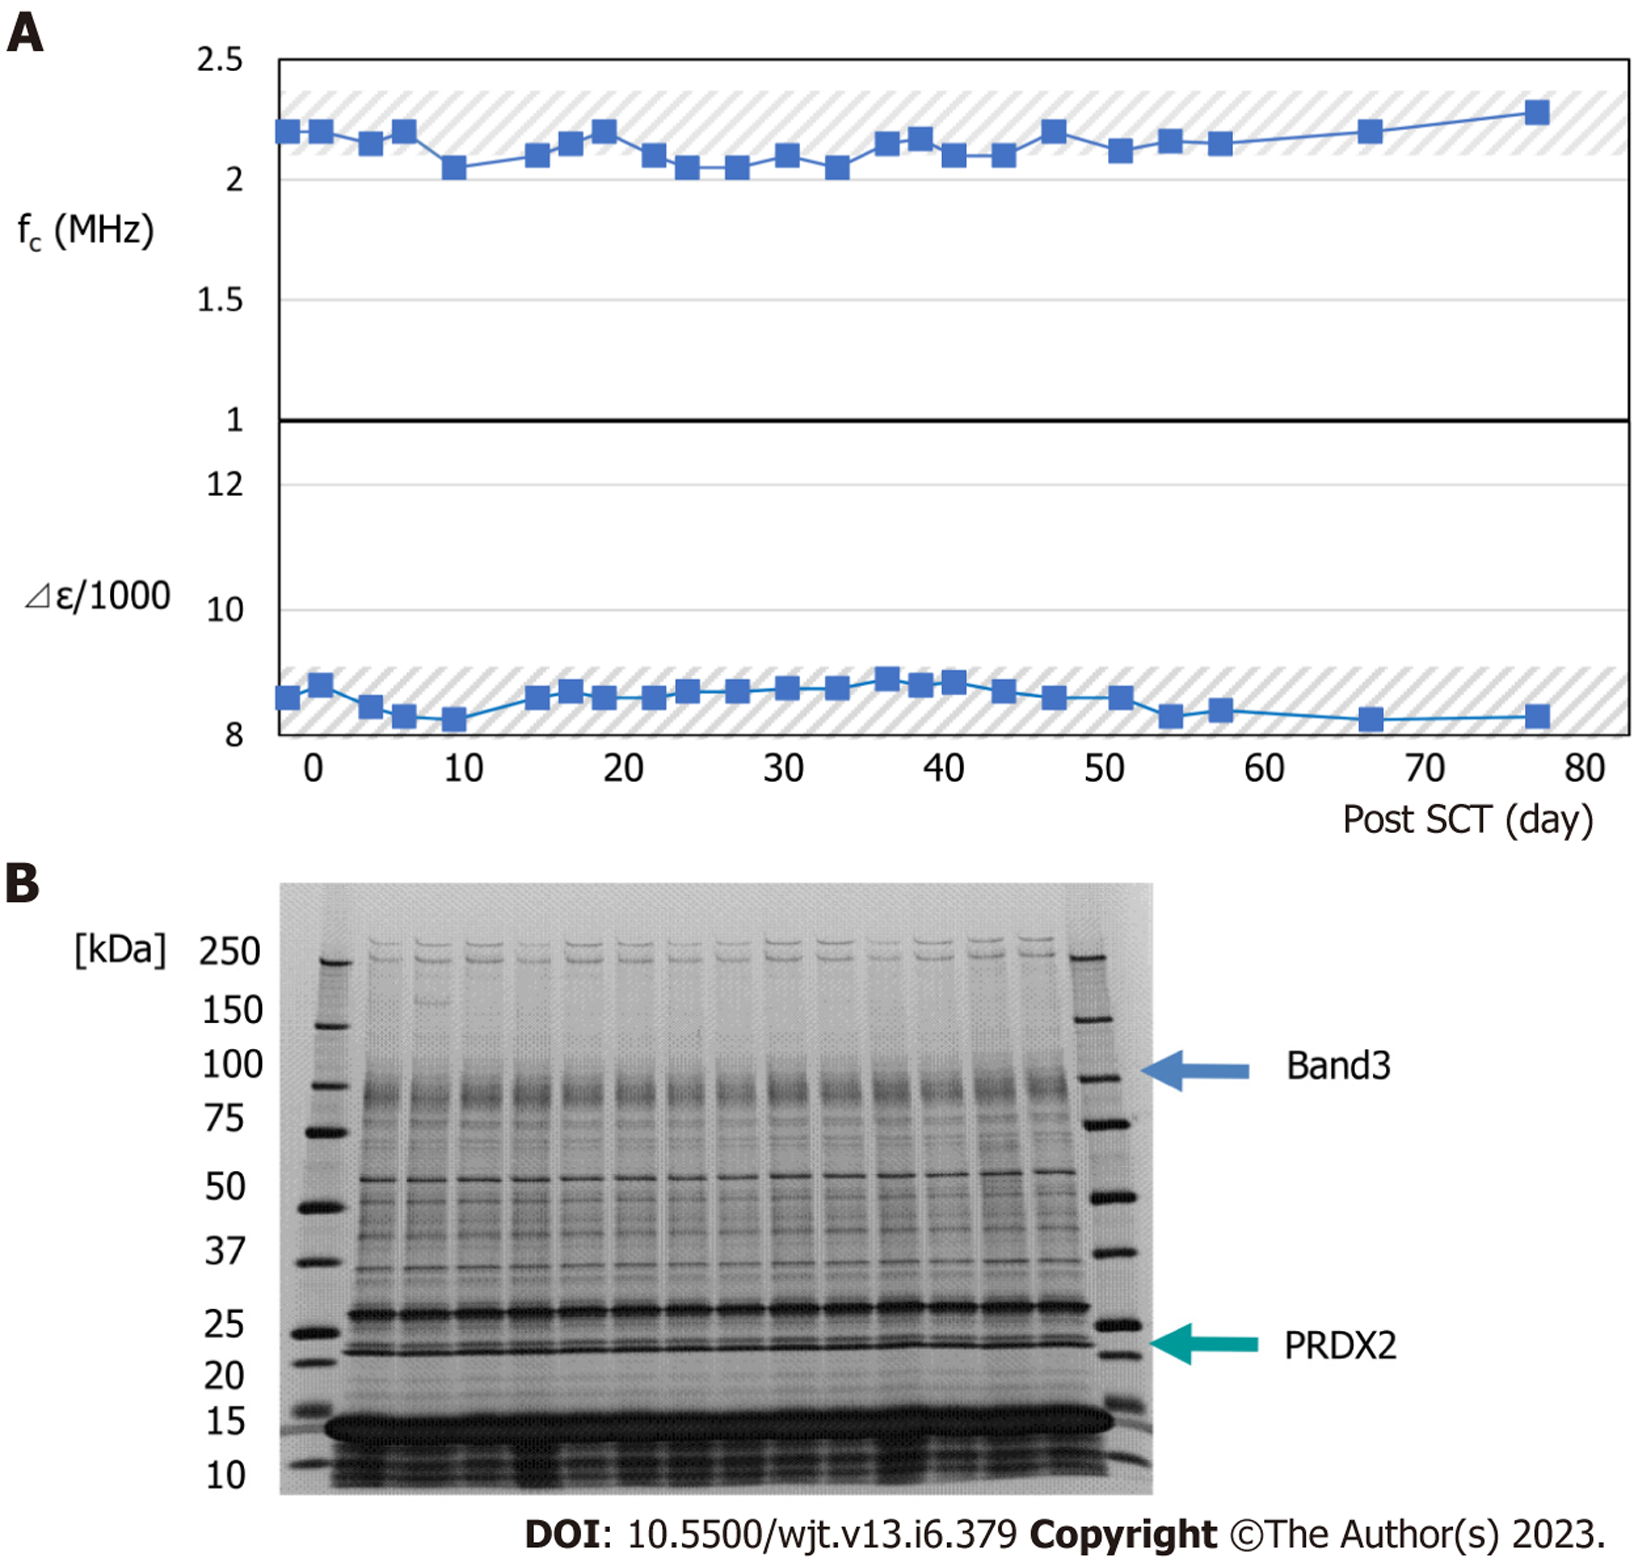
Figure 4 Changes in the relaxation frequency and relaxation intensity of whole blood after transplantation in a transplant patient who developed no graft-versus-host disease during the course.
A: The hatched area indicates the normal range of relaxation frequency and relaxation intensity; B: The figure below shows the results of sodium dodecyl sulfate-polyacrylamide gel electrophoresis of erythrocyte proteins over time. There was no significant change.
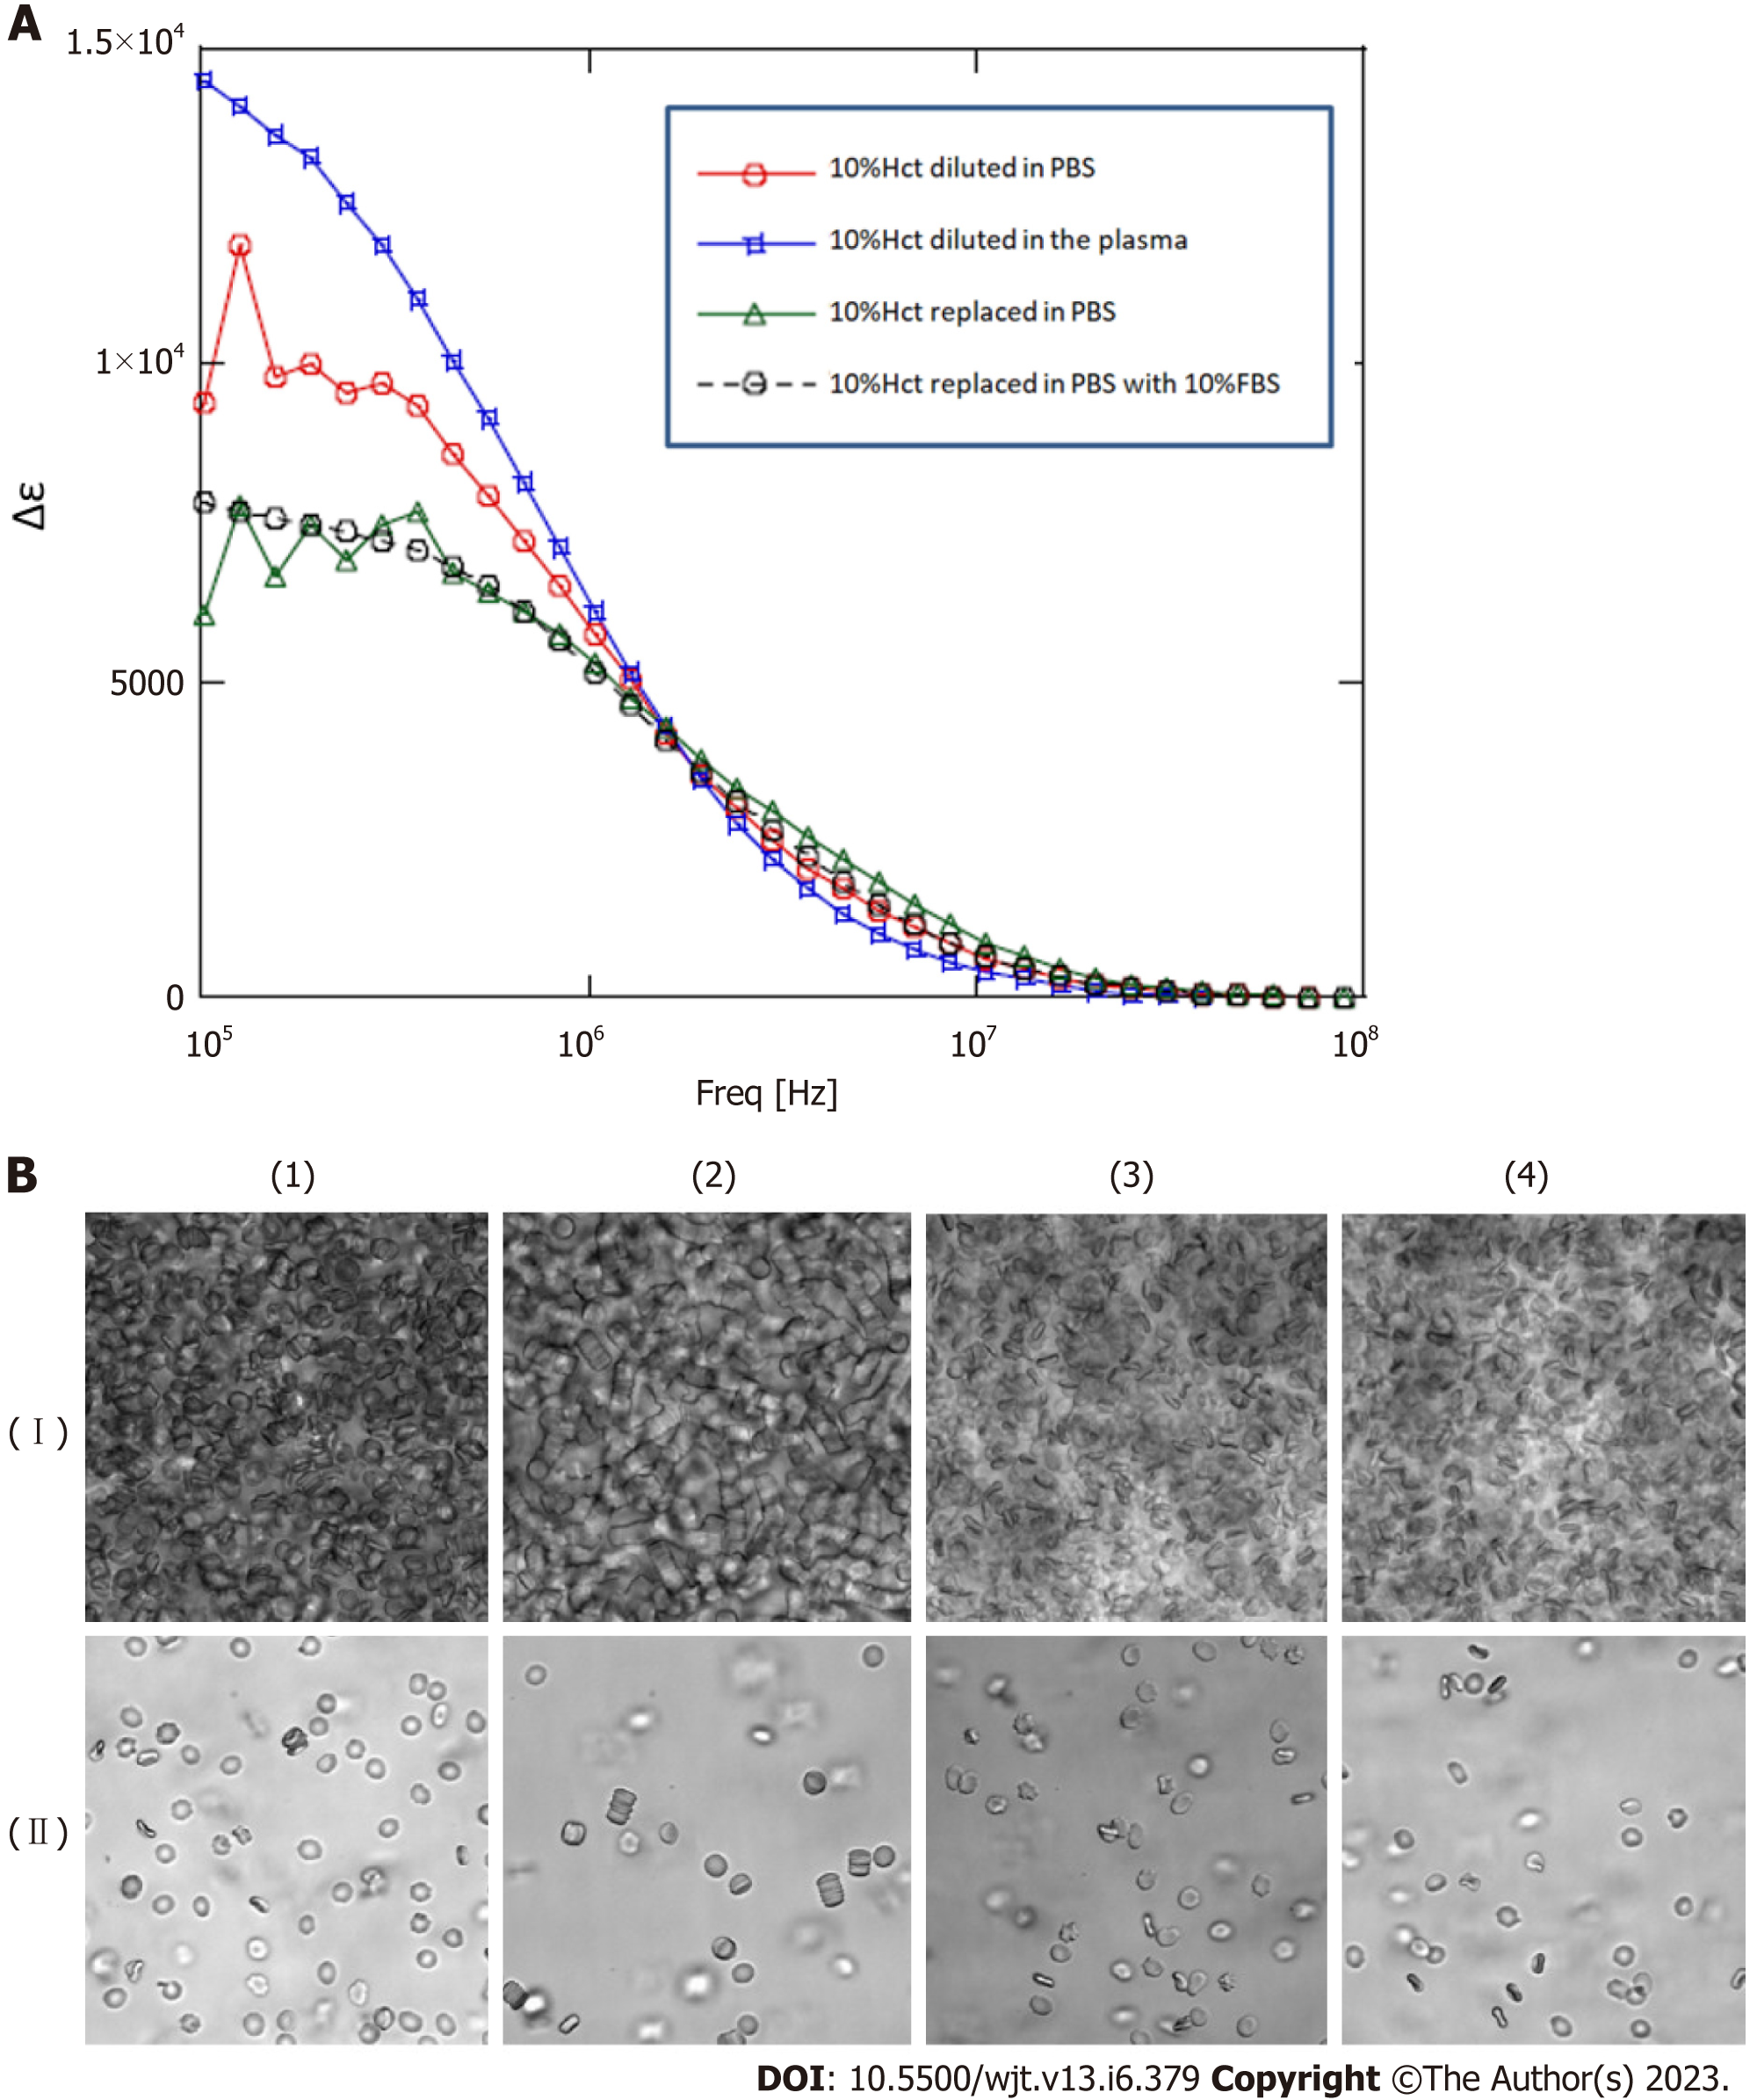
Figure 5 We conducted a replacement experiment for the blood cells and plasma components.
A: Blood sample (about 30%Hct) from the patient with graft-versus-host disease was diluted as 10%Hct diluted in phosphate buffer saline (PBS), 10%Hct diluted in the patient’s plasma, 10%Hct replaced in PBS, and 10%Hct replaced in PBS with 10%FBS, and dielectric properties were measured; B: (I) Blood sample (about 30%Hct) from the patient with graft-versus-host disease was diluted as (1) 10%Hct diluted in PBS, (2) 10%Hct diluted in the patient’s plasma, (3) 10%Hct replaced in PBS, and (4) 10%Hct replaced in PBS with 10%FBS, and observed by phase-contrast microscopy; (II) Sample of (I) was further diluted by 50-fold in the same way, and observed by phase-contrast microscopy. PBS: Phosphate buffer saline.
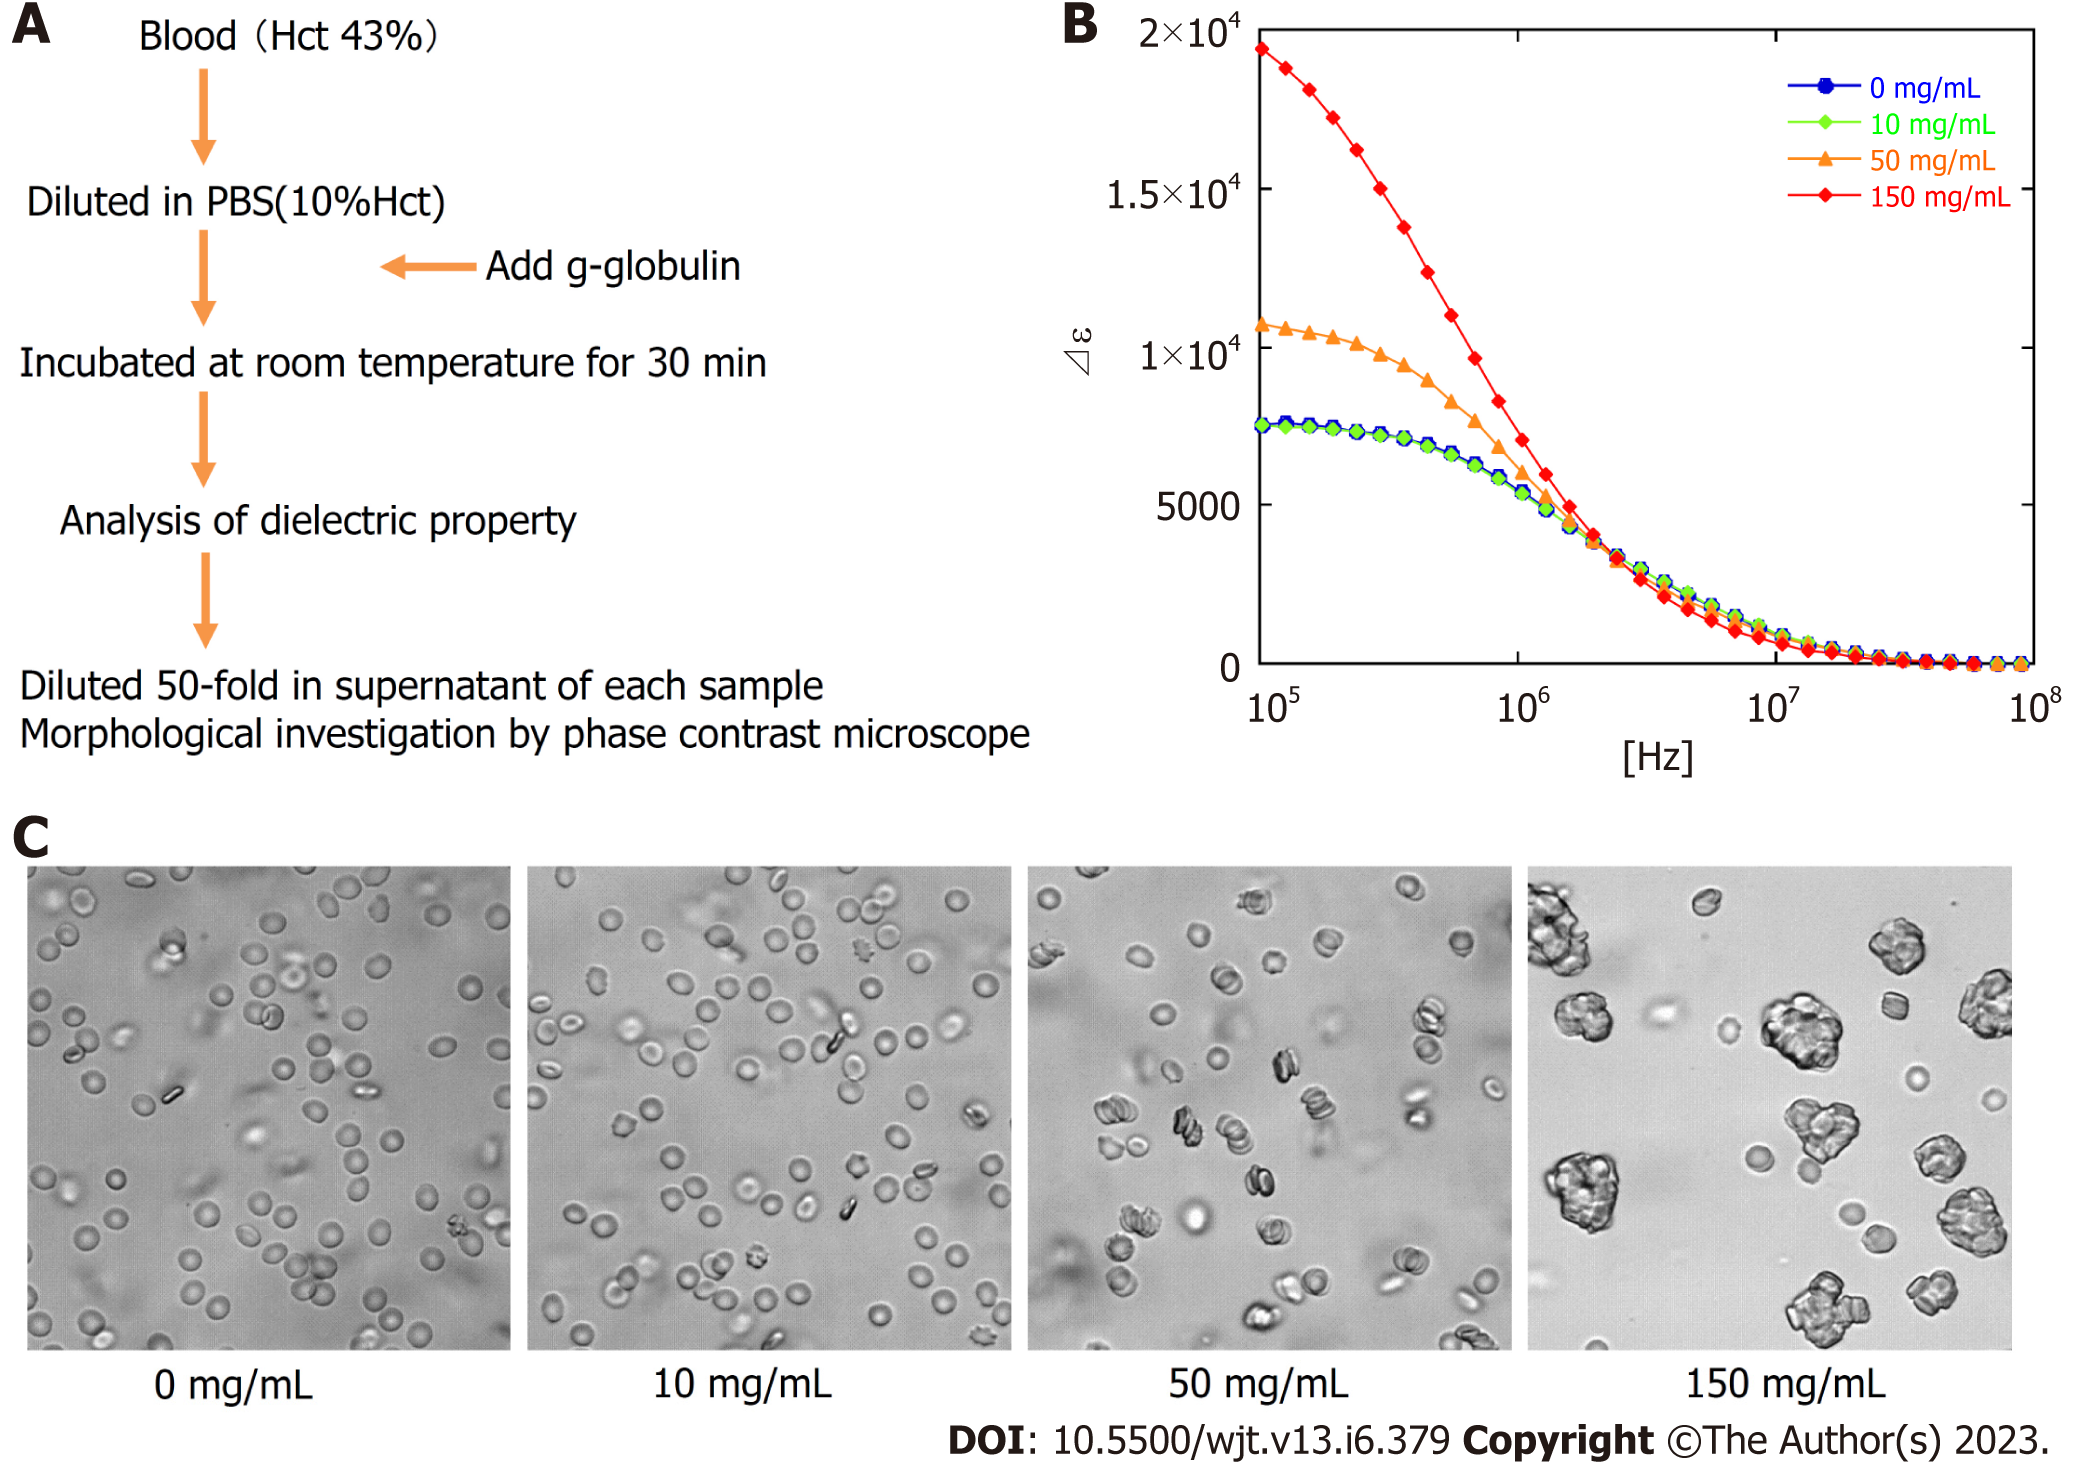
Figure 6 The observed rate of change in the dielectric constant.
A: Blood sample from a healthy volunteer (Hct 43%) was diluted in PBS to 10% Hct, and g-globulin was added to a final concentration of 0 mg/dL, 10 mg/dL, 50 mg/dL, and 150 mg/dL; B: After incubation for 30 min, dielectric properties of each sample were measured; C: Morphology of erythrocytes was investigated by phase-contrast microscopy after further dilution by 50-fold. PBS: Phosphate buffer saline.
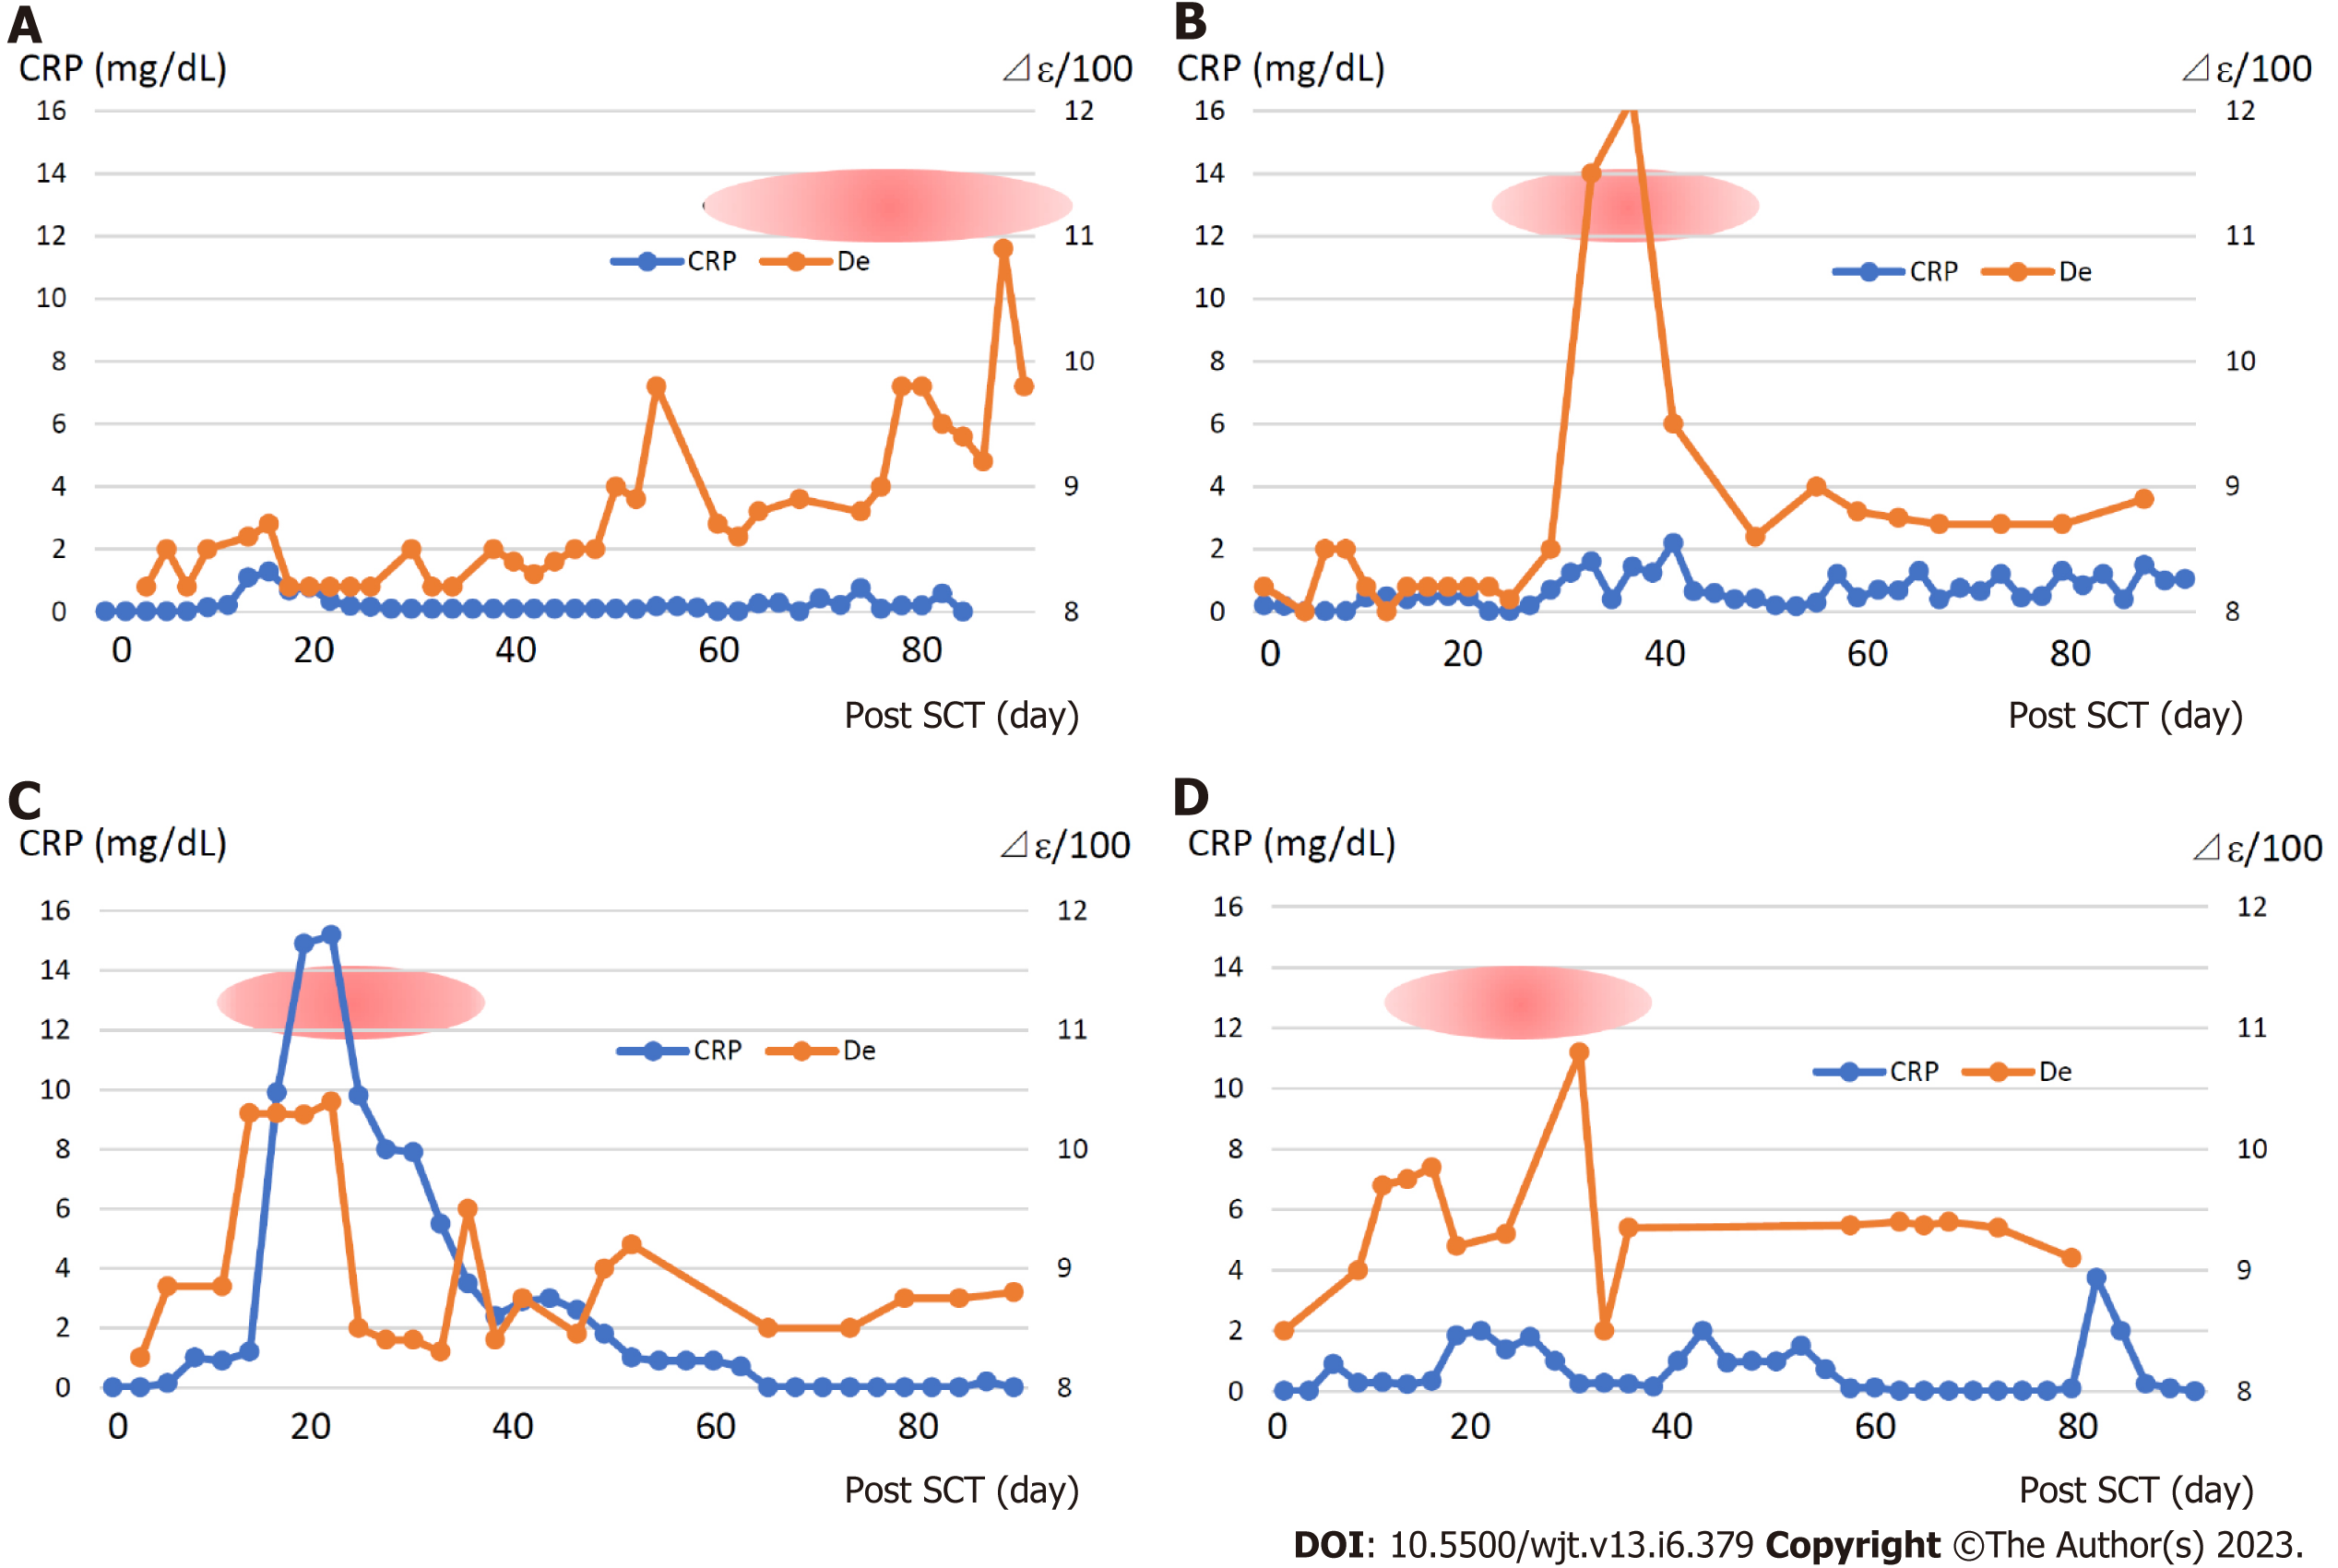
Figure 7 Transition and relationship between dielectric relaxation strength and C-reactive protein in patients who developed graft-versus-host disease grade 3 after transplantation.
A: Patient 3; B: Patient 4; C: Patient 12; D: Patient 13. Red oval marks indicate the period of grade 3 and more acute graft-versus-host disease. CRP: C-reactive protein; SCT: Stem cell transplantation.
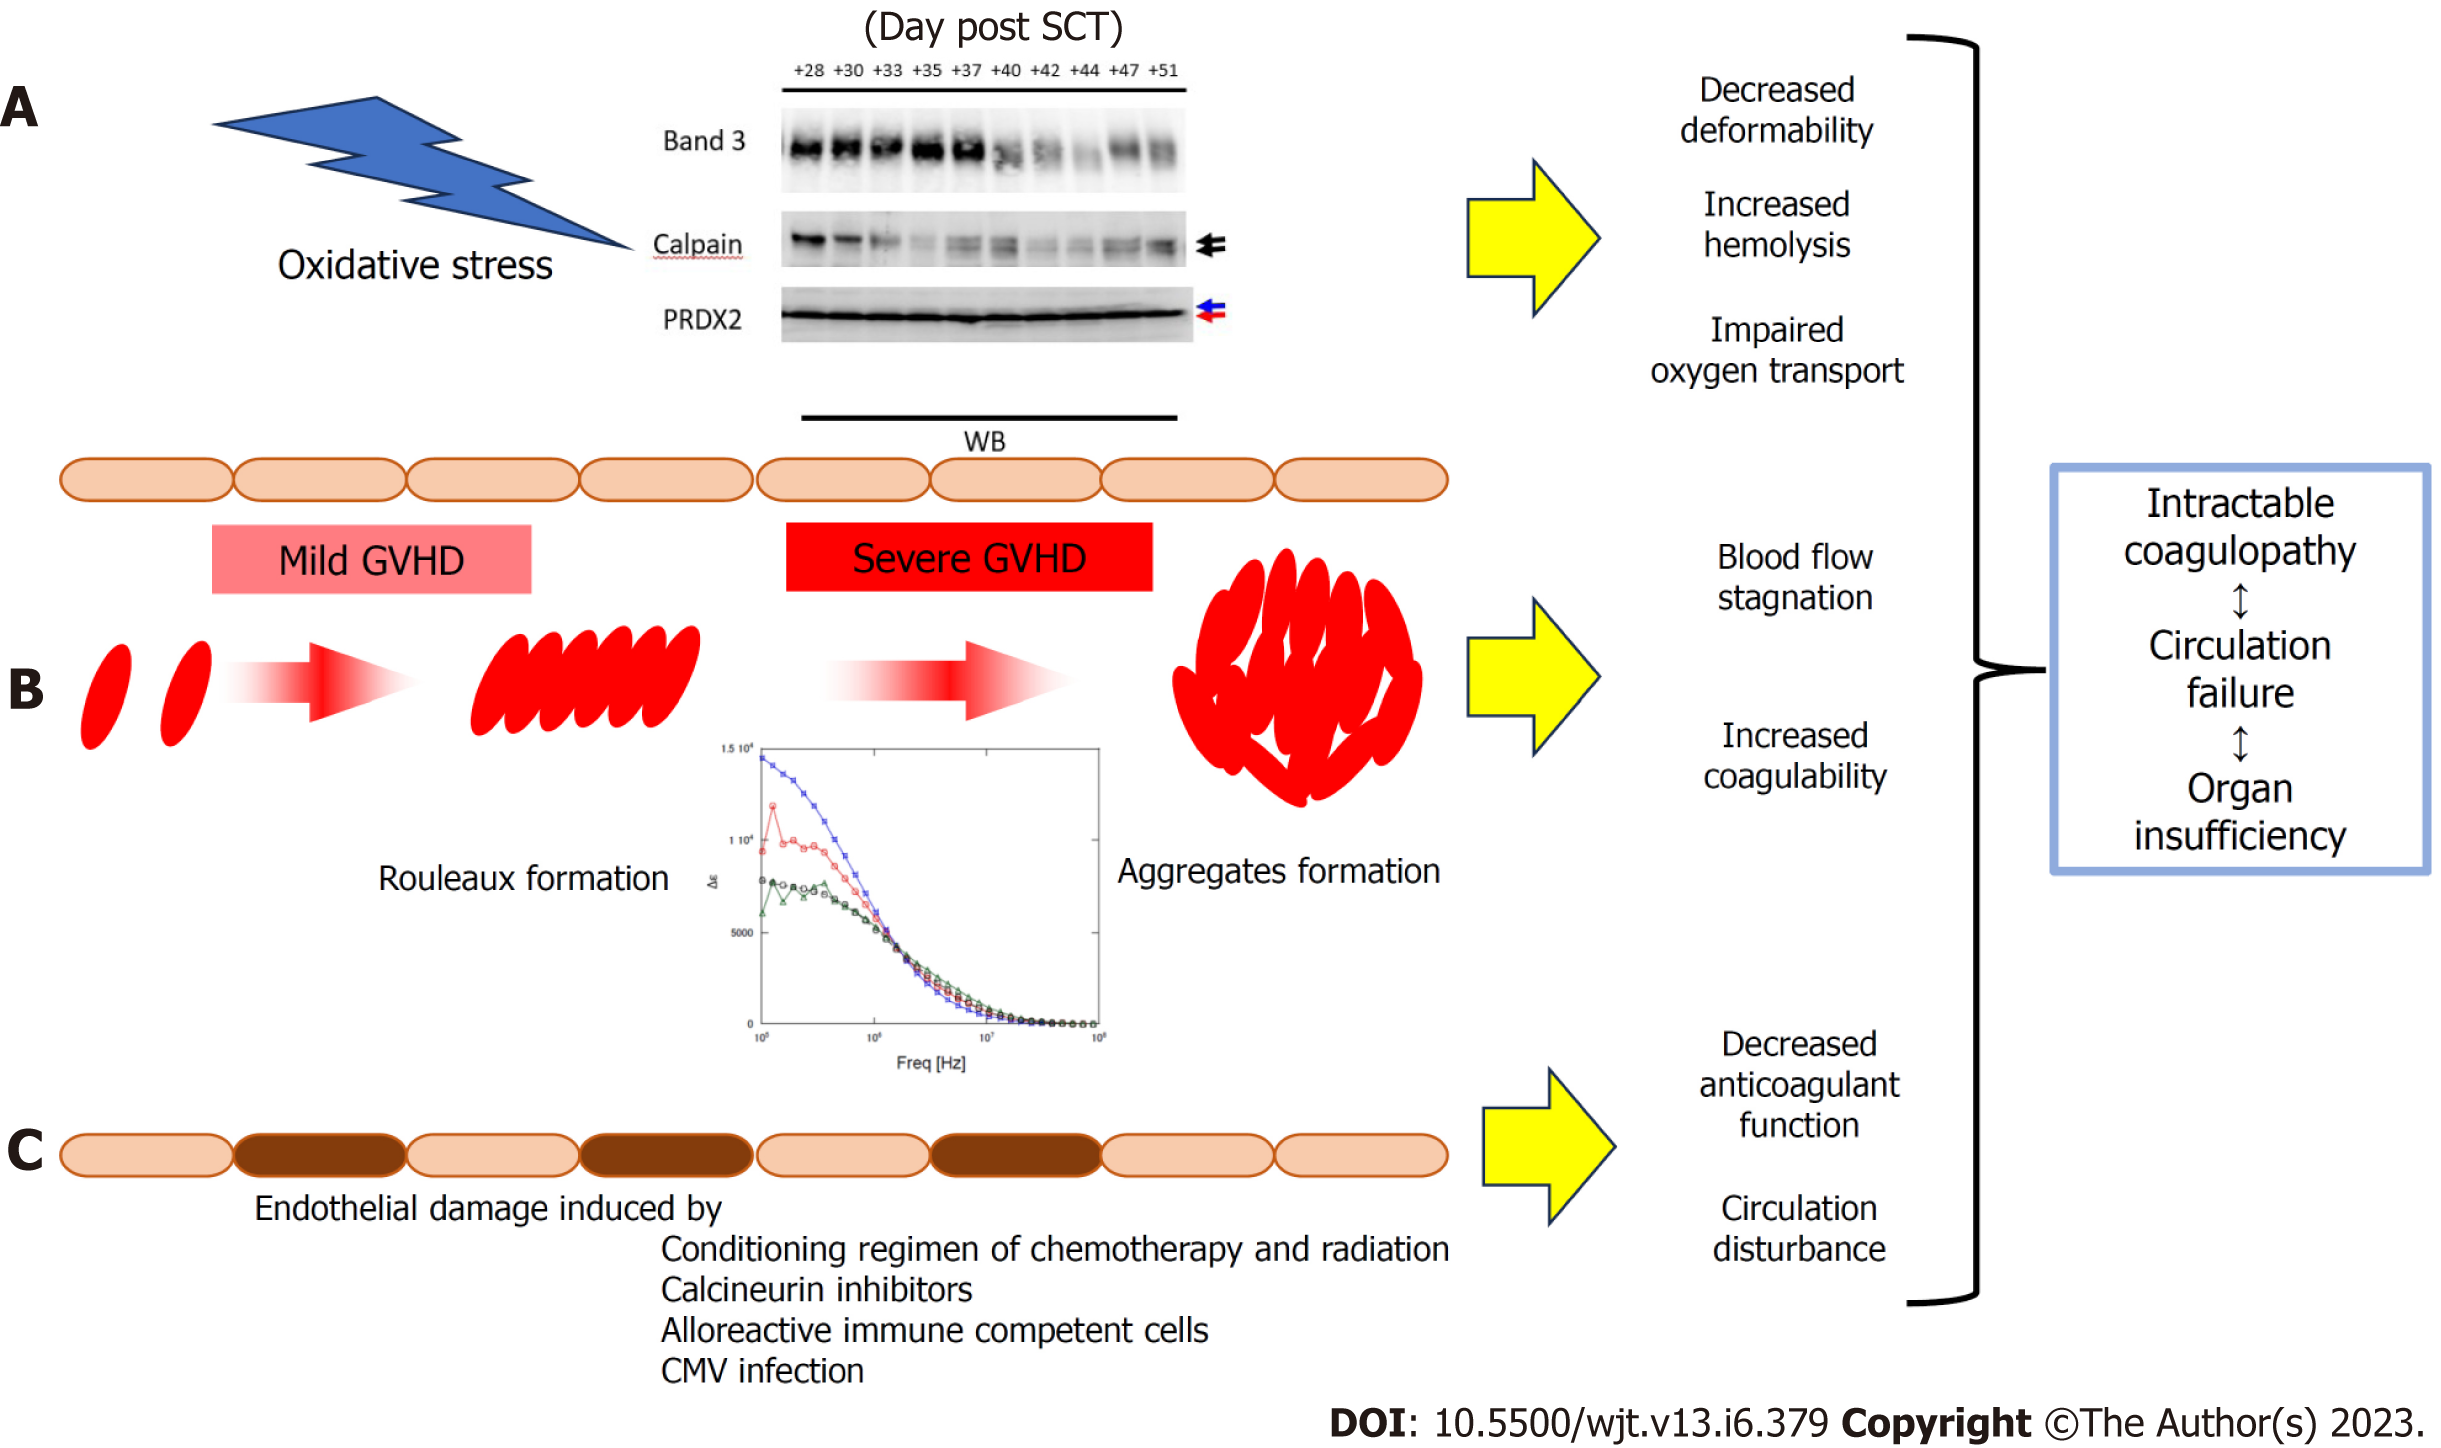
Figure 8 Schematic illustration of graft-versus-host disease from the perspective of dielectric analysis of whole blood cells.
A: In graft-versus-host disease (GVHD) of grade 3 or higher, oxidative stress-activated calpains lead to degradation of band3 and truncation of the C-terminus of PRDX2, leading to decreased erythrocyte plasticity, increased fragility, and impaired oxygen transport; B: Changes in plasma contents due to complex inflammation such as GVHD cause rouleaux formation and aggregation of erythrocytes, causing stasis in blood circulation and becoming more susceptible to coagulation activation; C: Vascular endothelial cell damage by pretreatment or calcineurin inhibitors is further prolonged and increased by alloimmune reactions and reactivation of cytomegalovirus virus, and the anticoagulant function of vascular endothelial cells is reduced. These phenomena are compounded and lead to refractory coagulopathy and subsequent organ circulatory failure and dysfunction. CMV: Cytomegalovirus; CRP: C-reactive protein; GVHD: Graft-versus-host disease; SCT: Stem cell transplantation.
- Citation: Nagasawa M. Pathophysiology of acute graft-versus-host disease from the perspective of hemodynamics determined by dielectric analysis. World J Transplant 2023; 13(6): 379-390
- URL: https://www.wjgnet.com/2220-3230/full/v13/i6/379.htm
- DOI: https://dx.doi.org/10.5500/wjt.v13.i6.379


