Copyright
©The Author(s) 2023.
World J Transplant. Feb 18, 2023; 13(2): 44-57
Published online Feb 18, 2023. doi: 10.5500/wjt.v13.i2.44
Published online Feb 18, 2023. doi: 10.5500/wjt.v13.i2.44
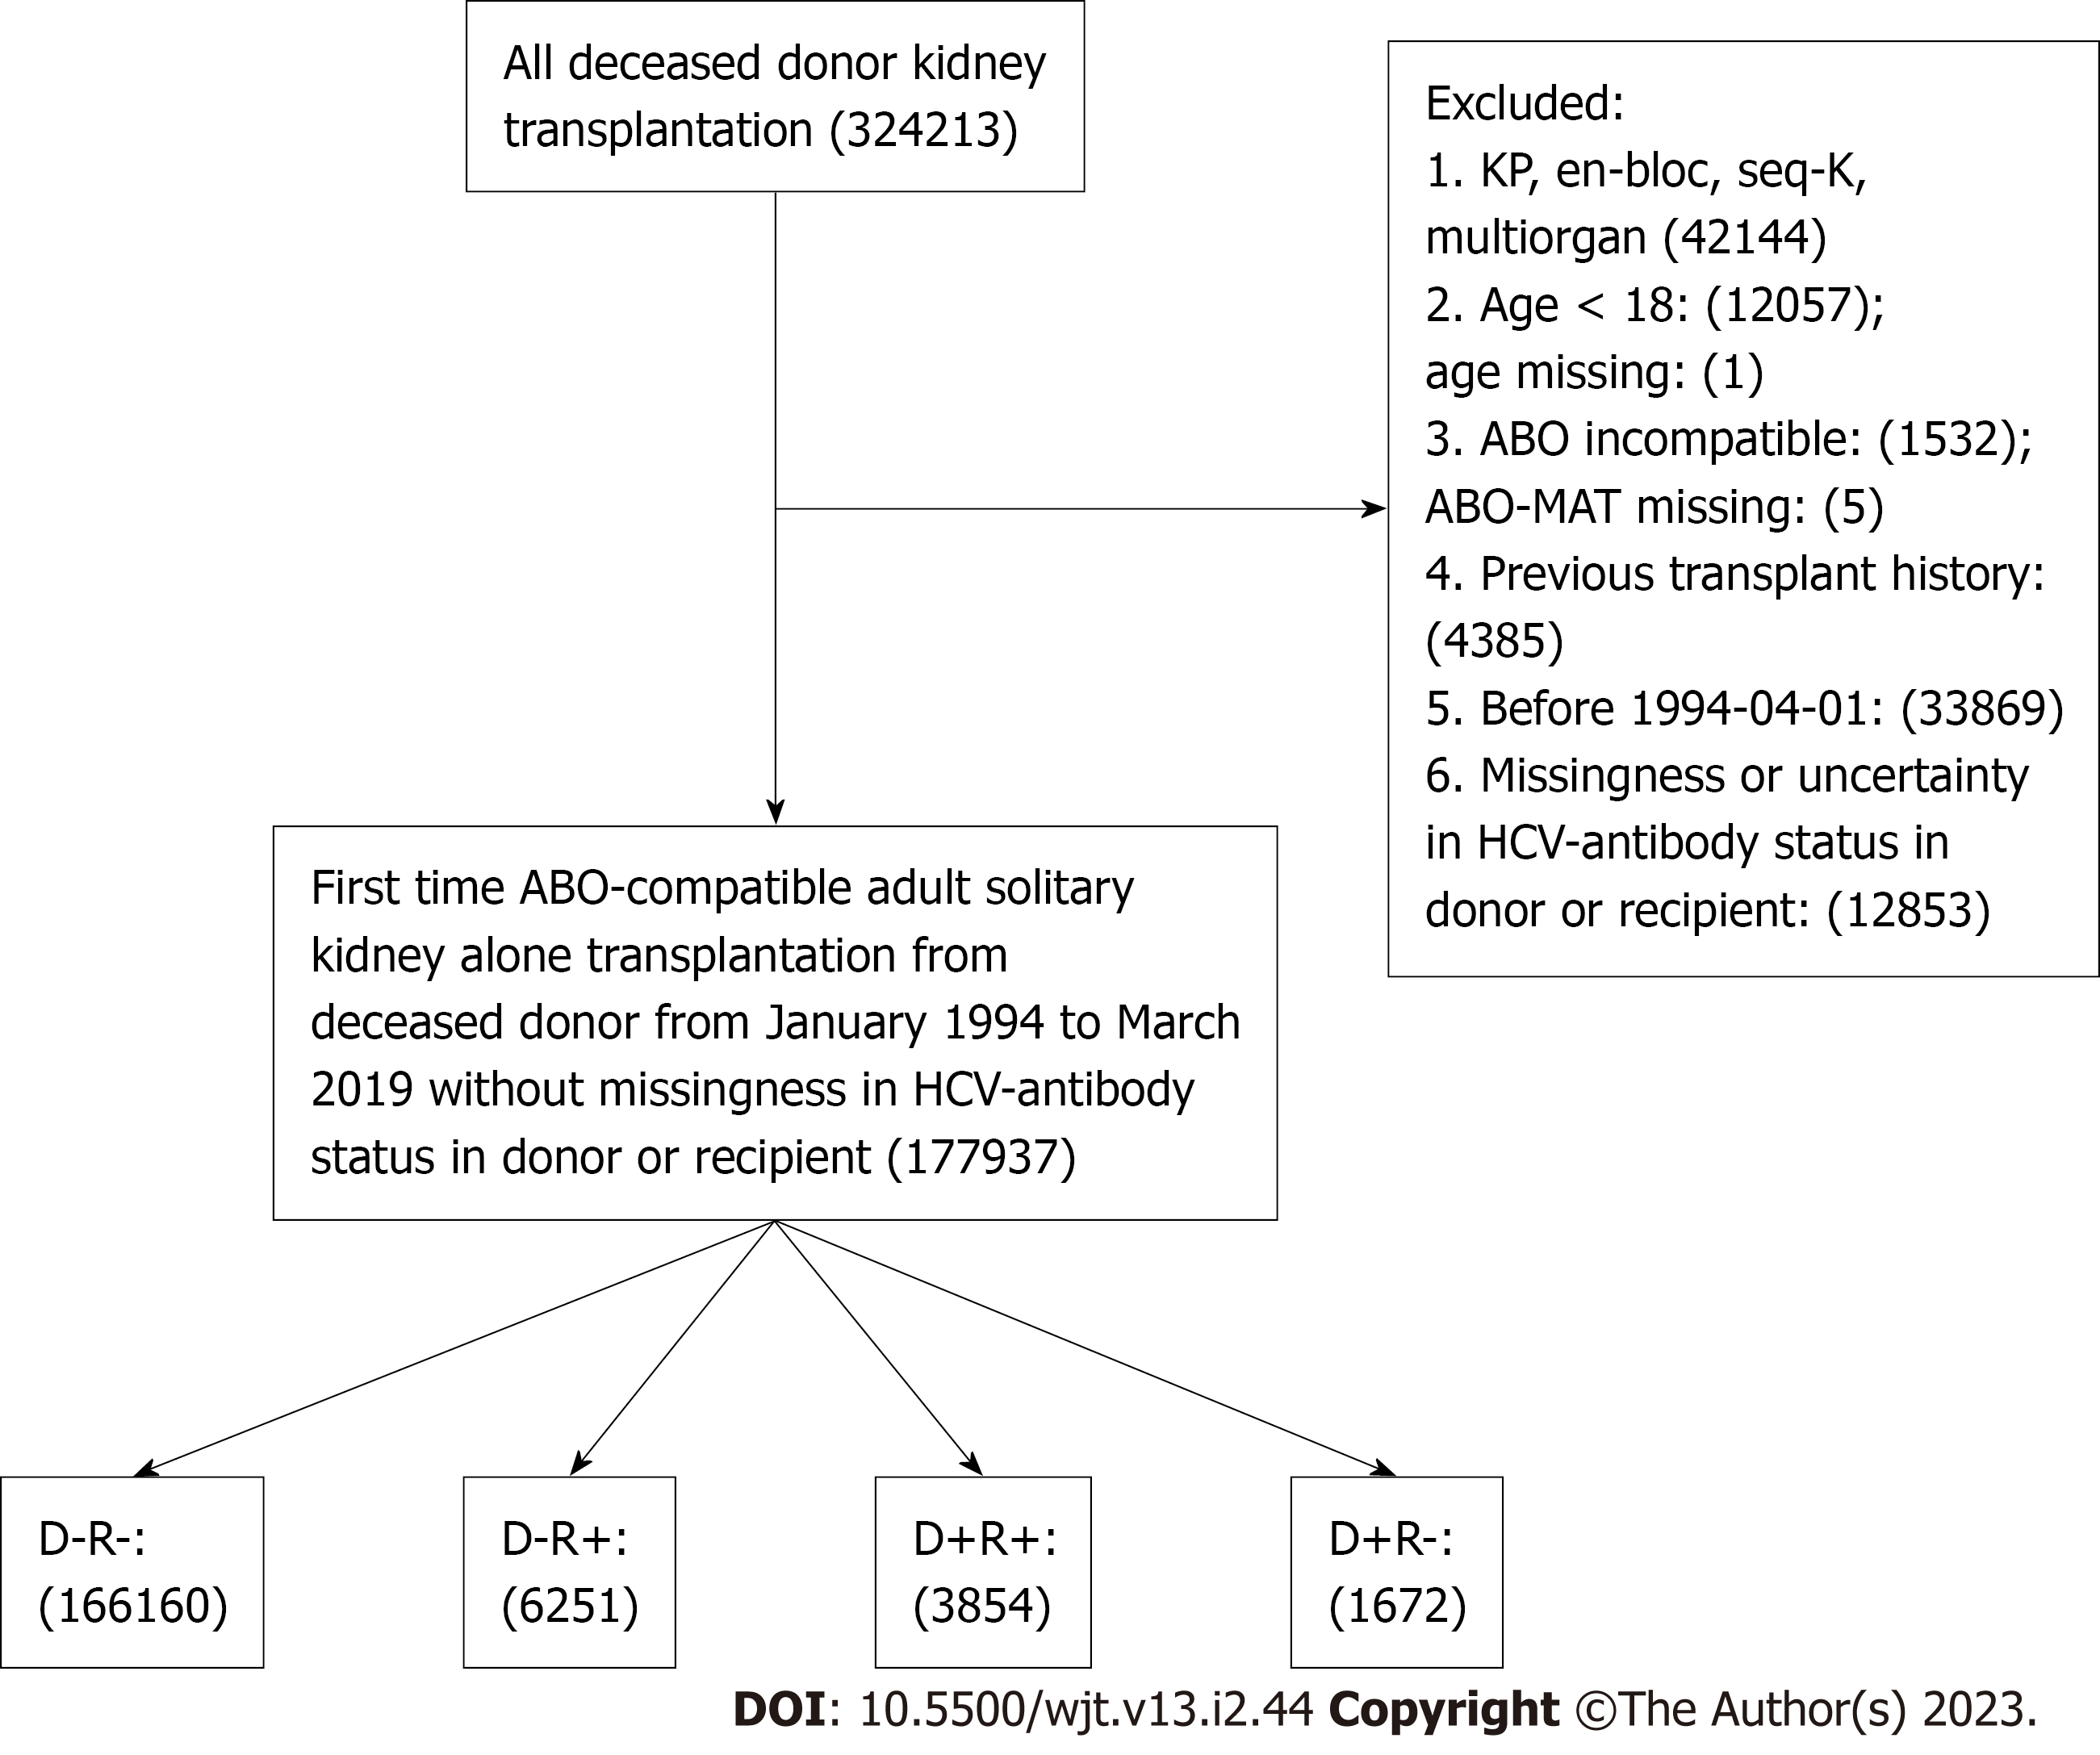
Figure 1 Flowchart of study cohorts identification.
We identified all adult (age ≥ 18) first-time solitary kidney transplantation recipients from an ABO-compatible deceased donor between January 1994 and March 2019 in the United States Patients with missing or uncertain hepatitis C virus (HCV)-antibody status in the donor or recipient were excluded. Patients were allocated into four groups according to HCV infection in the donor (D+) or recipient (R+): D-R-, D+R-, D-R+, and D+R+. KP: Kidney-pancreas; HCV: Hepatitis C virus; ABO-MAT: ABO-blood type match.
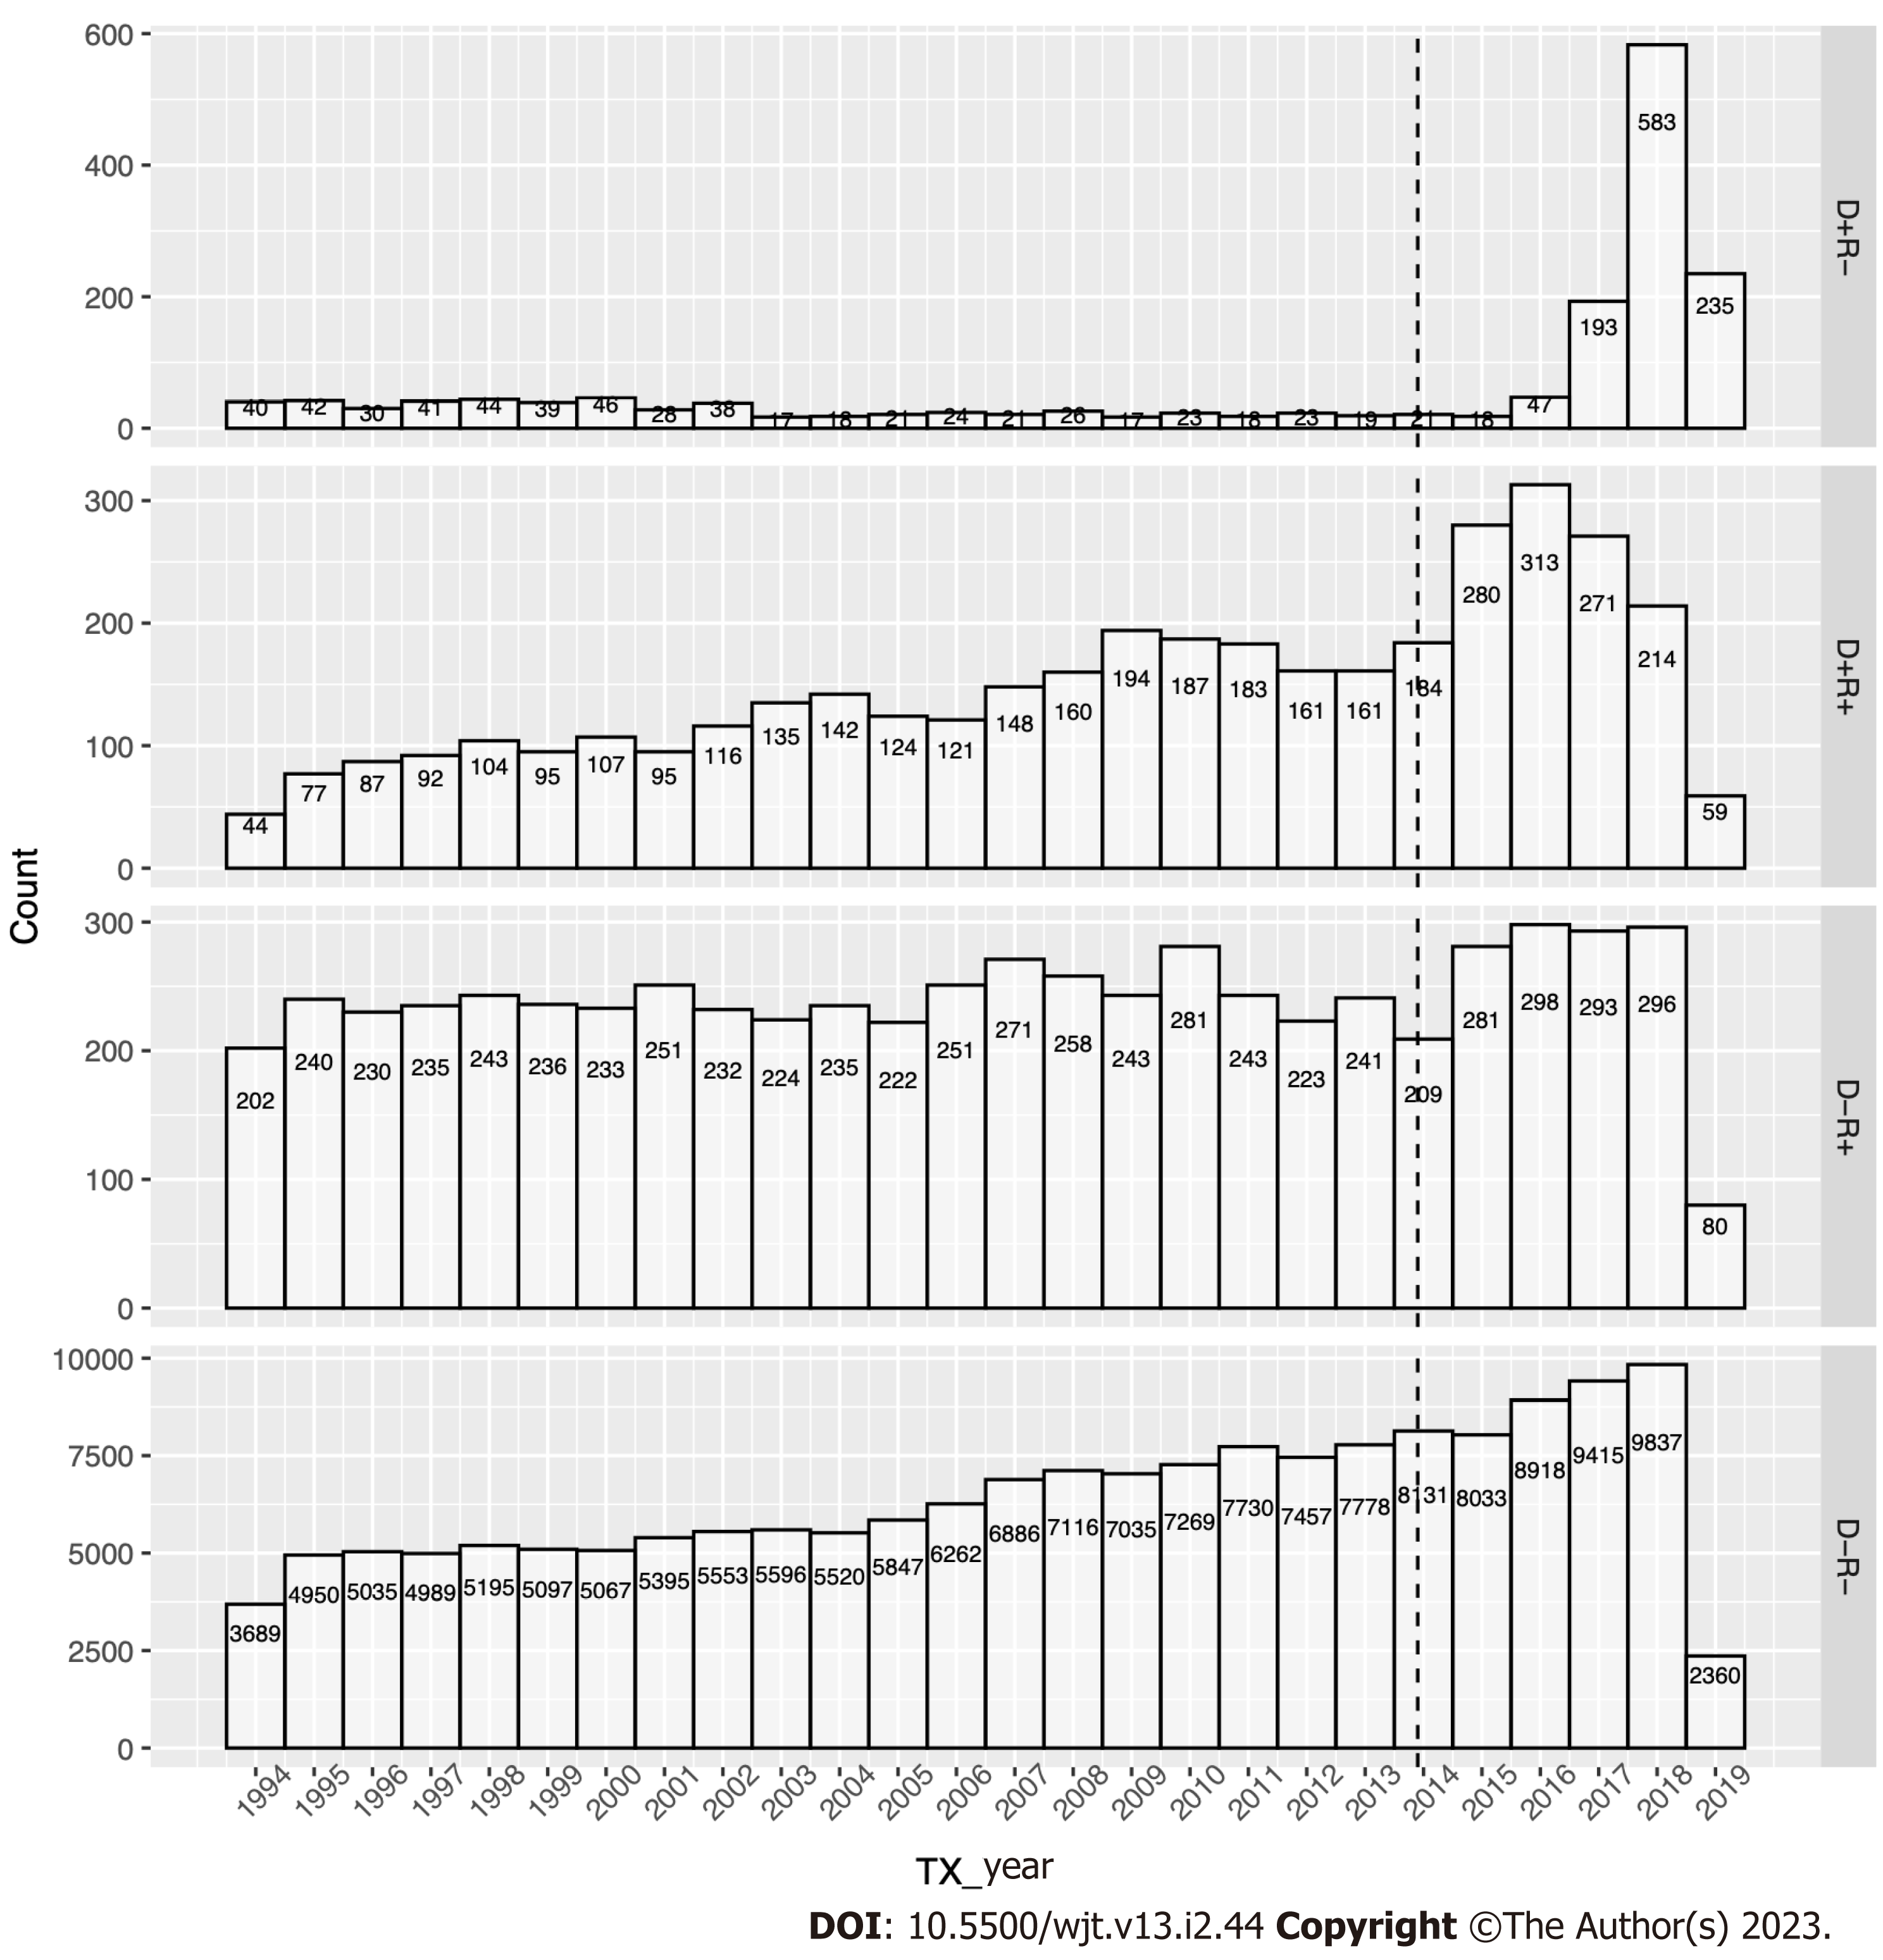
Figure 2 Yearly distribution of the kidney transplantation stratified by hepatitis C virus status in donor and/or recipient.
Numbers of kidney transplants performed each year from January 1994 and March 2019 were plotted and stratified into four groups according to hepatitis C virus infection in the donor or recipient: D-R-, D+R-, D-R+, and D+R+.
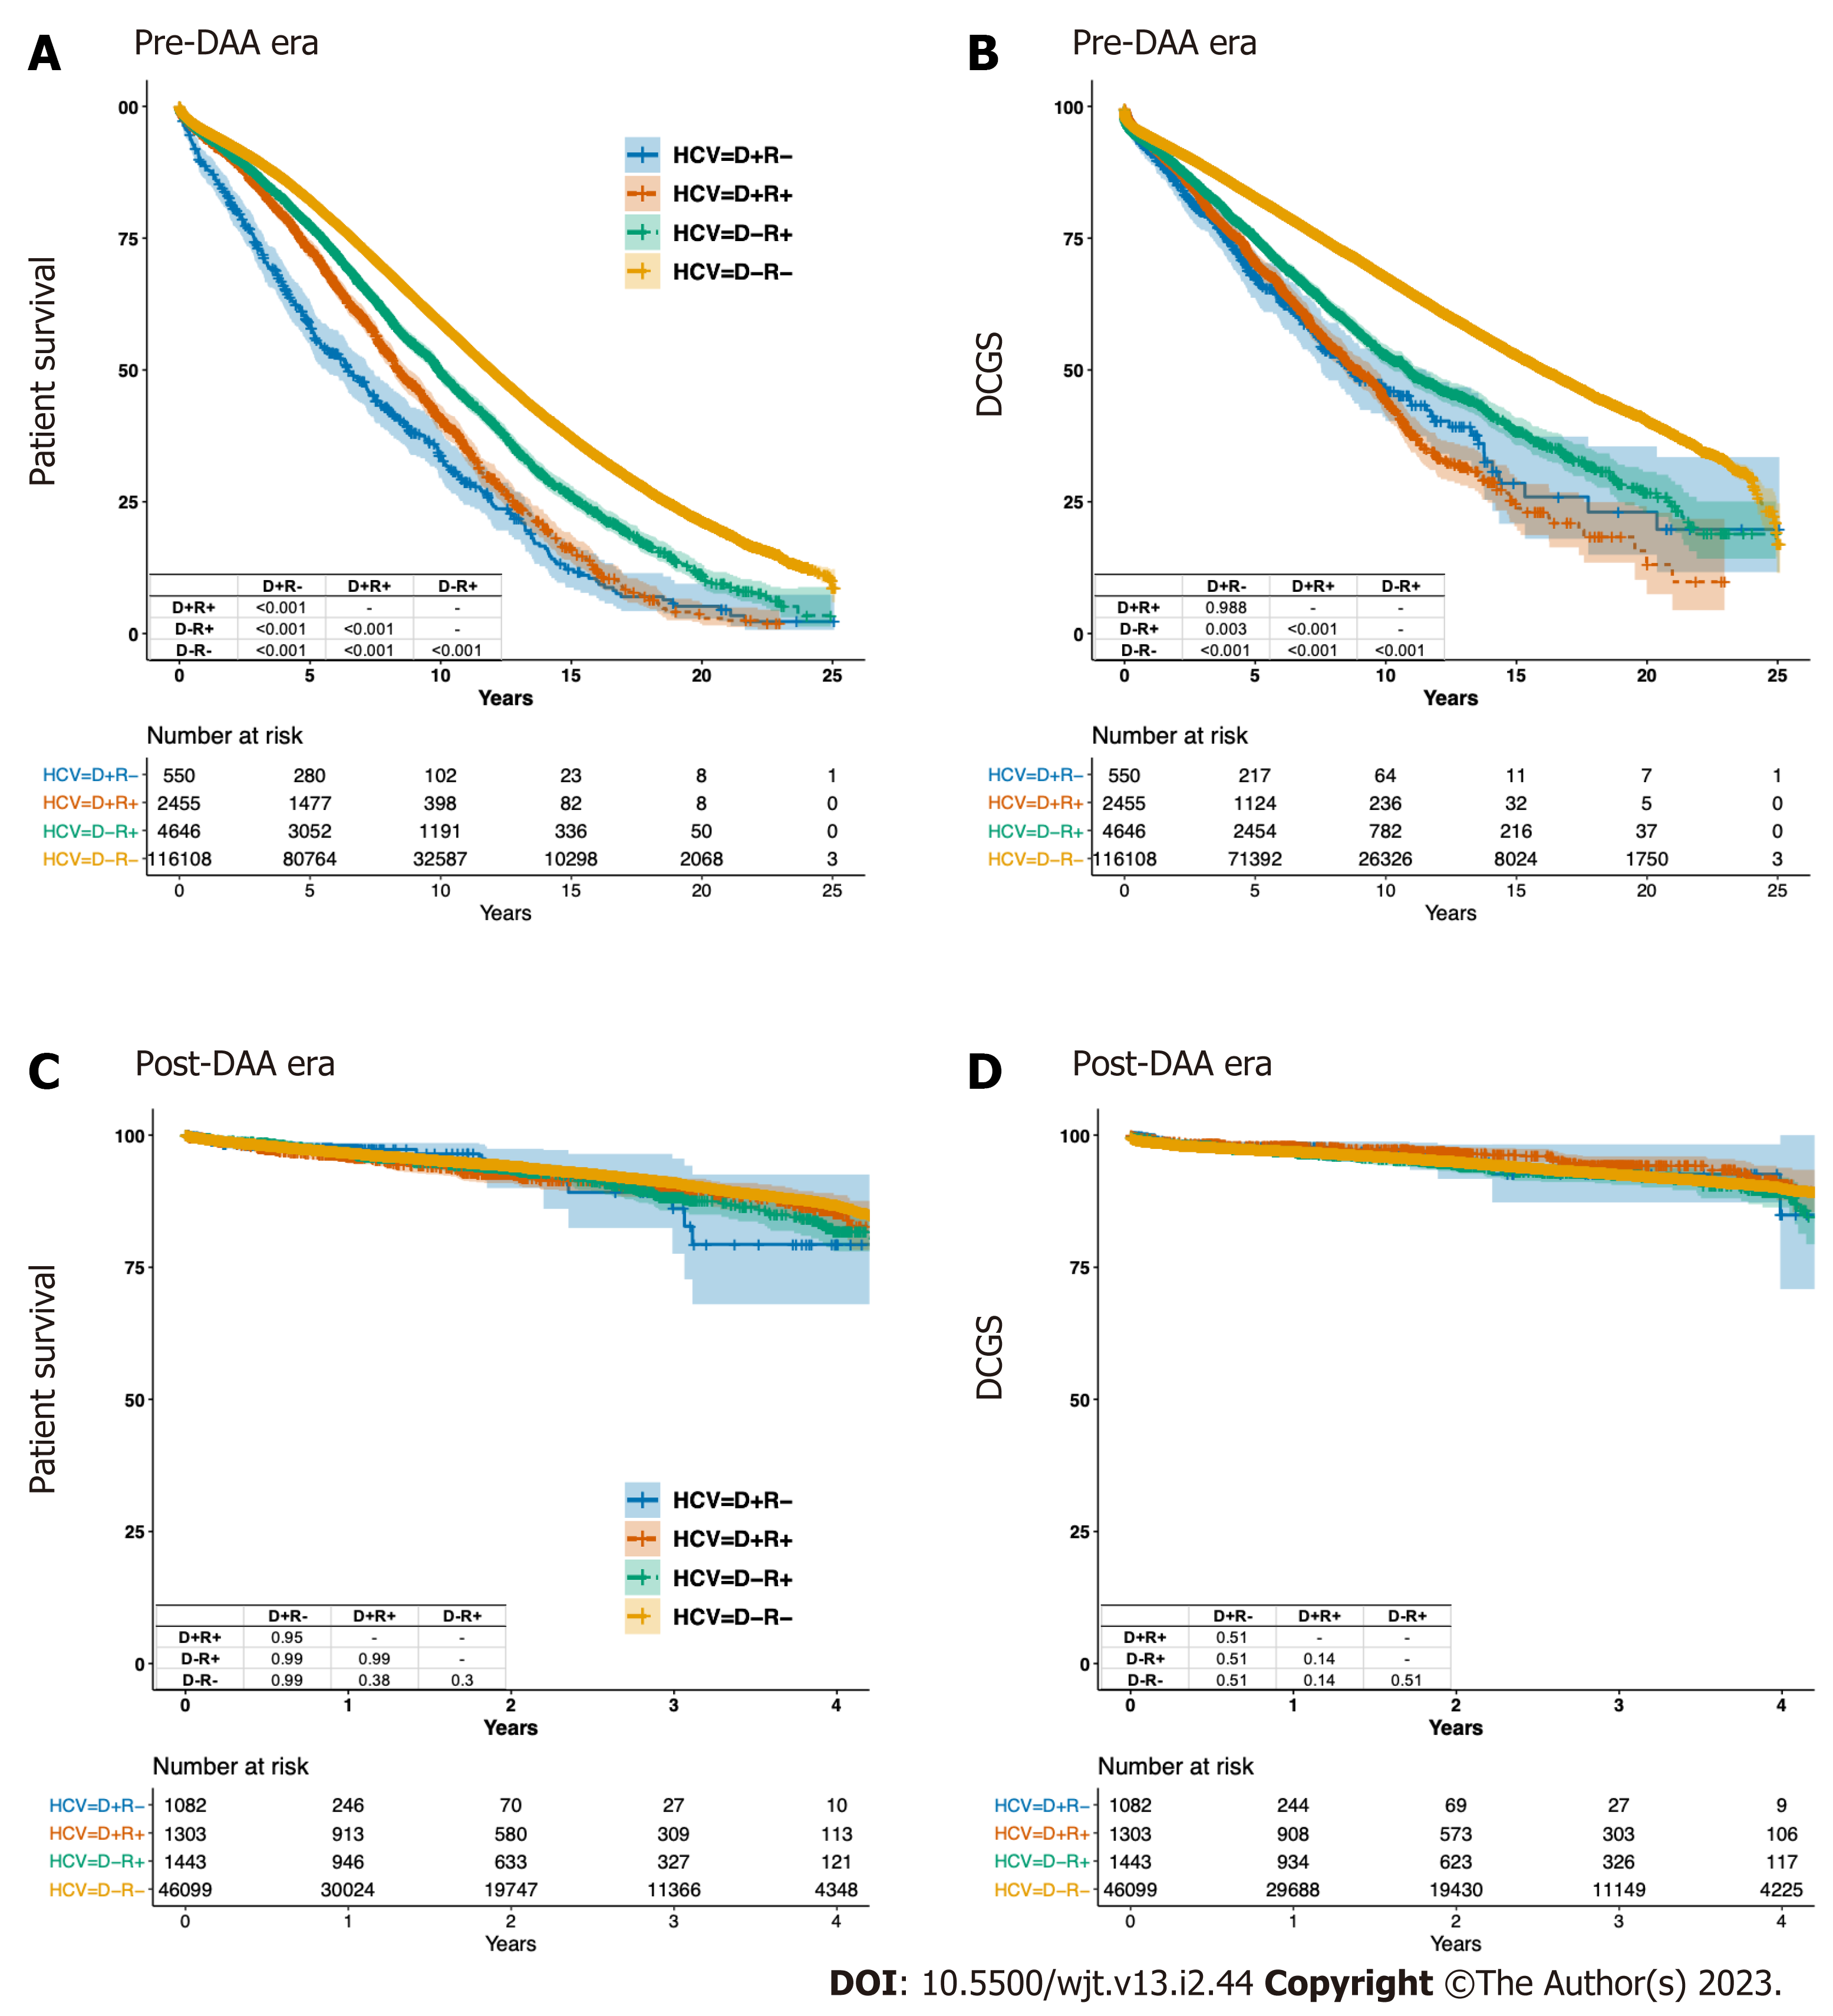
Figure 3 Crude patient survival and death-censored graft survival among four cohorts in the pre- and post-direct-acting antivirals eras.
Survival was presented in Kaplan-Meier curves and analyzed by log-rank tests. Multiple comparison was adjusted by Bonferroni correction. A: Crude patient survival in the pre-direct-acting antivirals (DAA) era; B: Crude death-censored graft survival (DCGS) in the pre-DAA era; C: Crude patient survival in the post-DAA era; D: crude DCGS in the post-DAA era. DAA: Direct-acting antivirals; HCV: Hepatitis C virus; DCGS: Death-censored graft survival.
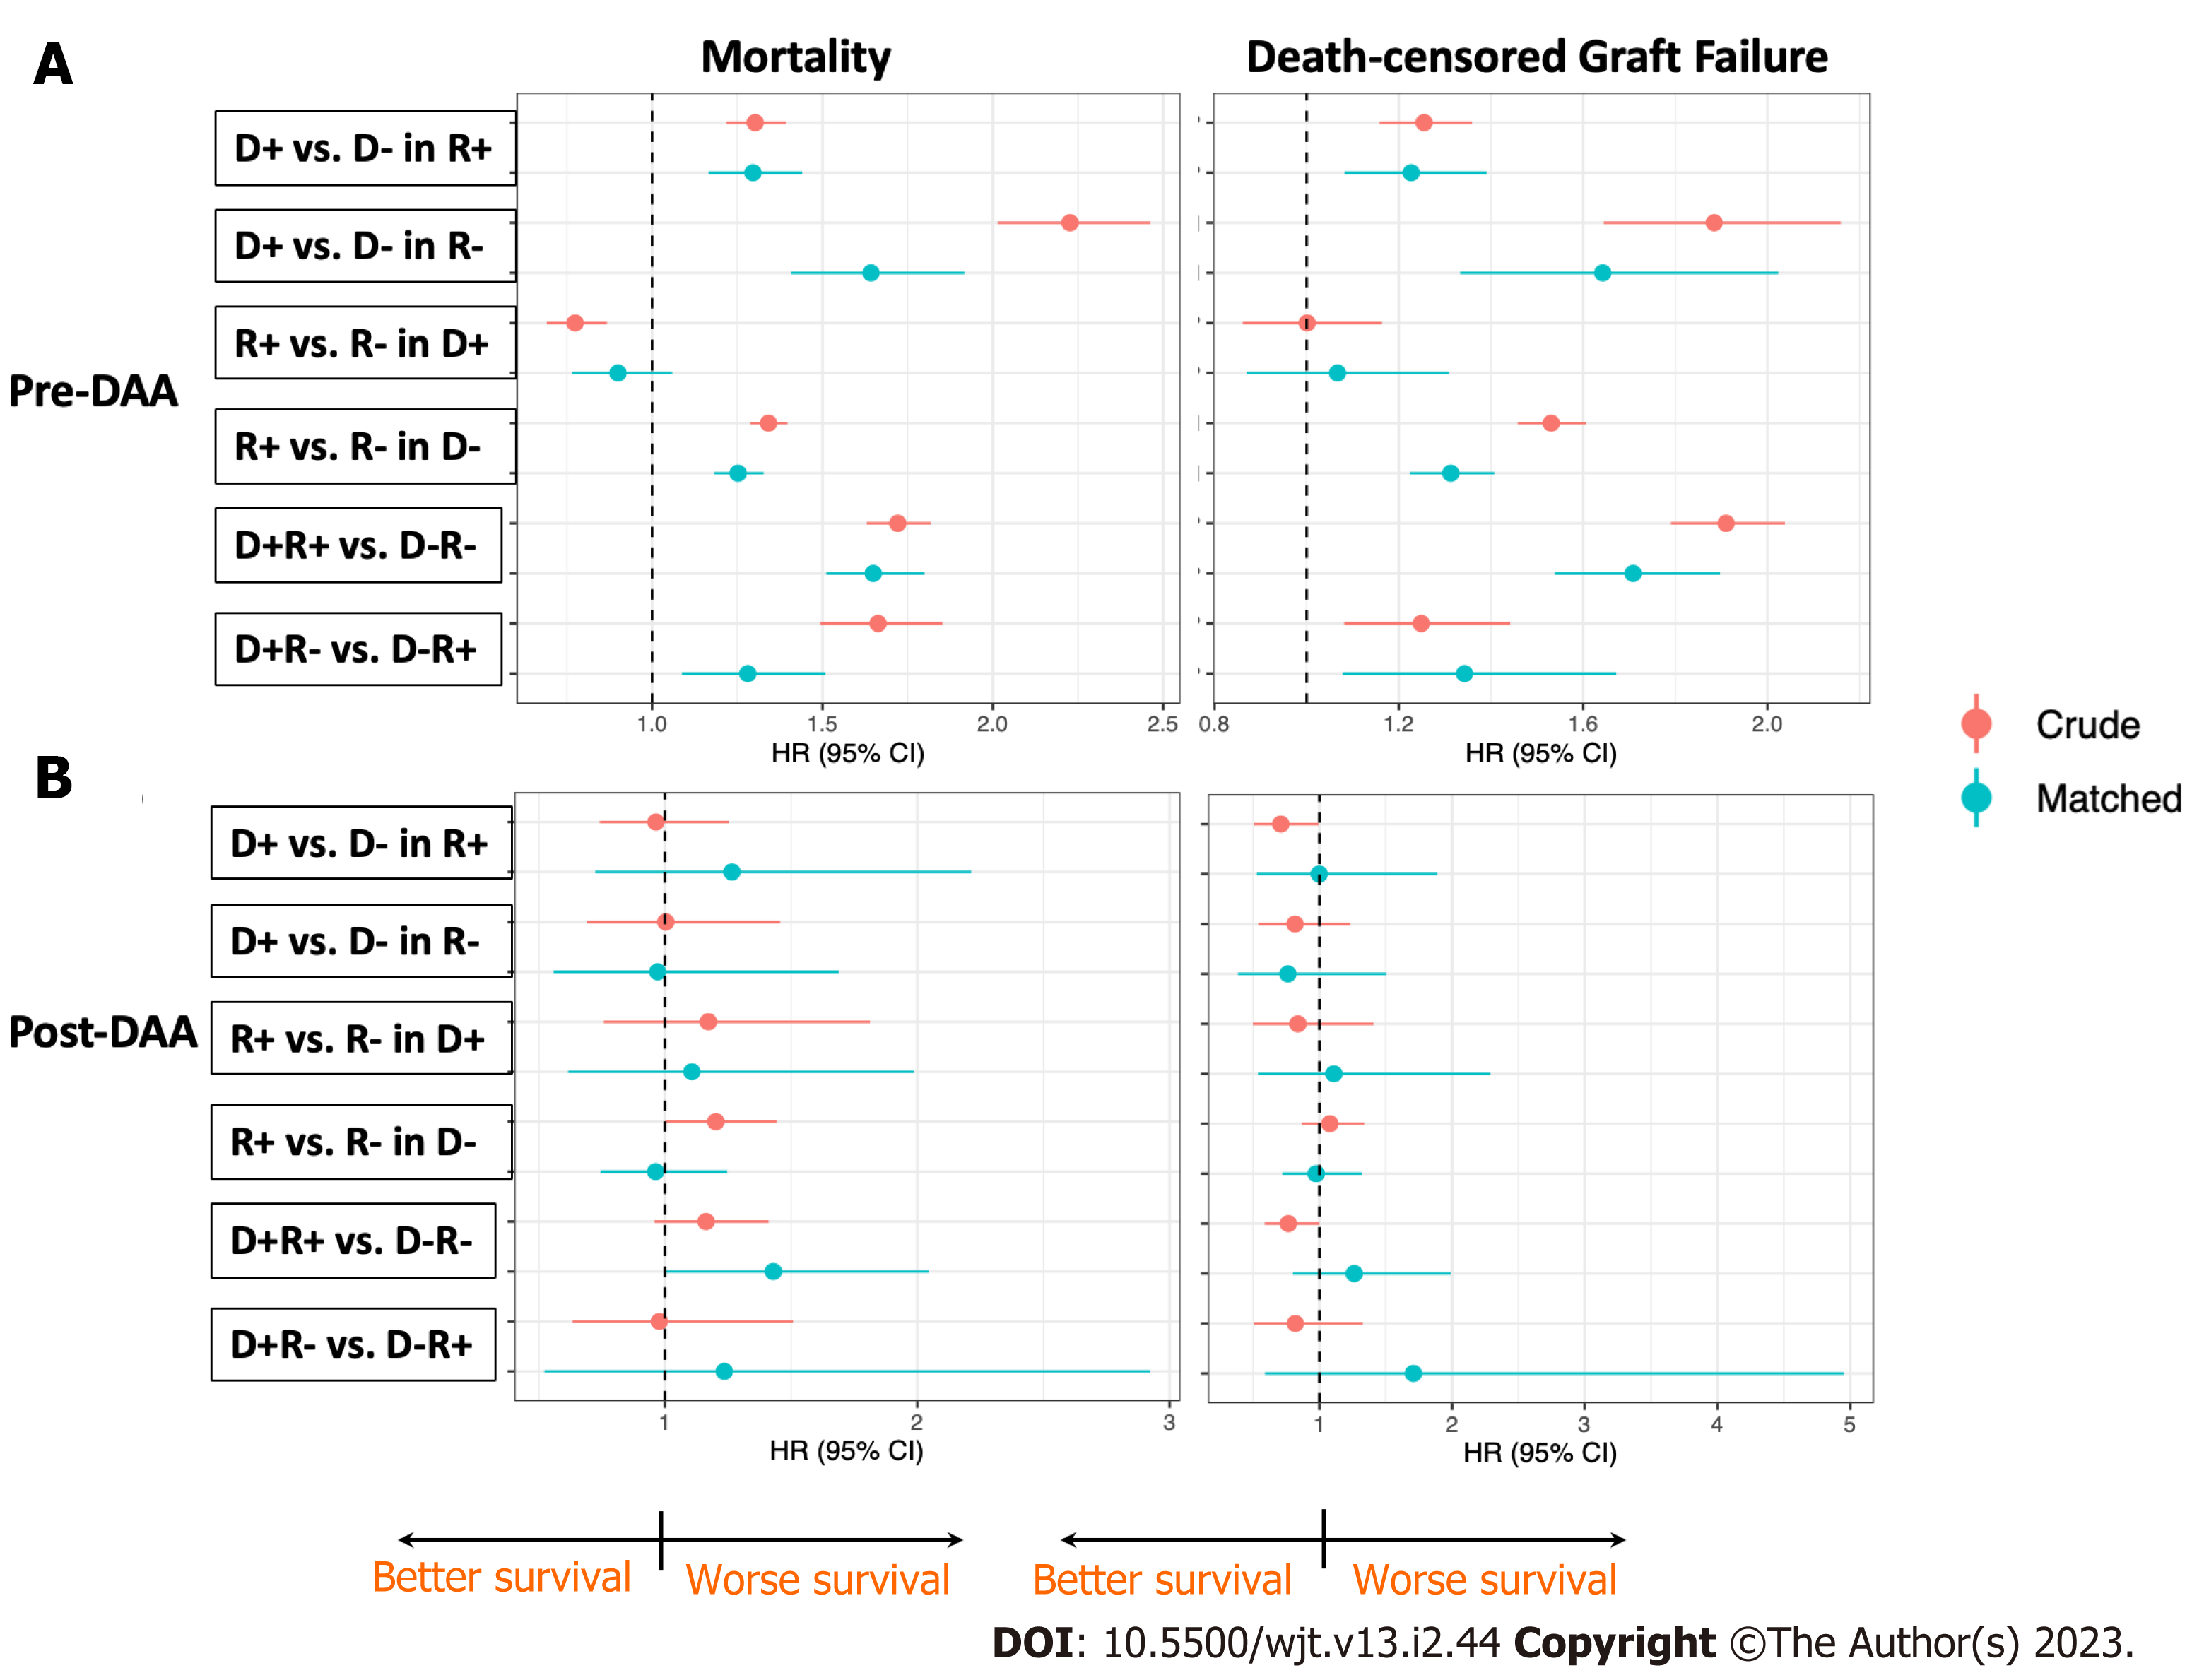
Figure 4 Relative risk of mortality and death-censored graft failure in six pair-wised comparison in the pre- and post-direct-acting antivirals eras.
Four groups of patients classified by hepatitis C virus infection in the donor or recipient: D-R-, D+R-, D-R+, and D+R+, were compared pair-wisely before and after propensity score matching. Hazard ratio were presented in the forest plot with dot represented the HR and line represented the 95% confidence interval. D+ vs D- in R+ represented the relative risk of mortality or death-censored graft failure (DCGF) in D+R+ patients as compared with D-R+ patients. Similar interpretation in the other five pairs of comparison. The dashed line represented HR = 1. Dots located in the right of the dashed line means higher mortality or DCGF (worse survival) compared to the reference group. A: Relative risk in the pre-direct-acting antivirals (DAA) era; B: Relative risk in the post-DAA era. DAA: Direct-acting antivirals.
- Citation: Yuan Q, Hong S, Leya G, Roth E, Tsoulfas G, Williams W, Madsen JC, Elias N. Analysis of the effects of donor and recipient hepatitis C infection on kidney transplant outcomes in the United States. World J Transplant 2023; 13(2): 44-57
- URL: https://www.wjgnet.com/2220-3230/full/v13/i2/44.htm
- DOI: https://dx.doi.org/10.5500/wjt.v13.i2.44


