Copyright
©The Author(s) 2024.
World J Exp Med. Jun 20, 2024; 14(2): 90374
Published online Jun 20, 2024. doi: 10.5493/wjem.v14.i2.90374
Published online Jun 20, 2024. doi: 10.5493/wjem.v14.i2.90374
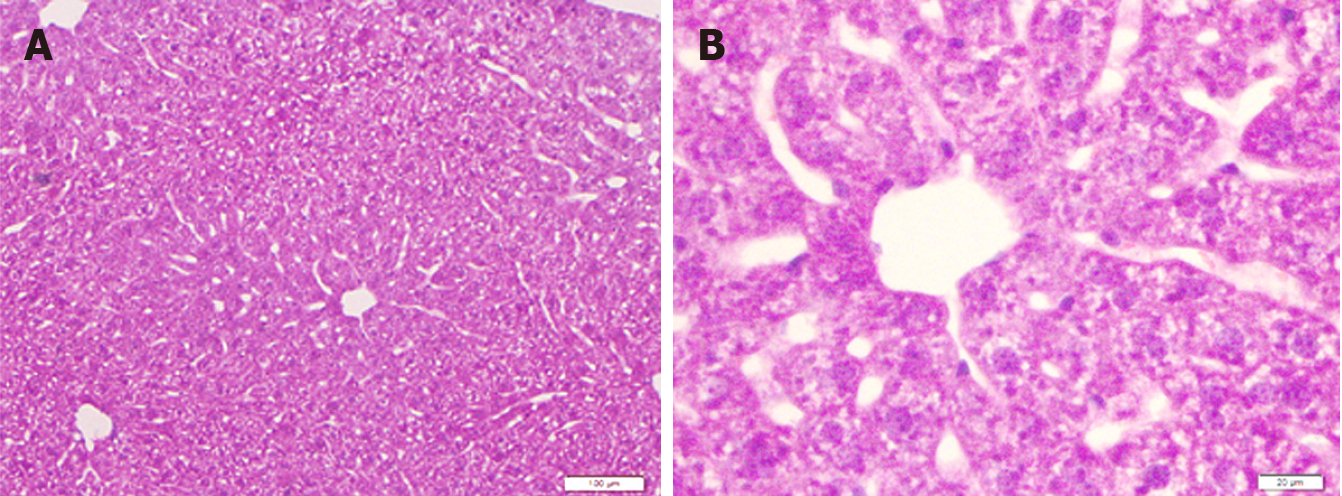
Figure 1 Liver sections of mice in the control group.
A: Low magnification; B: High magnification. H&E staining. Bars: 100 μm (A); 20 μm (B).
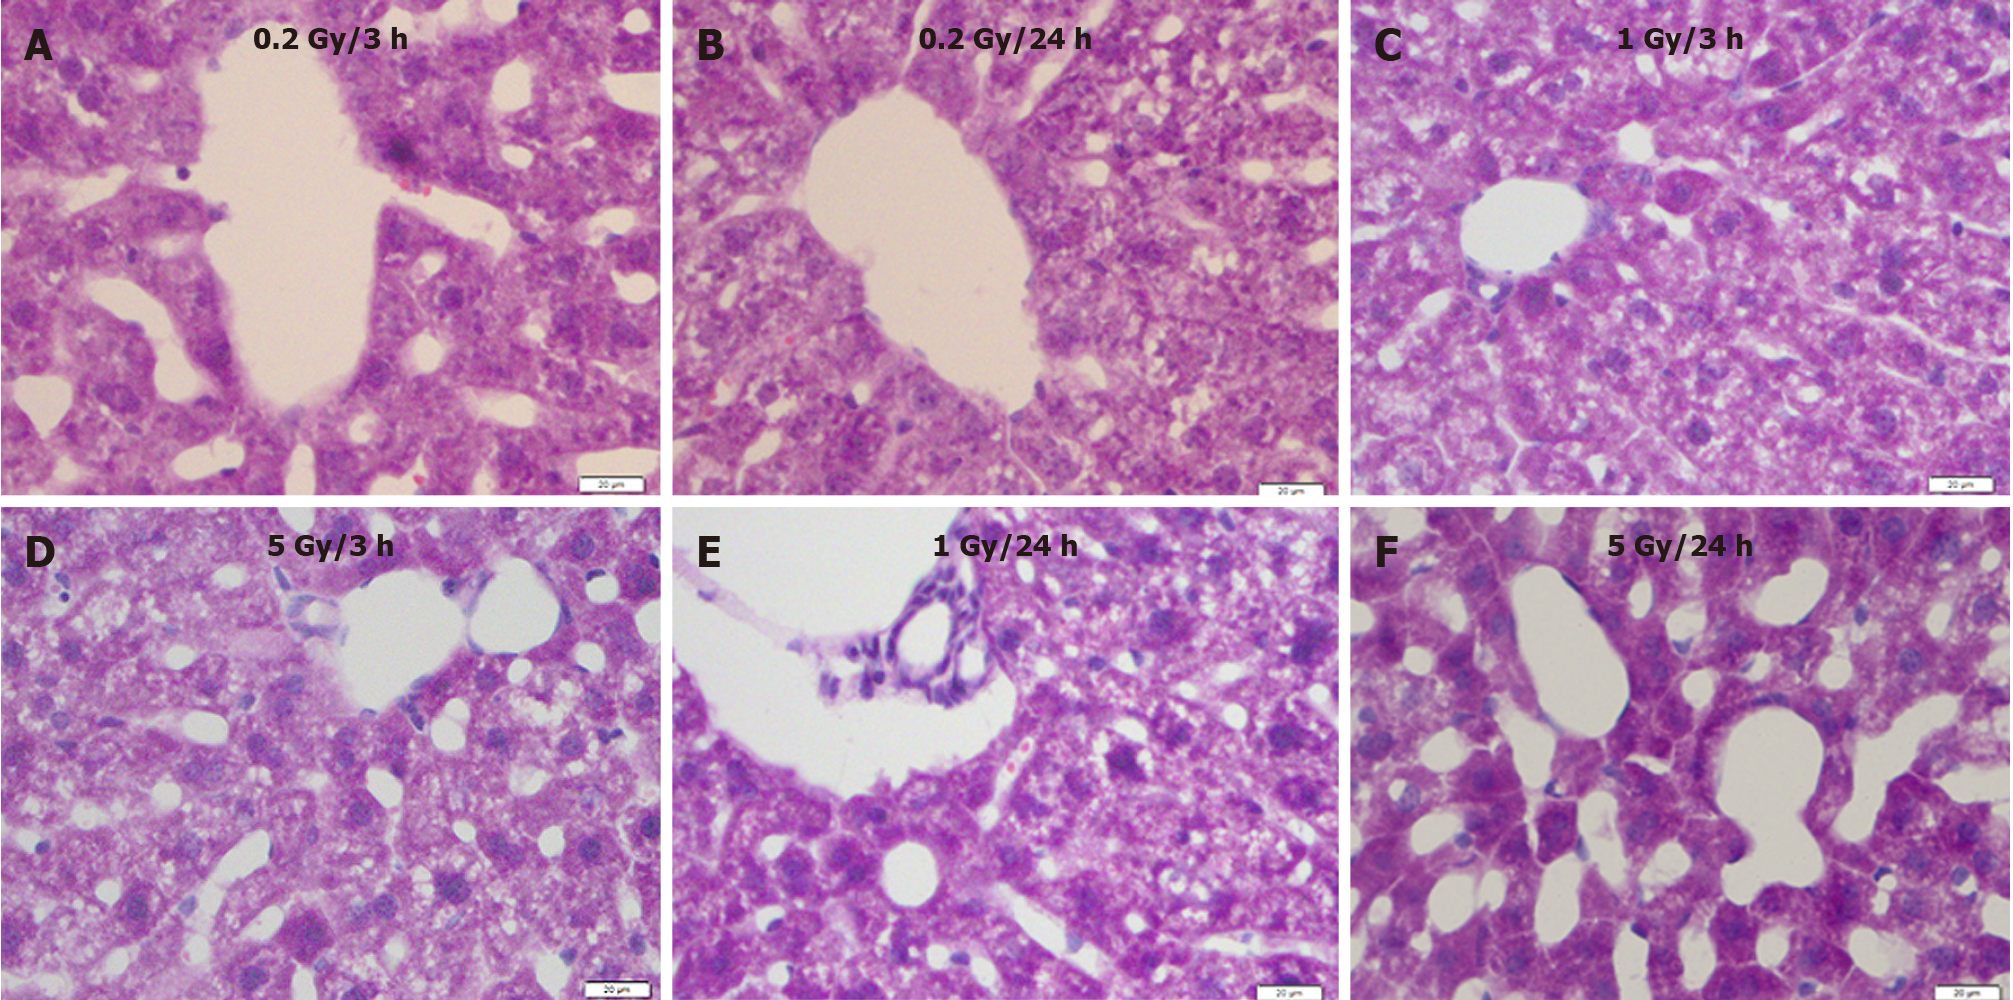
Figure 2 Mouse liver sections showing morphological changes with different radiation doses at different time points.
A: 3 h after exposure to low dose (0.2 Gy); B: 24 h after exposure to low dose (0.2 Gy); C: 3 h after exposure to medium dose (1 Gy); D: 3 h after exposure to high dose (5 Gy); E: 24 h after exposure to medium dose (1 Gy); F: 24 h after exposure to high dose (5 Gy). H&E staining. Bars: 20 μm.
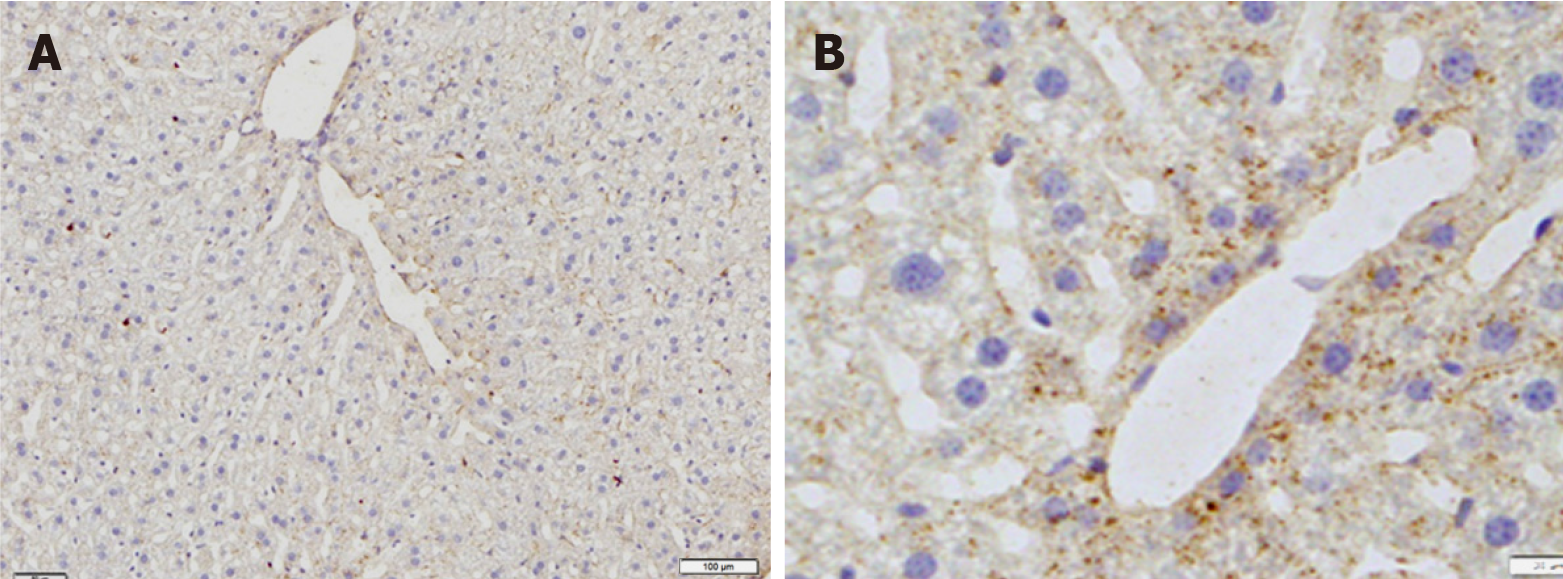
Figure 3 Immunostaining for Kir6.
1 in the liver of mice in the control group. A: Low magnification; B: High magnification. Bars: 100 μm (A); 20 μm (B).
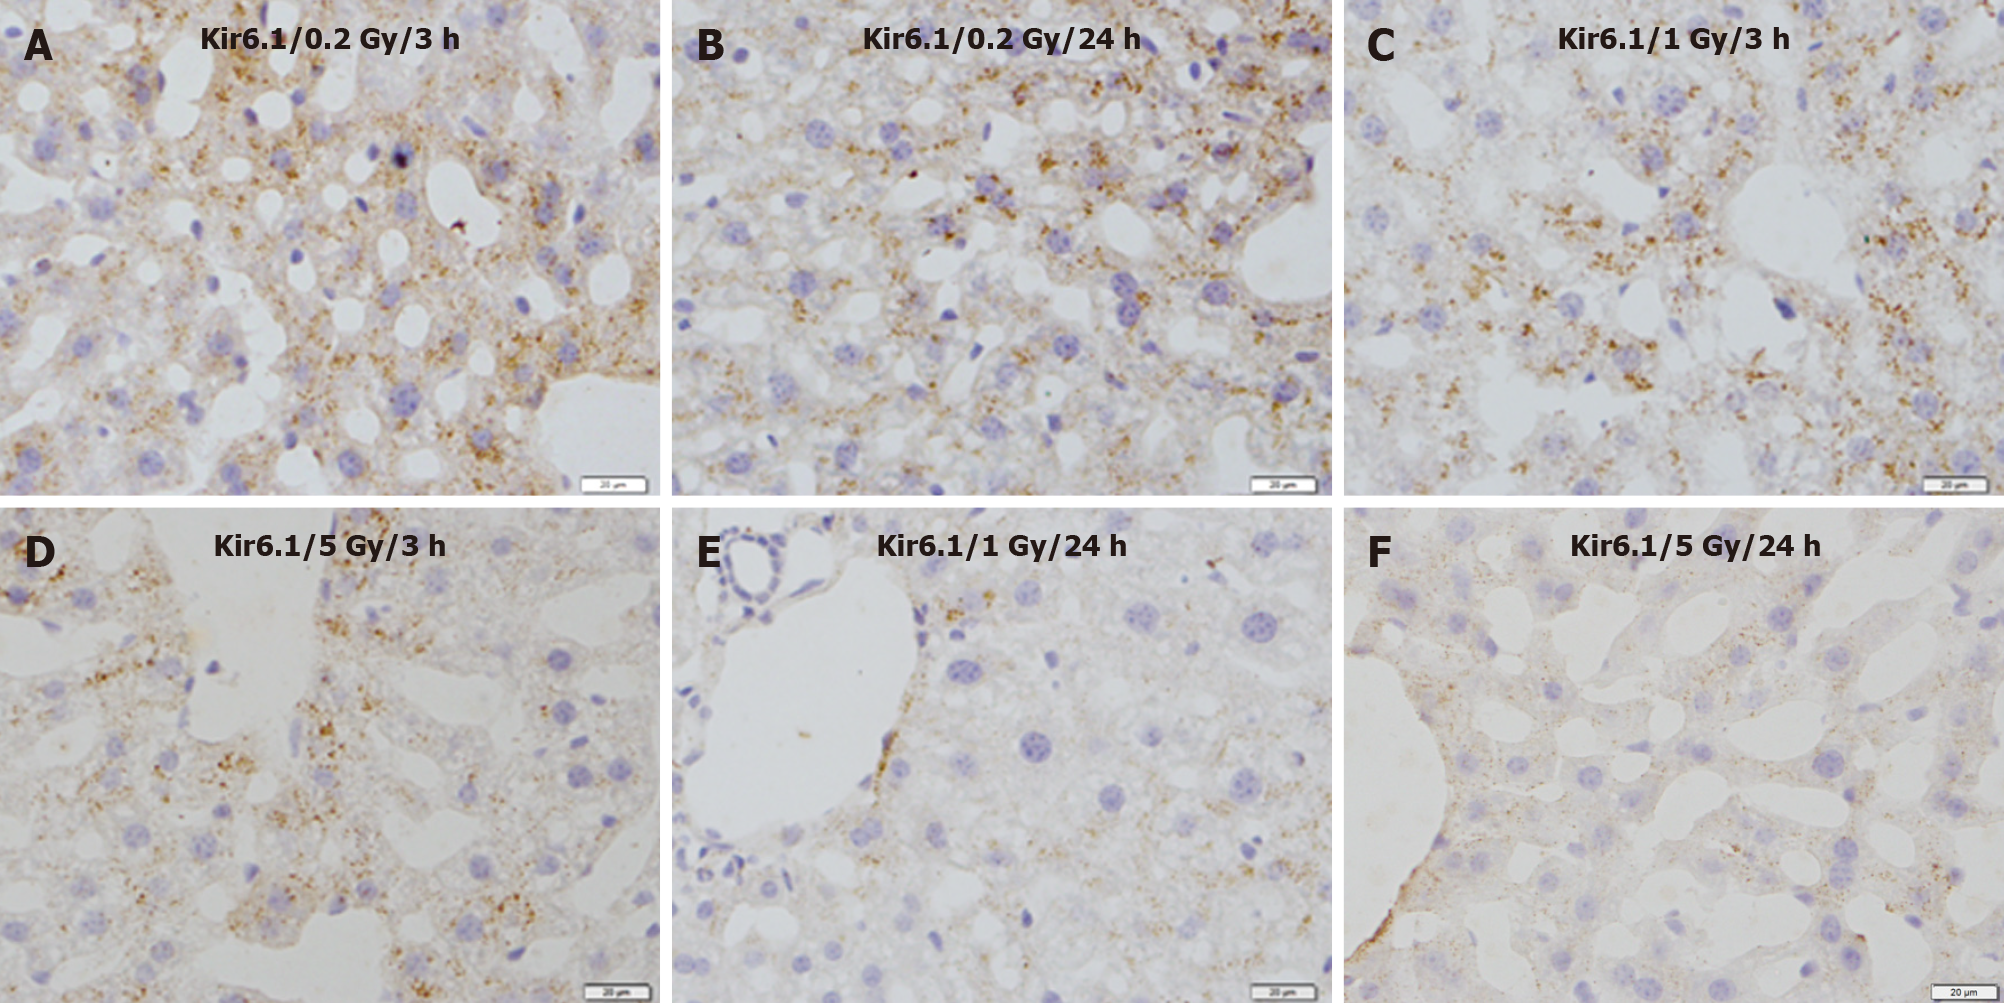
Figure 4 Immunostaining for Kir6.
1 in the liver of mice after γ-ray irradiation with different doses. A: 3 h after exposure to low dose (0.2 Gy); B: 24 h after exposure to low dose (0.2 Gy); C: 3 h after exposure to medium dose (1 Gy); D: 3 h after exposure to high dose (5 Gy); E: 24 h after exposure to medium dose (1 Gy); F: 24 h after exposure to high dose (5 Gy). Bars: 20 μm.
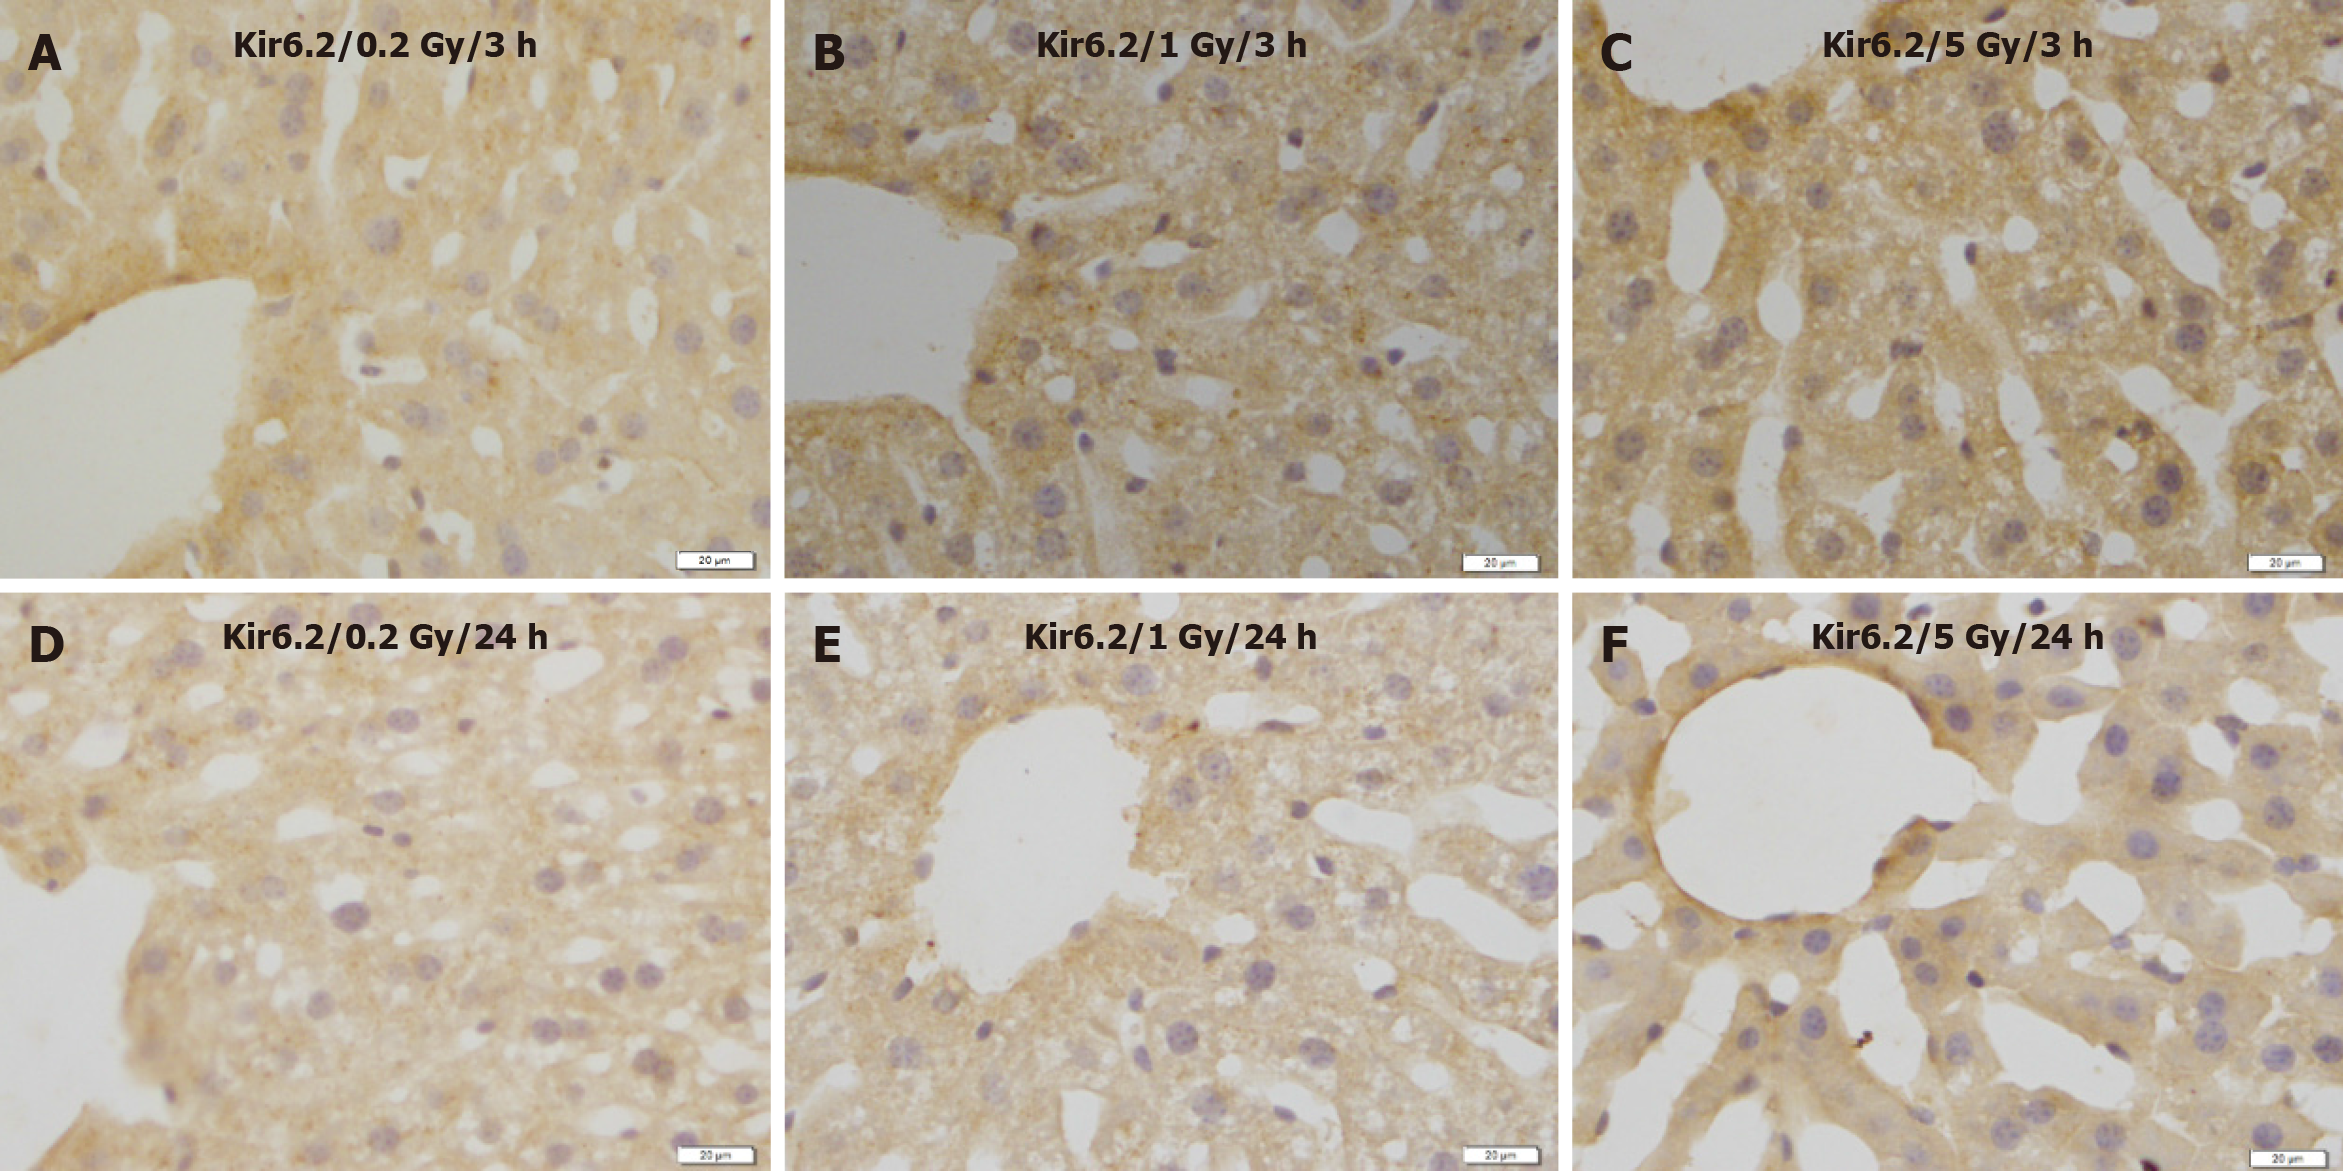
Figure 5 Immunostaining for Kir6.
2 in the liver of mice after γ-ray irradiation with different doses. Representative images show no remarkable change induced by irradiation. A: 3 h after exposure to low dose (0.2 Gy); B: 3 h after exposure to medium dose (1 Gy) ; C: 3 h after exposure to high dose (5 Gy); D: 24 h after exposure to low dose (0.2 Gy); E: 24 h after exposure to medium dose (1 Gy); F: 24 h after exposure to high dose (5 Gy). Bars: 20 μm.
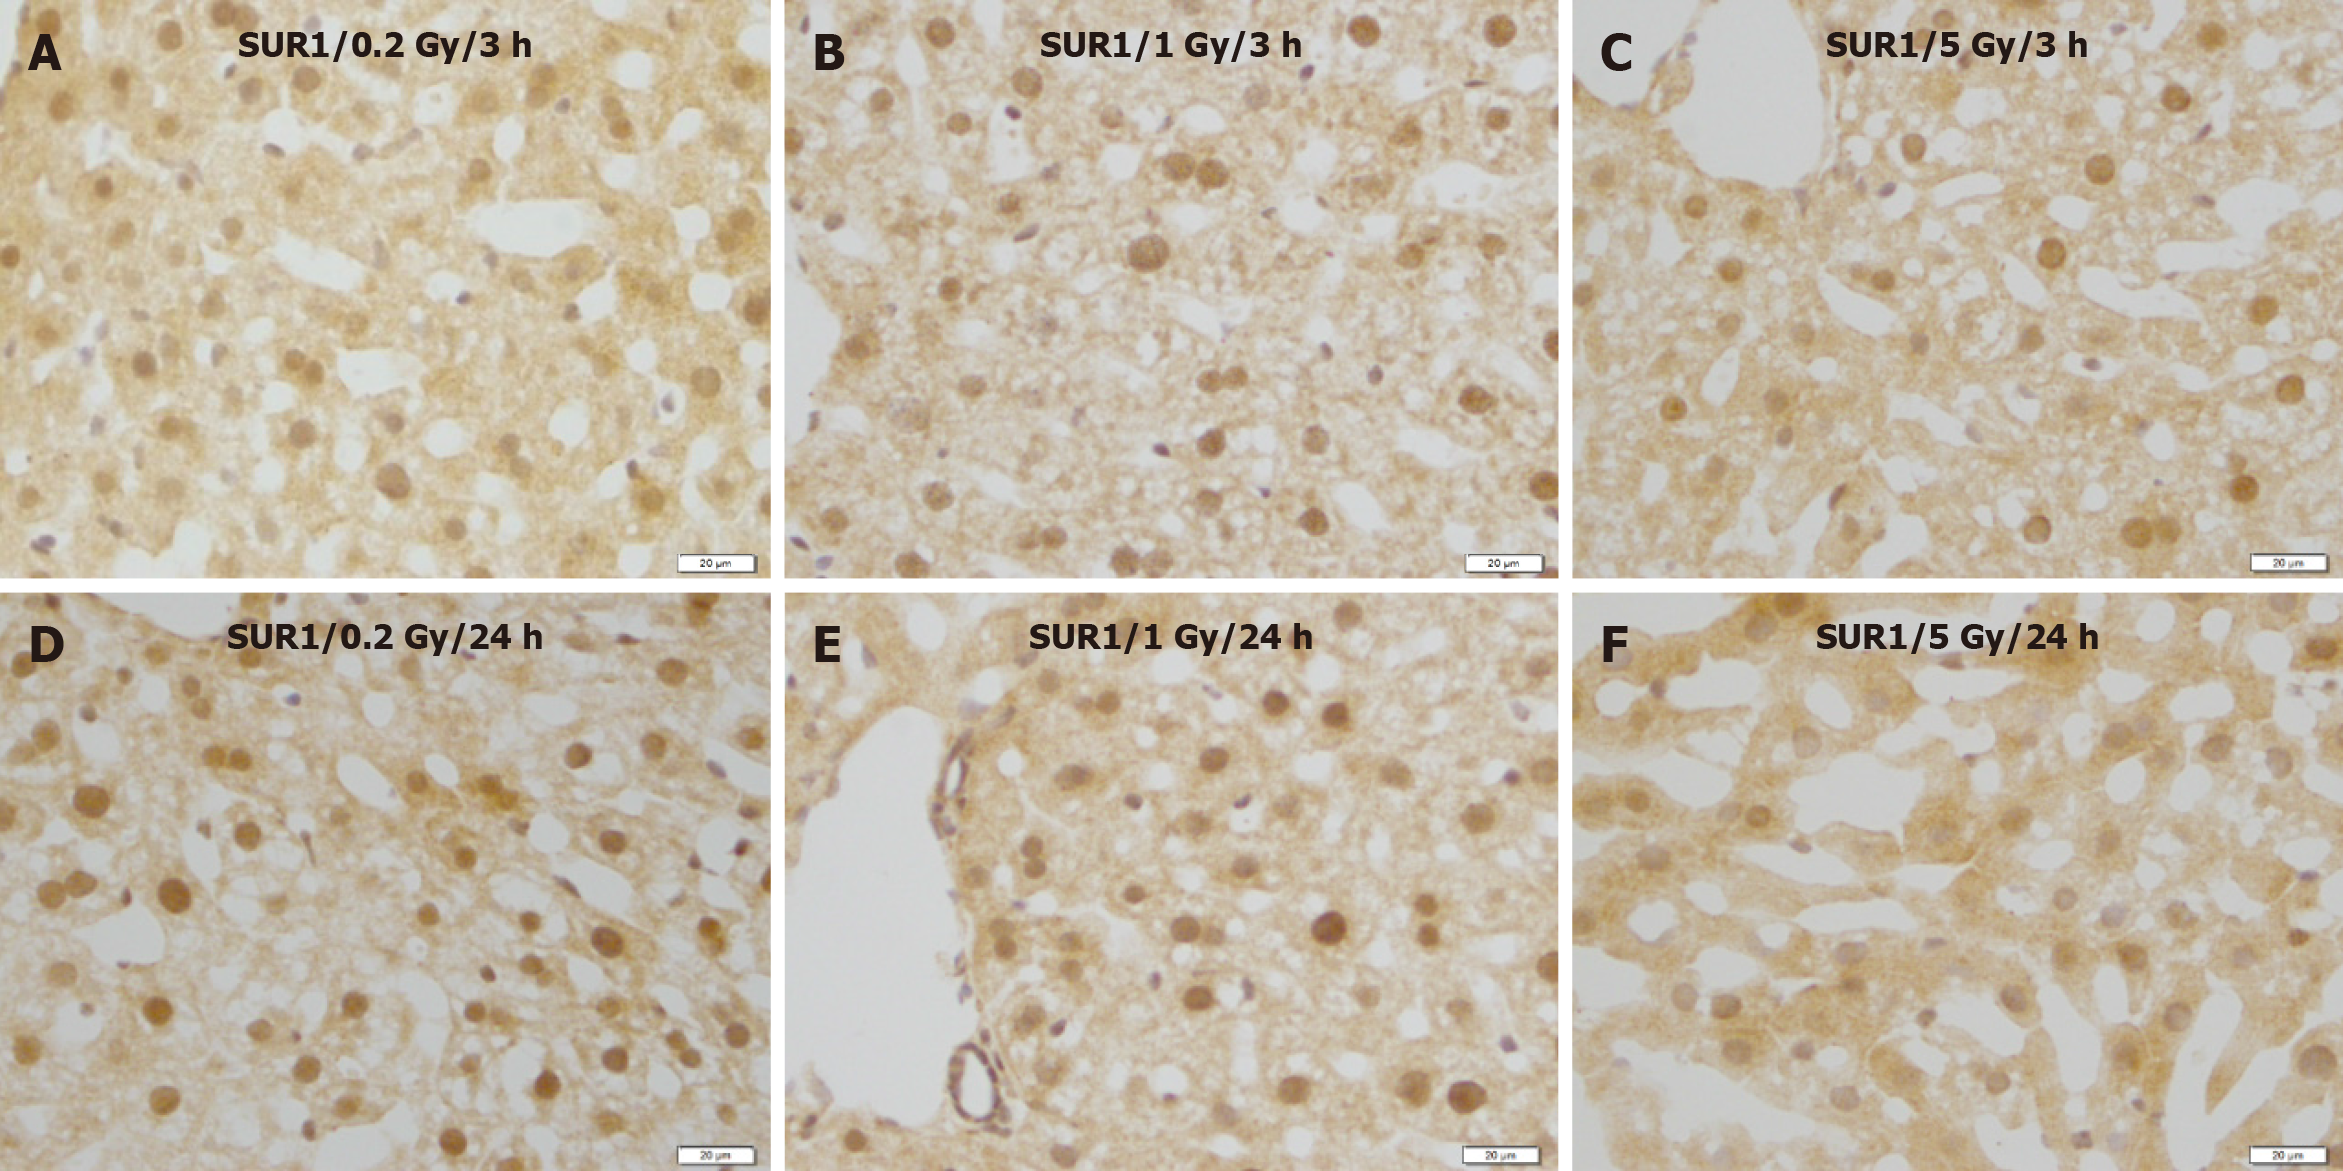
Figure 6 Immunostaining for SUR1 in the liver of mice after γ-ray irradiation with different doses.
These images show no remarkable changes in different time courses. A: 3 h after exposure to low dose (0.2 Gy); B: 3 h after exposure to medium dose (1 Gy); C: 3 h after exposure to high dose (5 Gy); D: 24 h after exposure to low dose (0.2 Gy); E: 24 h after exposure to medium dose (1 Gy); F: 24 h after exposure to high dose (5 Gy). Bars: 20 μm.
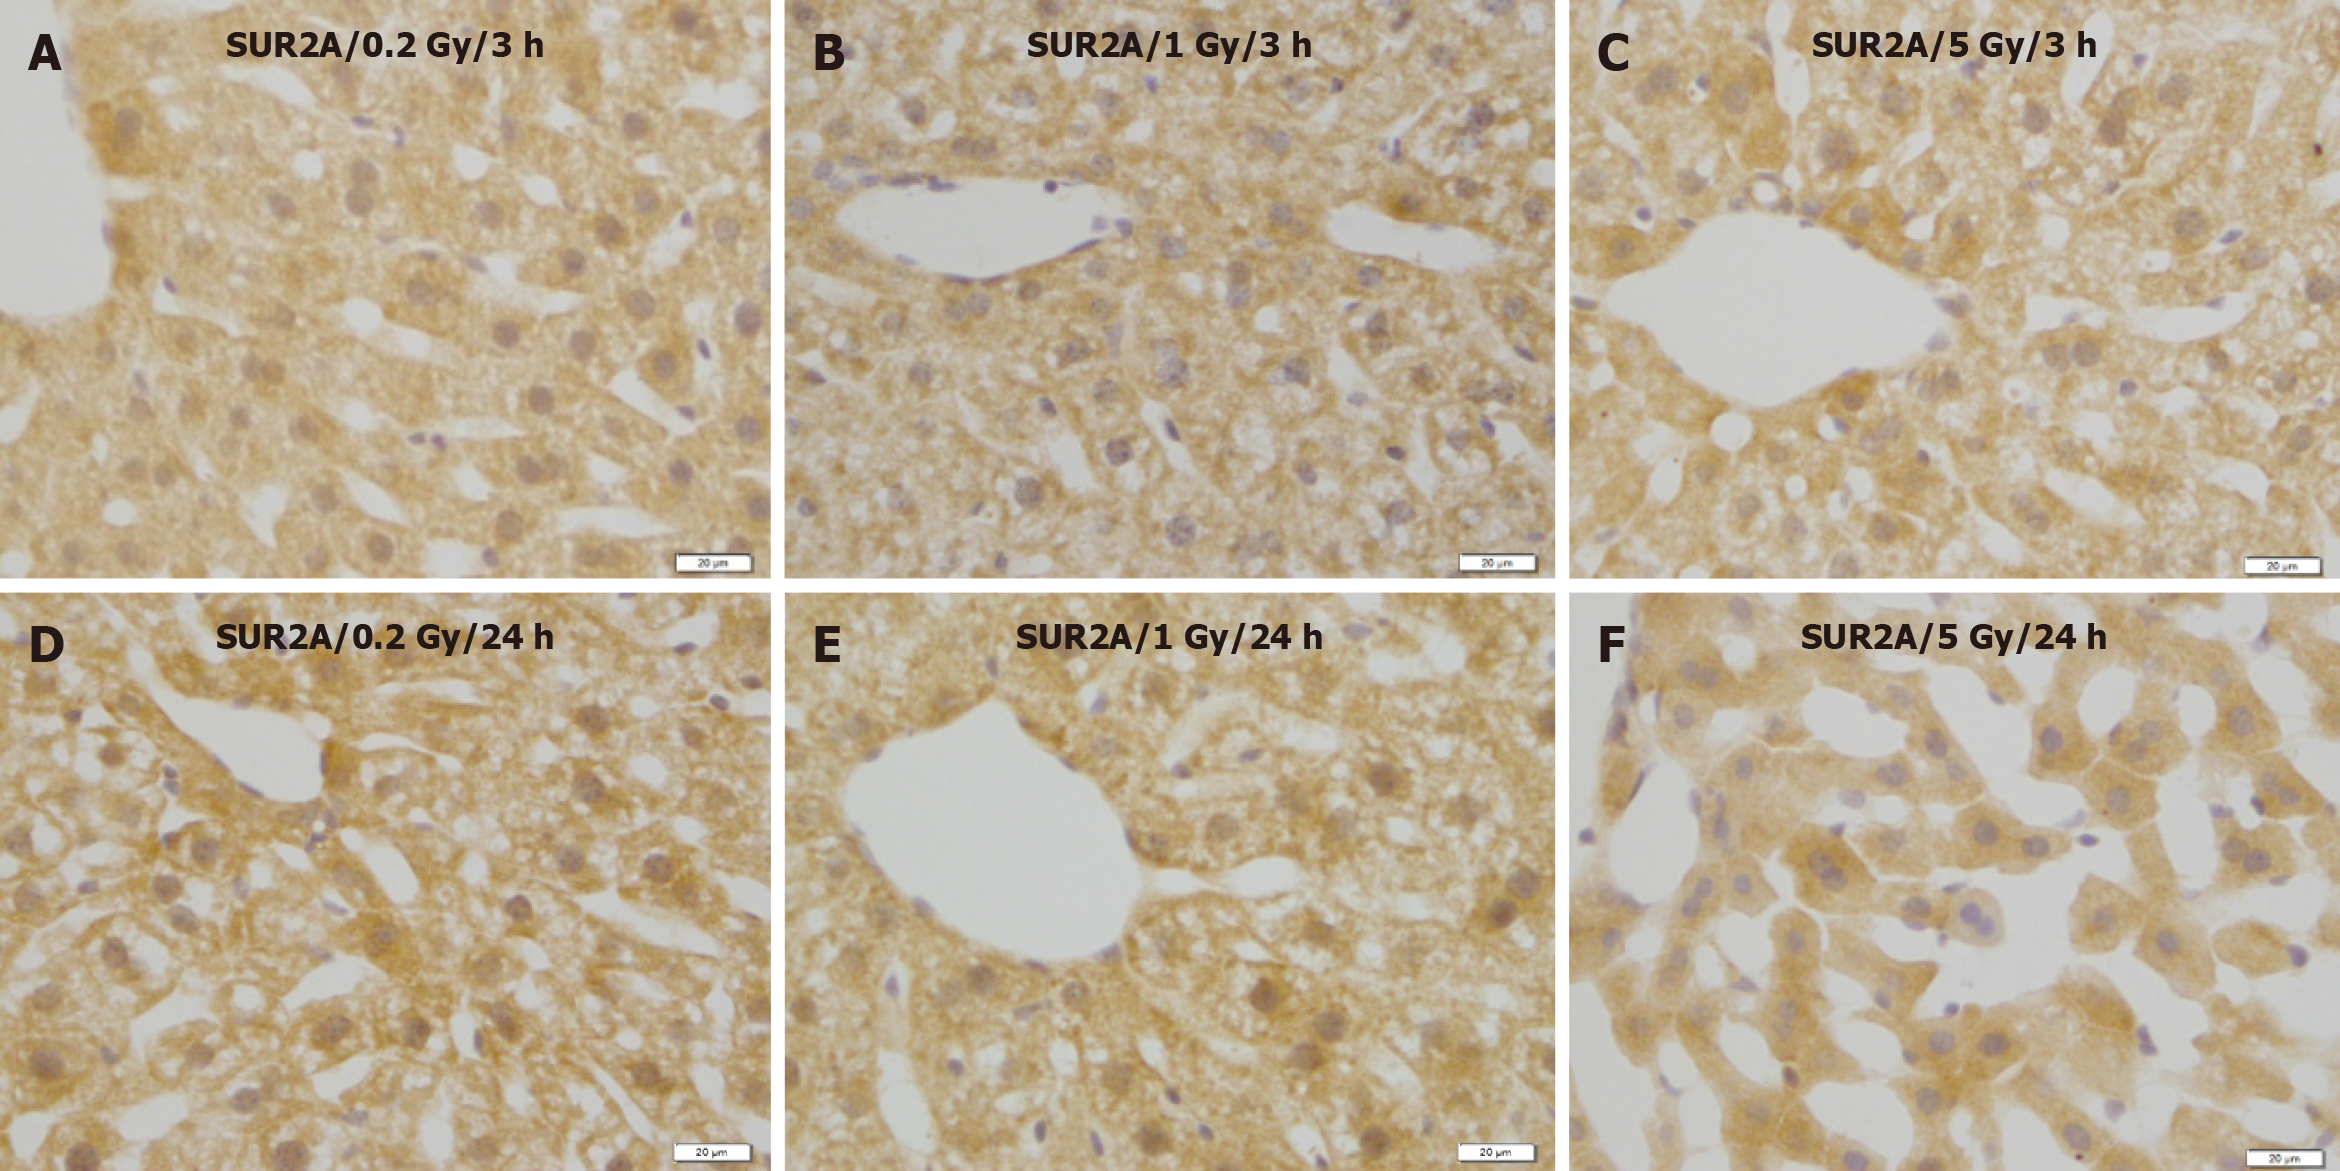
Figure 7 Immunostaining for SUR2A in the liver of mice after γ-ray irradiation with different doses.
A: 3 h after exposure to low dose (0.2 Gy); B: 3 h after exposure to medium dose (1 Gy); C: 3 h after exposure to high dose (5 Gy); D: 24 h after exposure to low dose (0.2 Gy); E: 24 h after exposure to medium dose (1 Gy); F: 24 h after exposure to high dose (5 Gy). Bars: 20 μm.
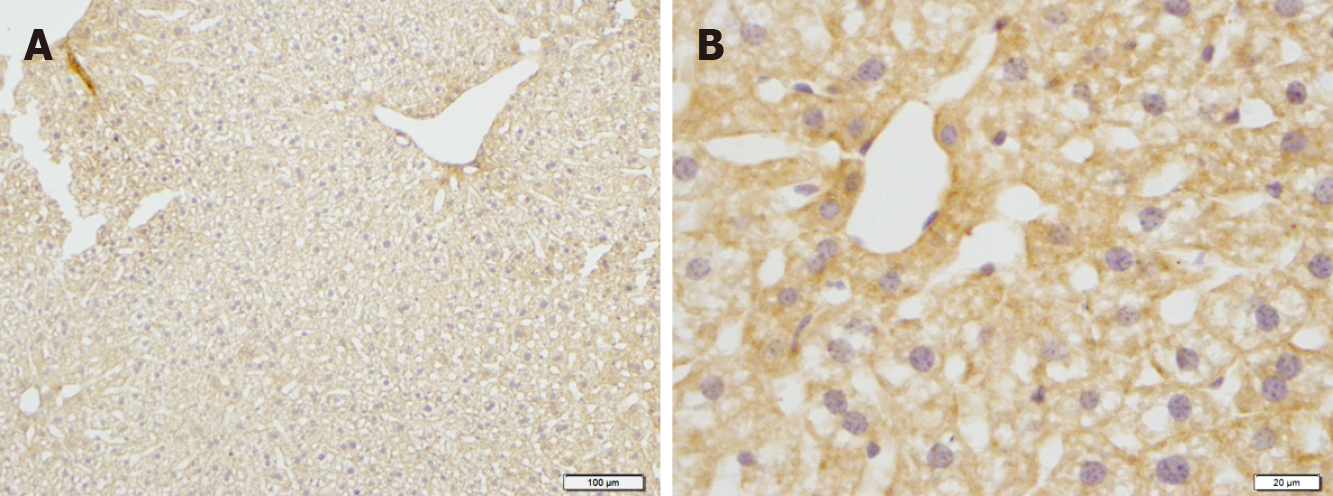
Figure 8 Immunostaining for SUR2B in the liver of mice in the control groups.
A: Low magnification image; B: High magnification image. Bars: 100 μm (A); 20 μm (B).
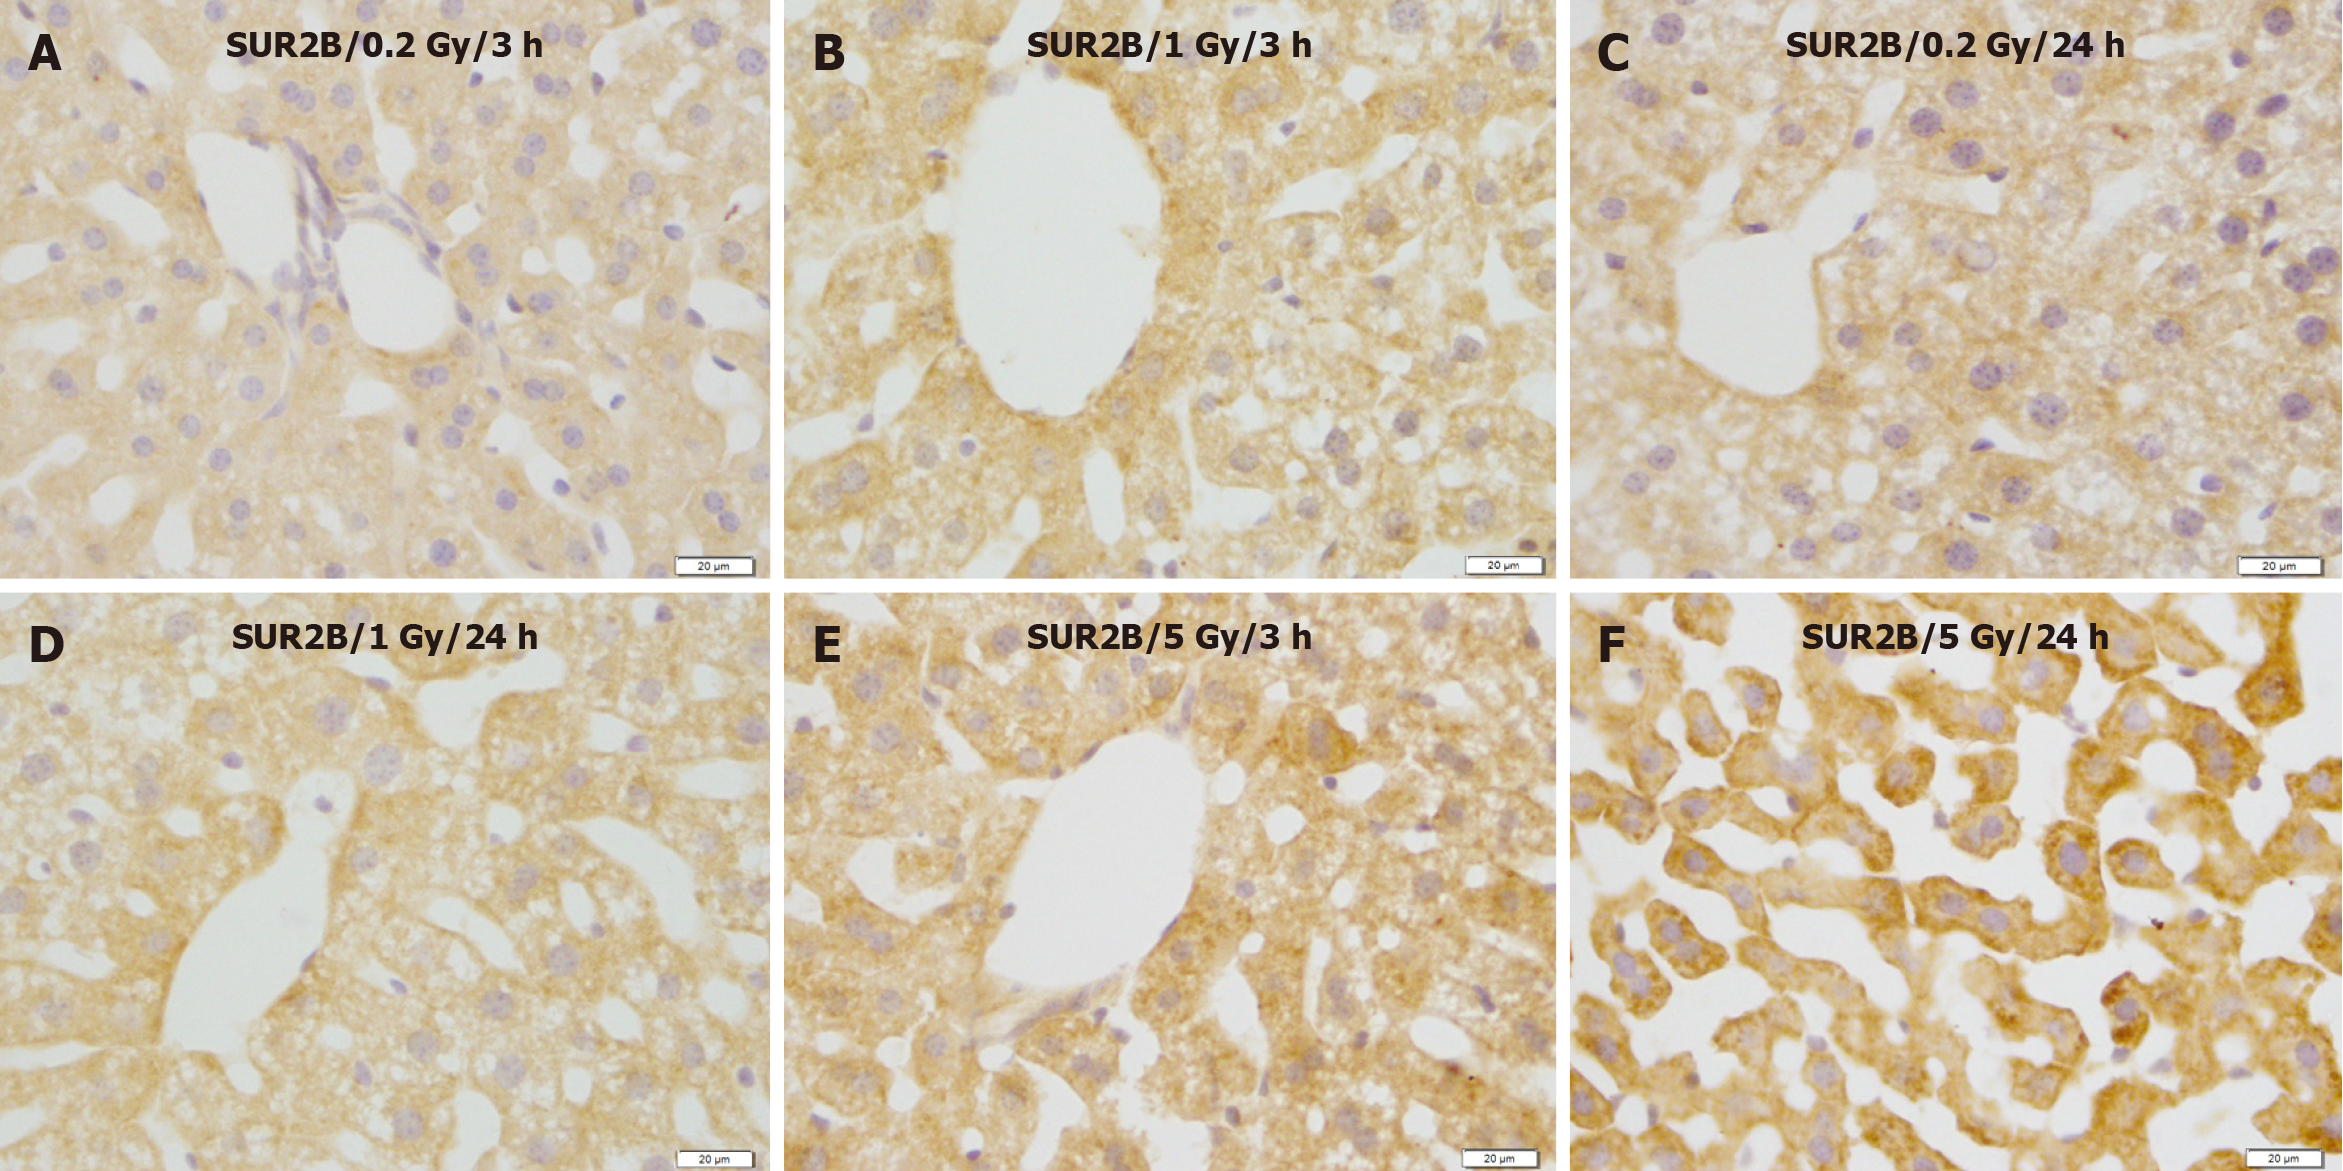
Figure 9 Immunostaining for SUR2B in the liver of mice after γ-ray irradiation with different doses.
SUR2B expression showed no obvious change 3 and 24 h after exposure to 0.2 and 1.0 Gy, but increased remarkably 24 h after exposure to 5 Gy. A: 3 h after exposure to low dose (0.2 Gy); B: 3 h after exposure to medium dose (1 Gy); C: 24 h after exposure to low dose (0.2 Gy); D: 24 h after exposure to medium dose (1 Gy); E: 3 h after exposure to high dose (5 Gy); F: 24 h after exposure to high dose (5 Gy). Bars: 20 μm.
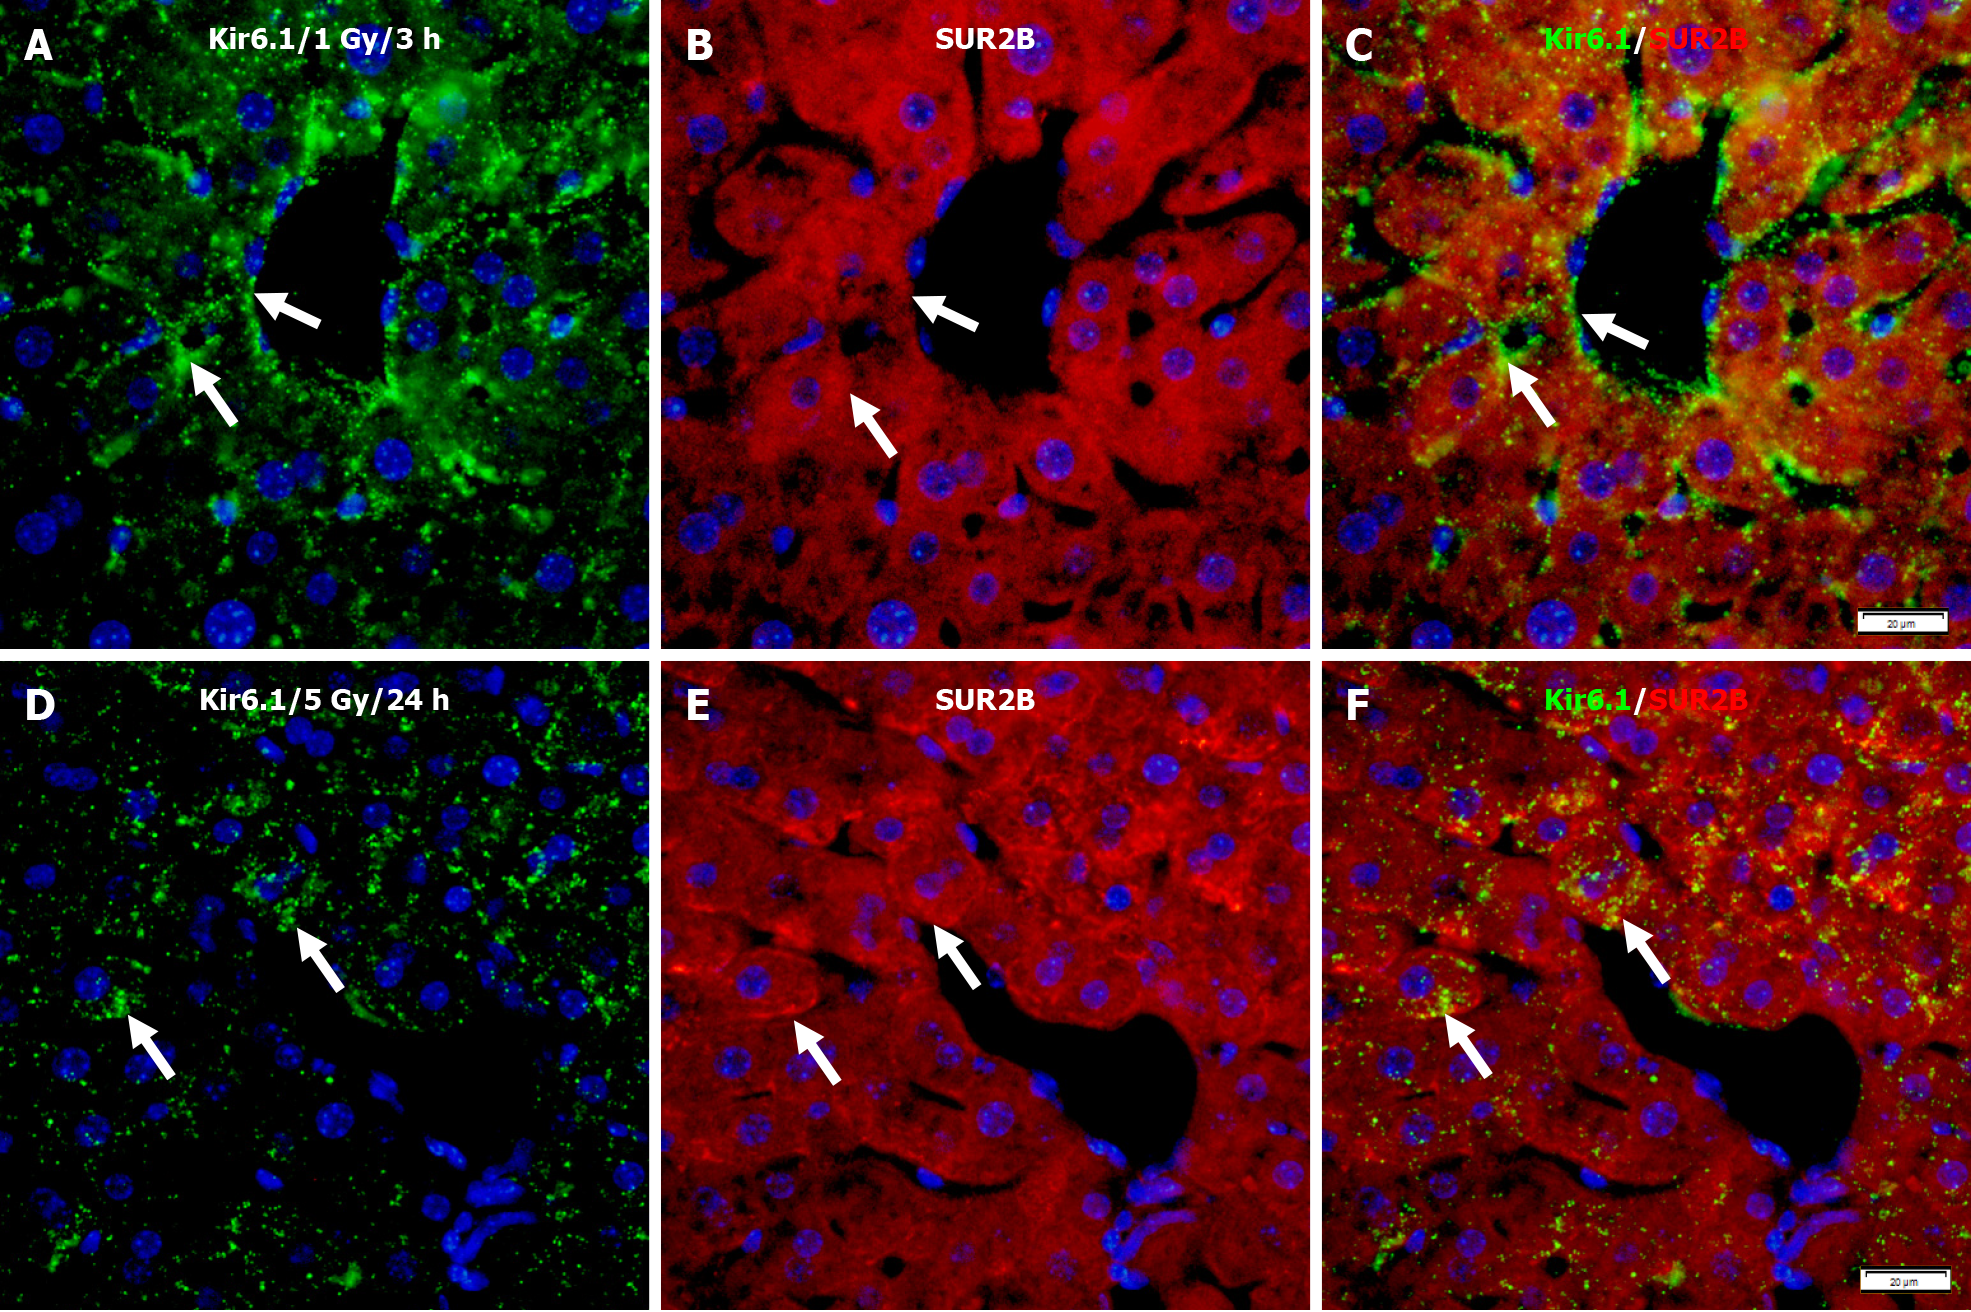
Figure 10 Immunofluorescence double staining for Kir6.
1 and SUR2B in the liver of mice after irradiation with different doses. A-C: Representative images show the expression of Kir6.1 alone (green, A), SUR2B alone (red, B), and their co-localization (white arrows, C) 3 h after 1 Gy exposure; D-F: Representative images show the expression of Kir6.1 alone (green, D), SUR2B alone (red, E), and their co-localization (F) 24 h after 5 Gy exposure (white arrows, F). Bars: 20 μm.
- Citation: Zhou M, Li TS, Abe H, Akashi H, Suzuki R, Bando Y. Expression levels of KATP channel subunits and morphological changes in the mouse liver after exposure to radiation. World J Exp Med 2024; 14(2): 90374
- URL: https://www.wjgnet.com/2220-315x/full/v14/i2/90374.htm
- DOI: https://dx.doi.org/10.5493/wjem.v14.i2.90374


