Copyright
©The Author(s) 2025.
World J Exp Med. Sep 20, 2025; 15(3): 107711
Published online Sep 20, 2025. doi: 10.5493/wjem.v15.i3.107711
Published online Sep 20, 2025. doi: 10.5493/wjem.v15.i3.107711
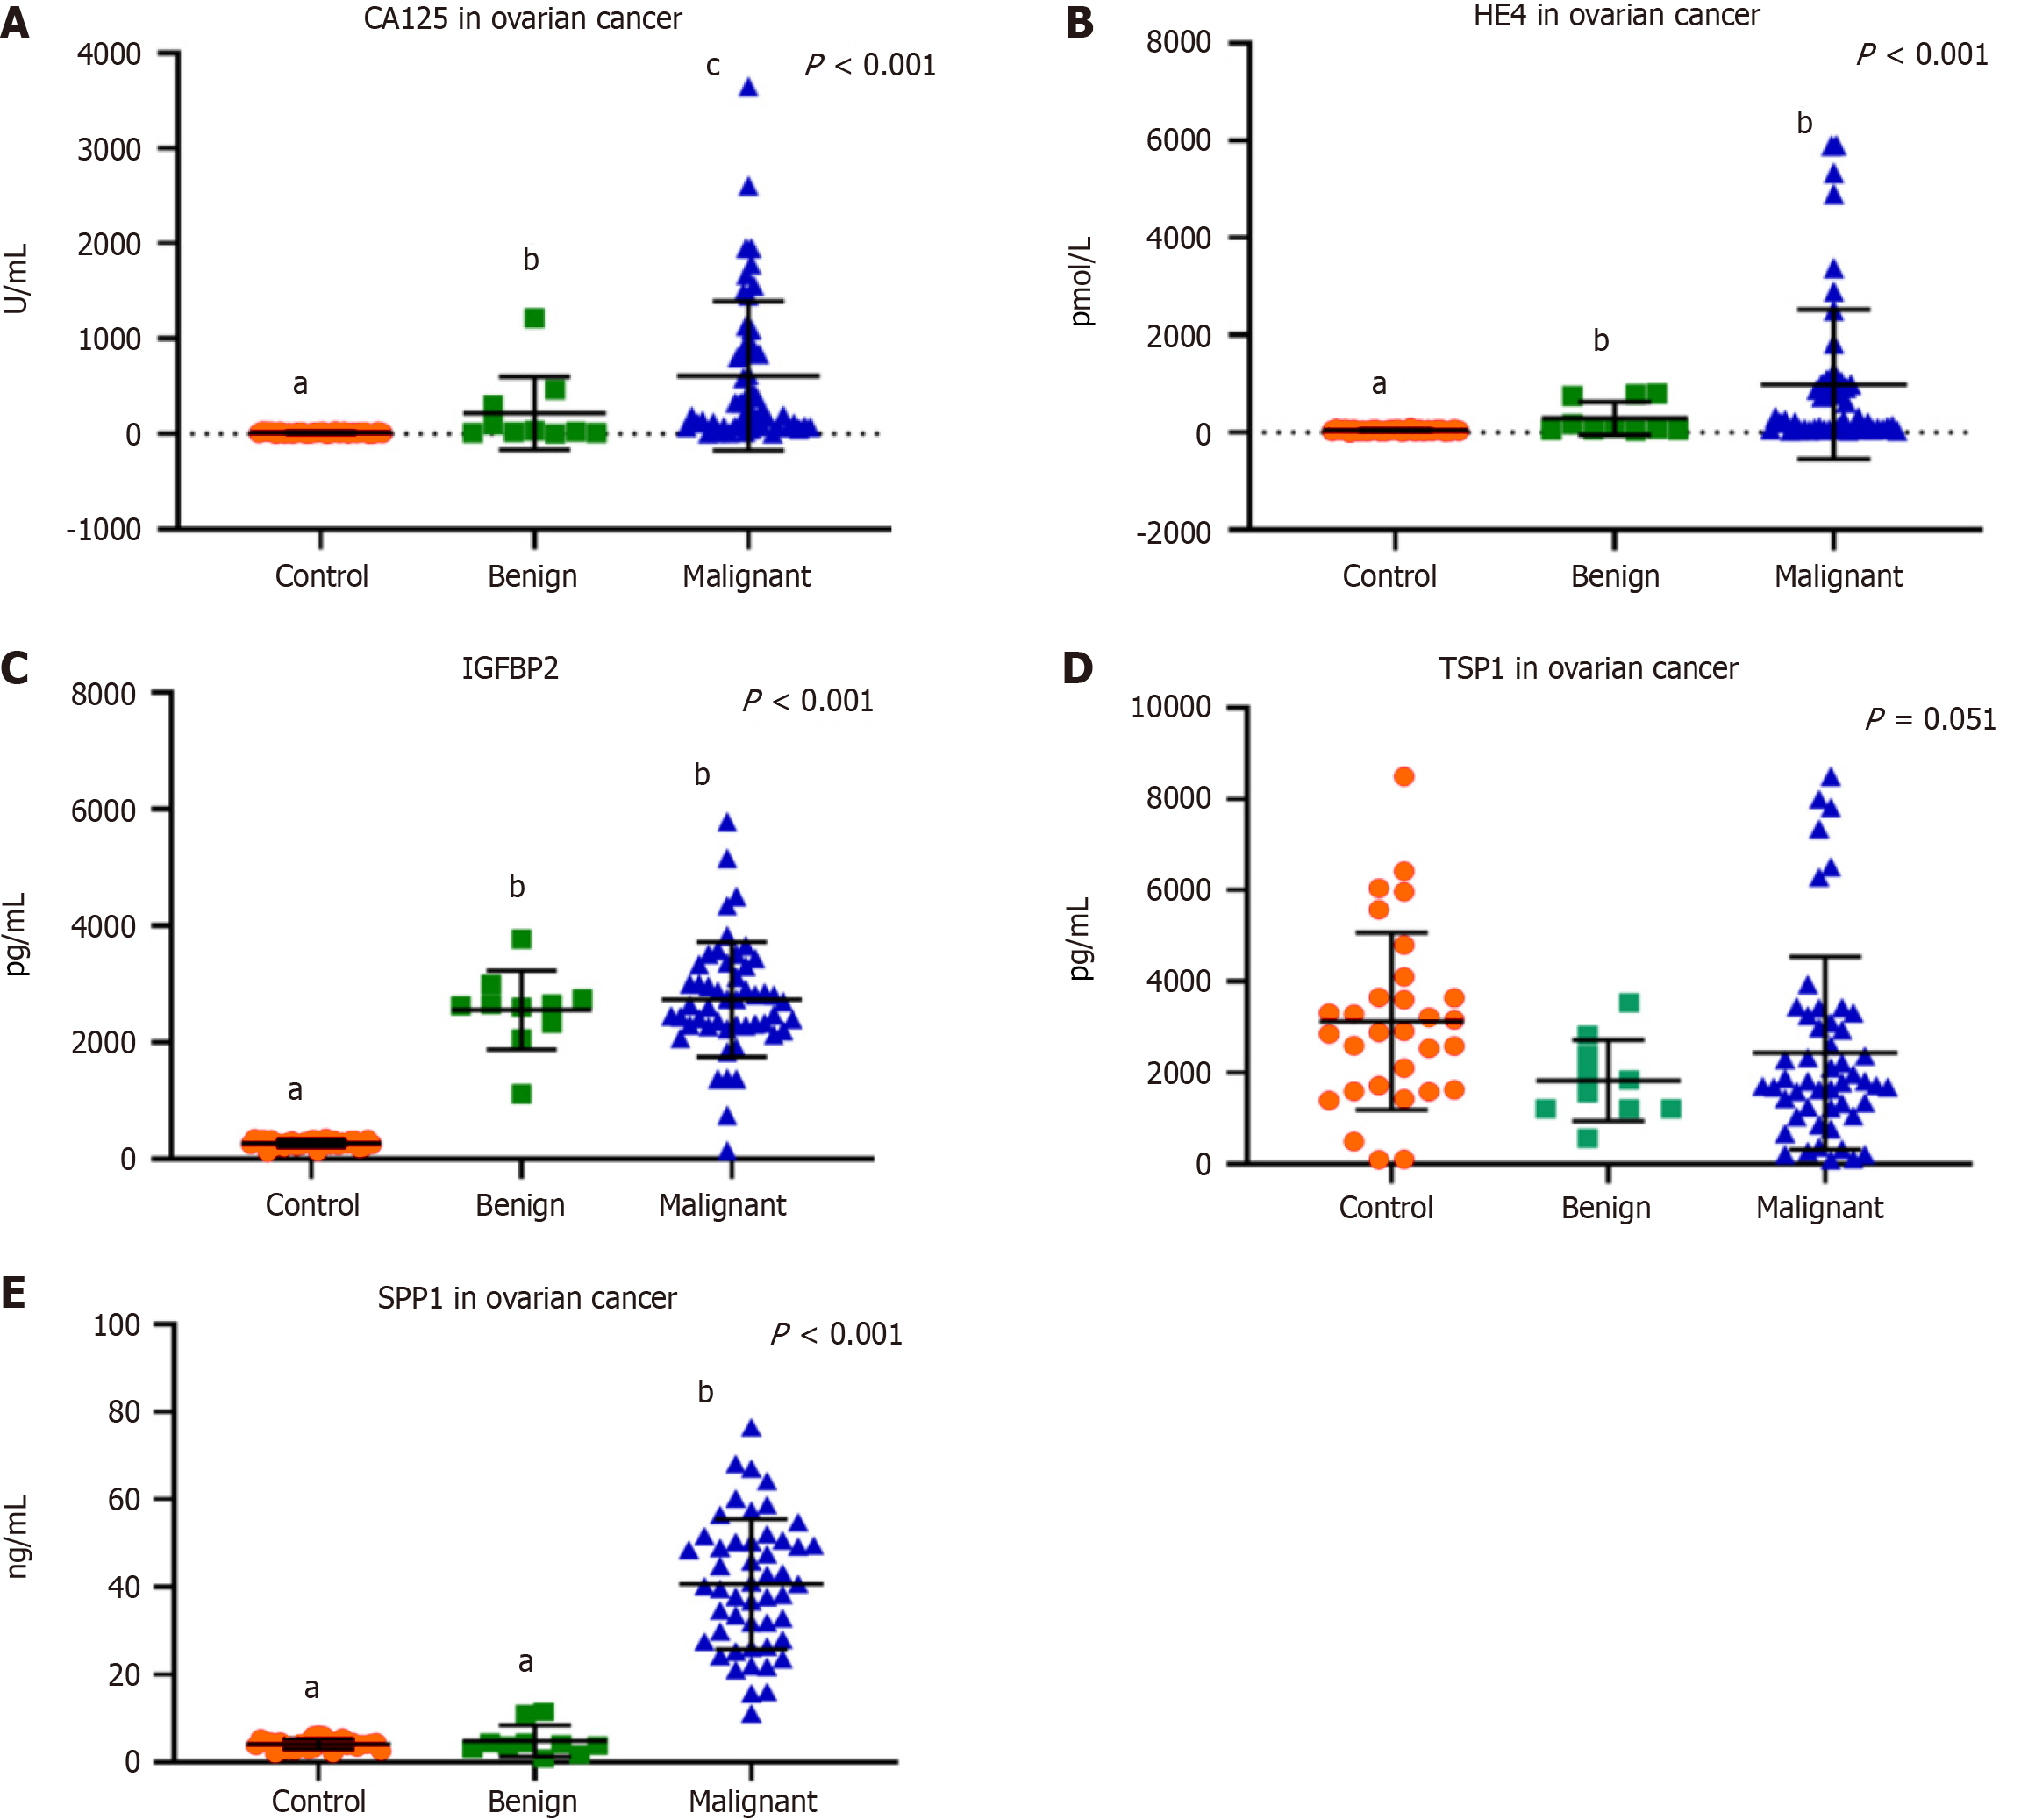
Figure 1 Differential expression levels in patients with benign ovarian masses (10 patients), epithelial ovarian cancer (50 patients), and healthy control (30 females).
A: Cancer antigen 125; B: Human epididymis protein 4; C: Insulin-like growth factors-binding proteins 2; D: Thrombospondin 1 protein; E: Secreted phosphoprotein 1. aP < 0.05, bP < 0.01, cP < 0.001. CA125: Cancer antigen 125; HE4: Human epididymis protein 4; IGFBP2: Insulin-like growth factors-binding proteins 2; SPP1: Secreted phosphoprotein 1; TSP1: Thrombospondin 1 protein.
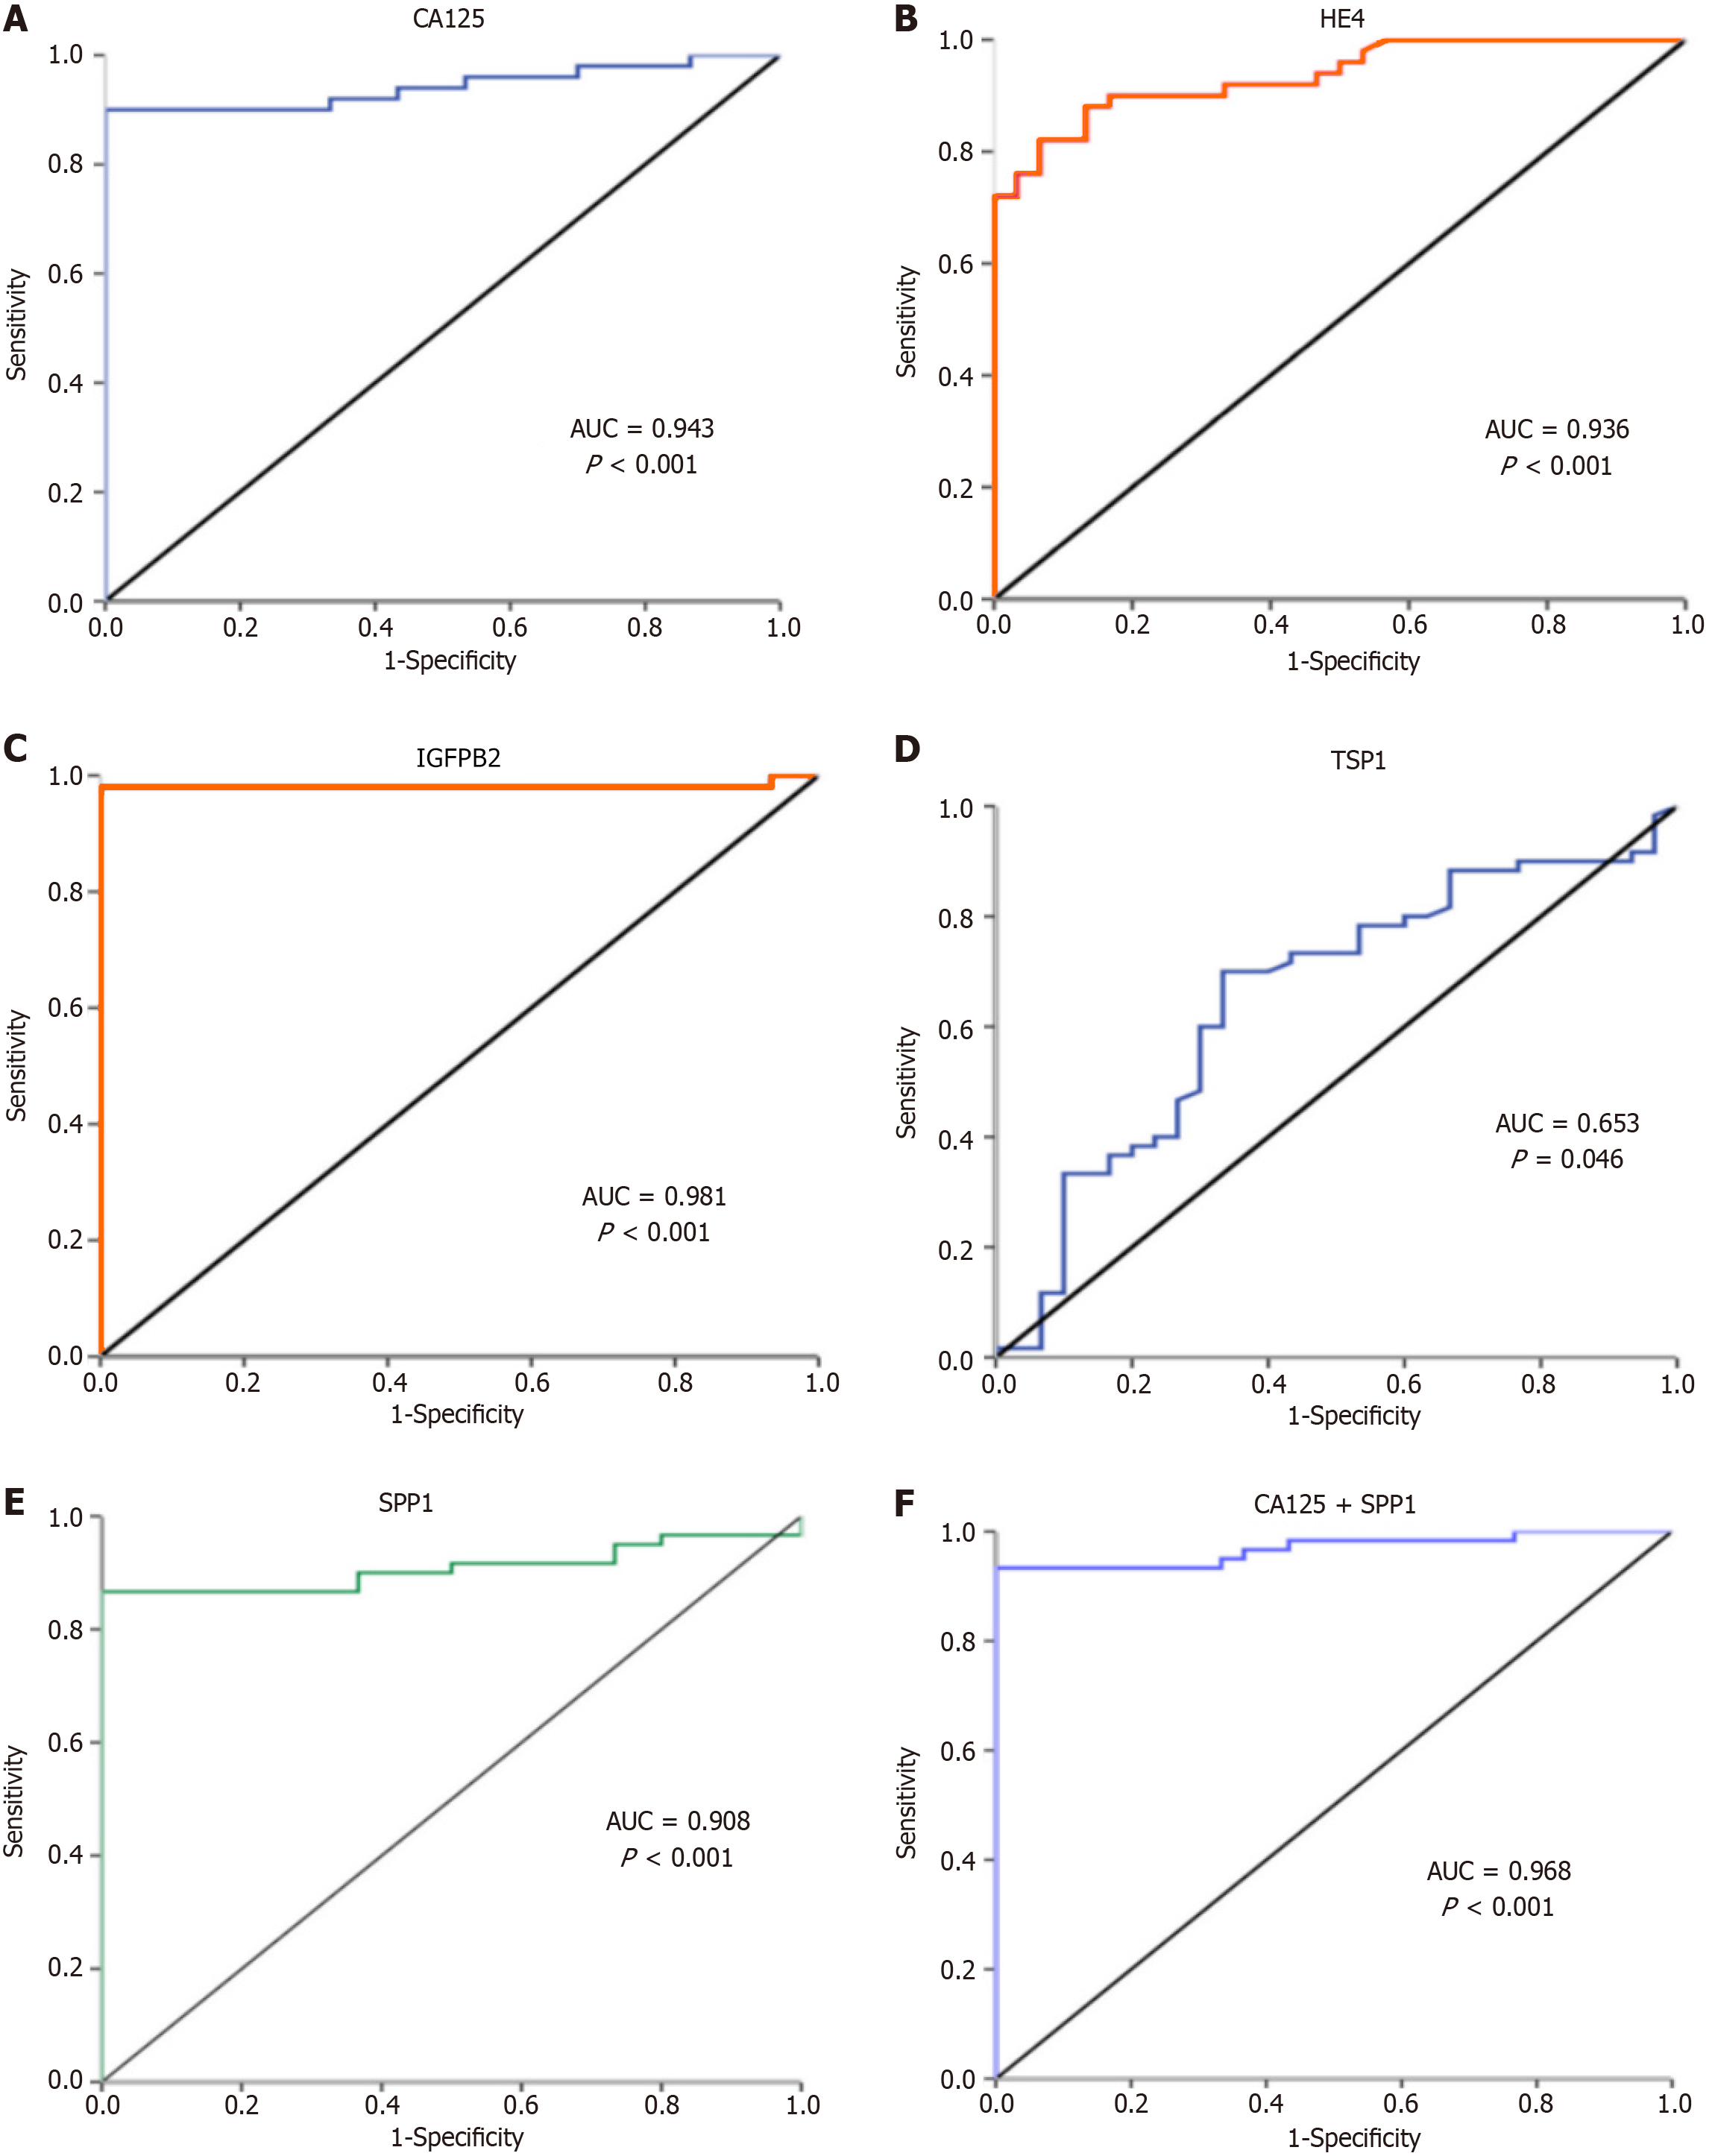
Figure 2 Area under the receiver operating characteristic curve analysis to differentiate between epithelial ovarian cancer (50 patients) patients and healthy control (30 females).
A: Cancer antigen 125 (CA125); B: Human epididymis protein 4; C: Insulin-like growth factors-binding proteins 2; D: Thrombospondin 1 protein; E: Secreted phosphoprotein 1 (SPP1); F: Combined CA125 + SPP1. CA125: Cancer antigen 125; HE4: Human epididymis protein 4; IGFBP2: Insulin-like growth factors-binding proteins 2; SPP1: Secreted phosphoprotein 1; TSP1: Thrombospondin 1 protein.
- Citation: Ibrahim NH, Abdellateif MS, Serag DS, Laymouna A, Elaguizy MS, Halim RMA. Clinical significance of differential plasma proteins levels in the diagnosis of epithelial ovarian cancer. World J Exp Med 2025; 15(3): 107711
- URL: https://www.wjgnet.com/2220-315X/full/v15/i3/107711.htm
- DOI: https://dx.doi.org/10.5493/wjem.v15.i3.107711


