Copyright
©The Author(s) 2023.
World J Exp Med. Jun 20, 2023; 13(3): 28-46
Published online Jun 20, 2023. doi: 10.5493/wjem.v13.i3.28
Published online Jun 20, 2023. doi: 10.5493/wjem.v13.i3.28
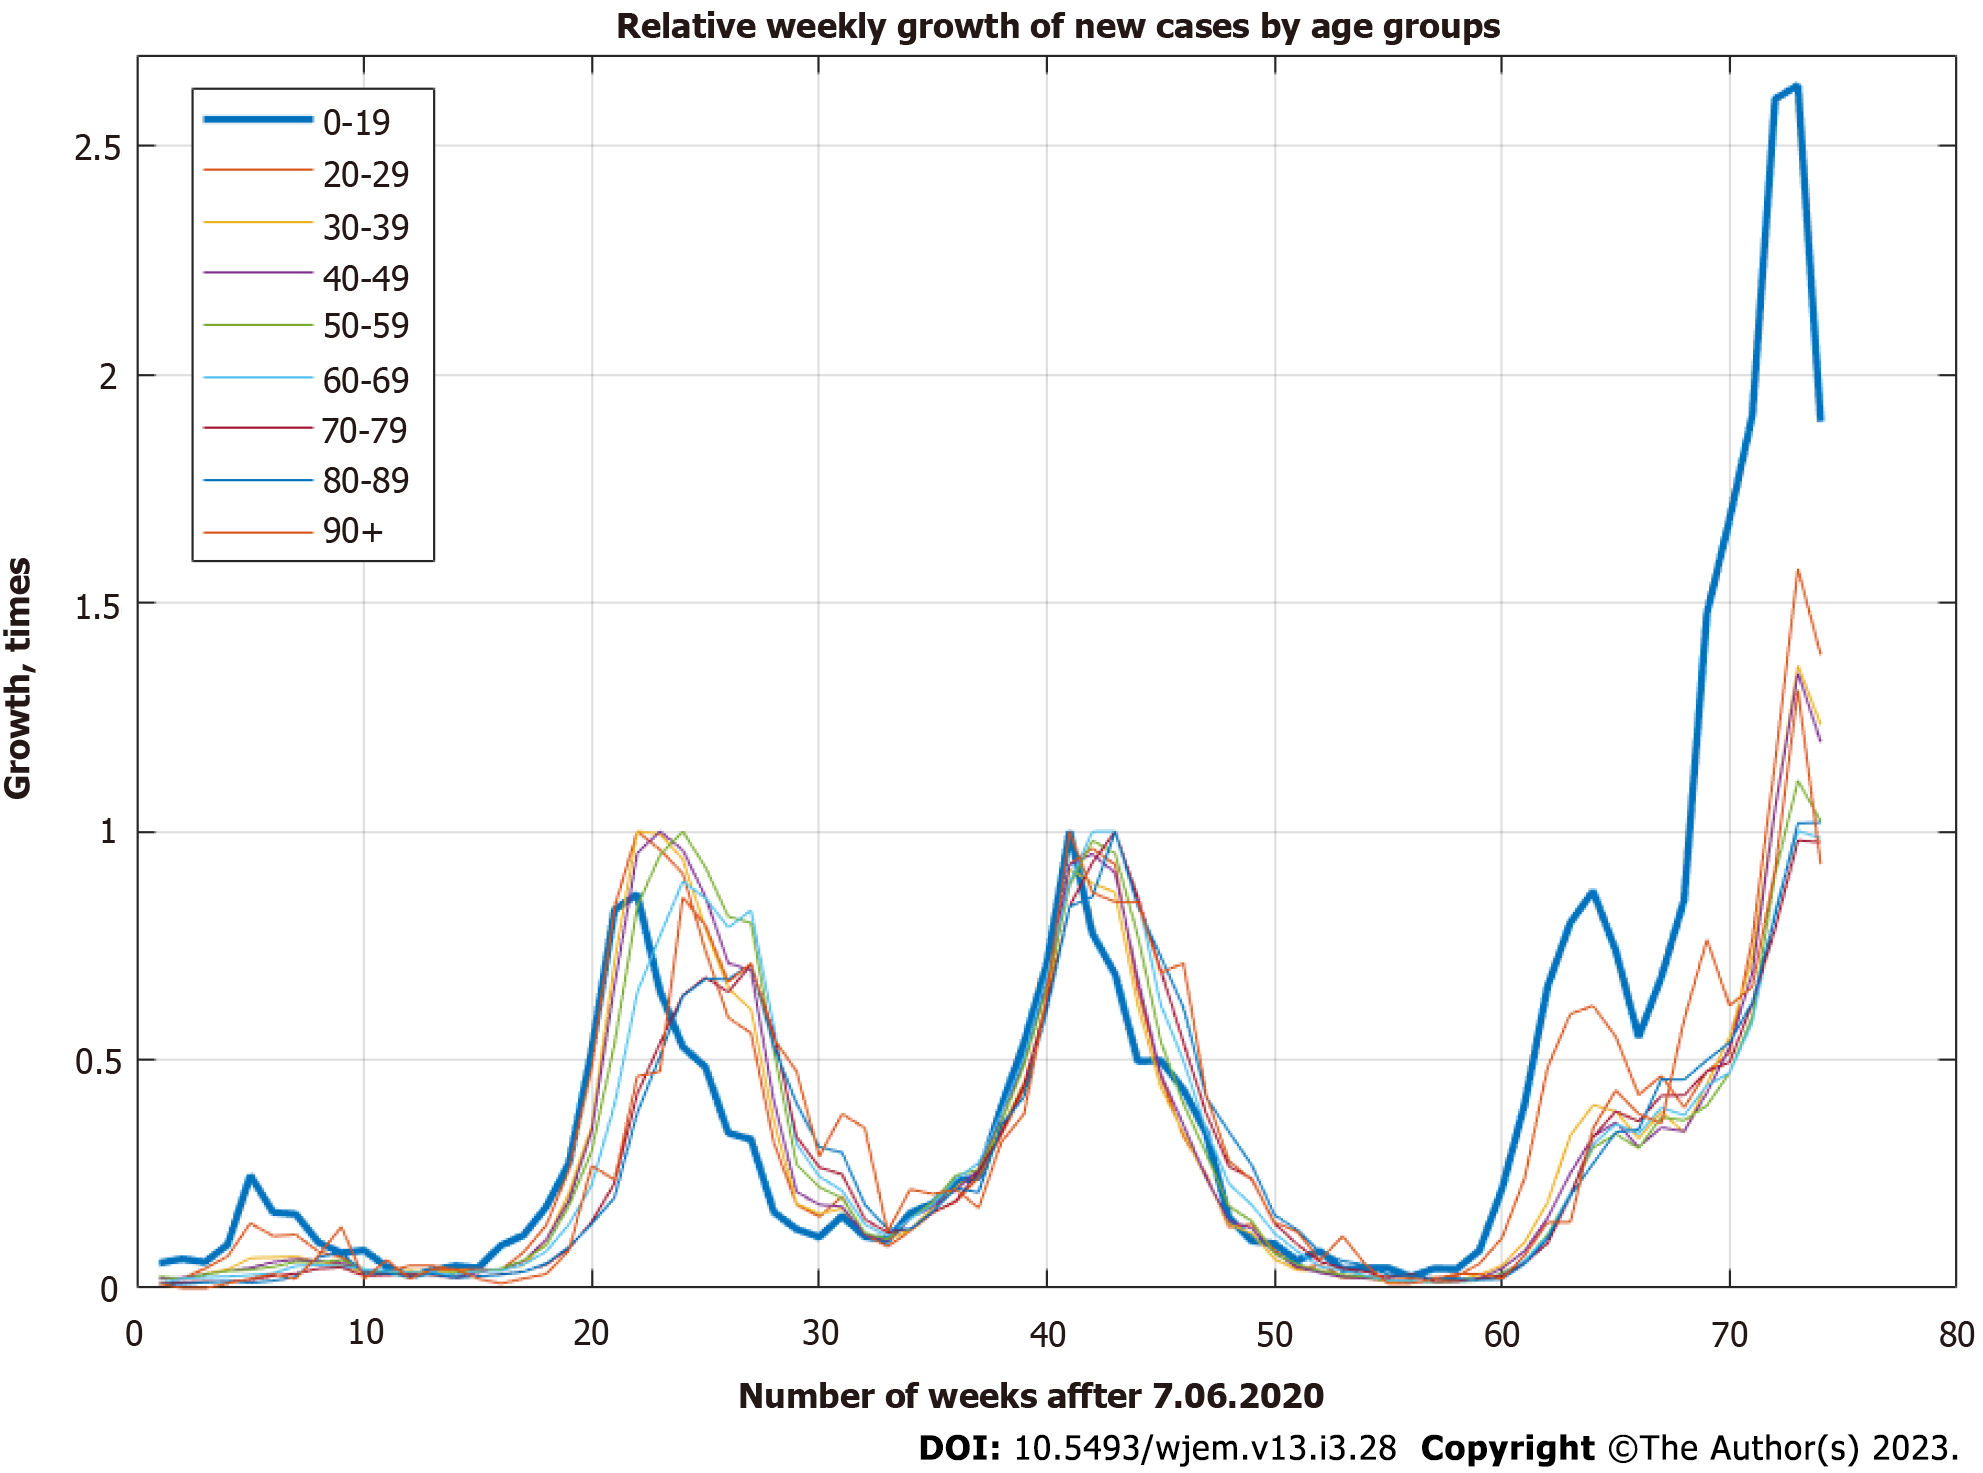
Figure 1 Relative growth of cases by age groups.
An apparent lag between 0-19 and others can be seen.
Figure 2 Sample cross-correlation function between new weekly cases of coronavirus disease 2019 and multisystem inflammation in children cases.
MIS-C: Multisystem inflammation in children.
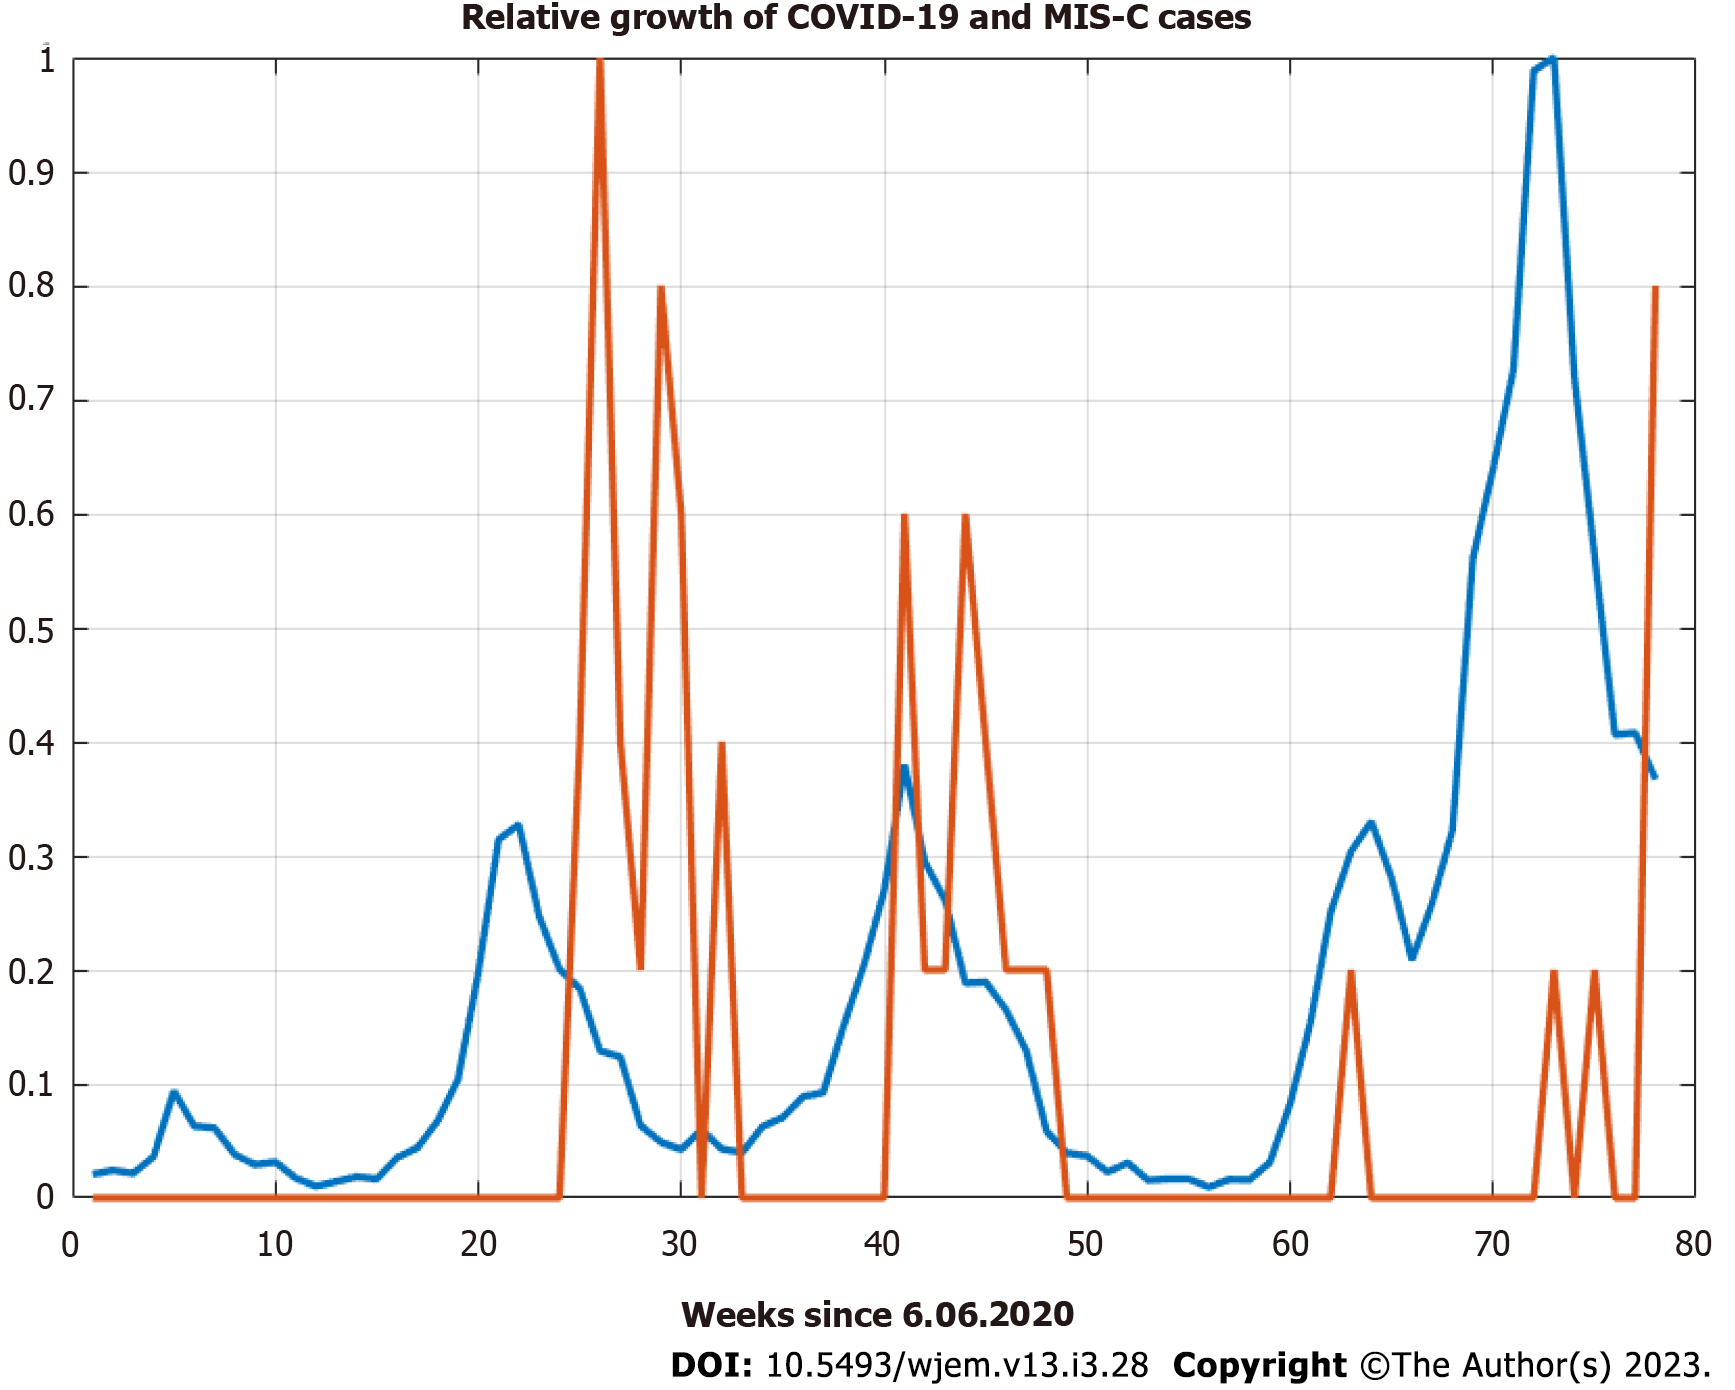
Figure 3 Relative growth of national-level coronavirus disease 2019 cases and multisystem inflammation in children cases in Pirogov Hospital.
COVID-19: Coronavirus disease 2019; MIS-C: Multisystem inflammation in children.
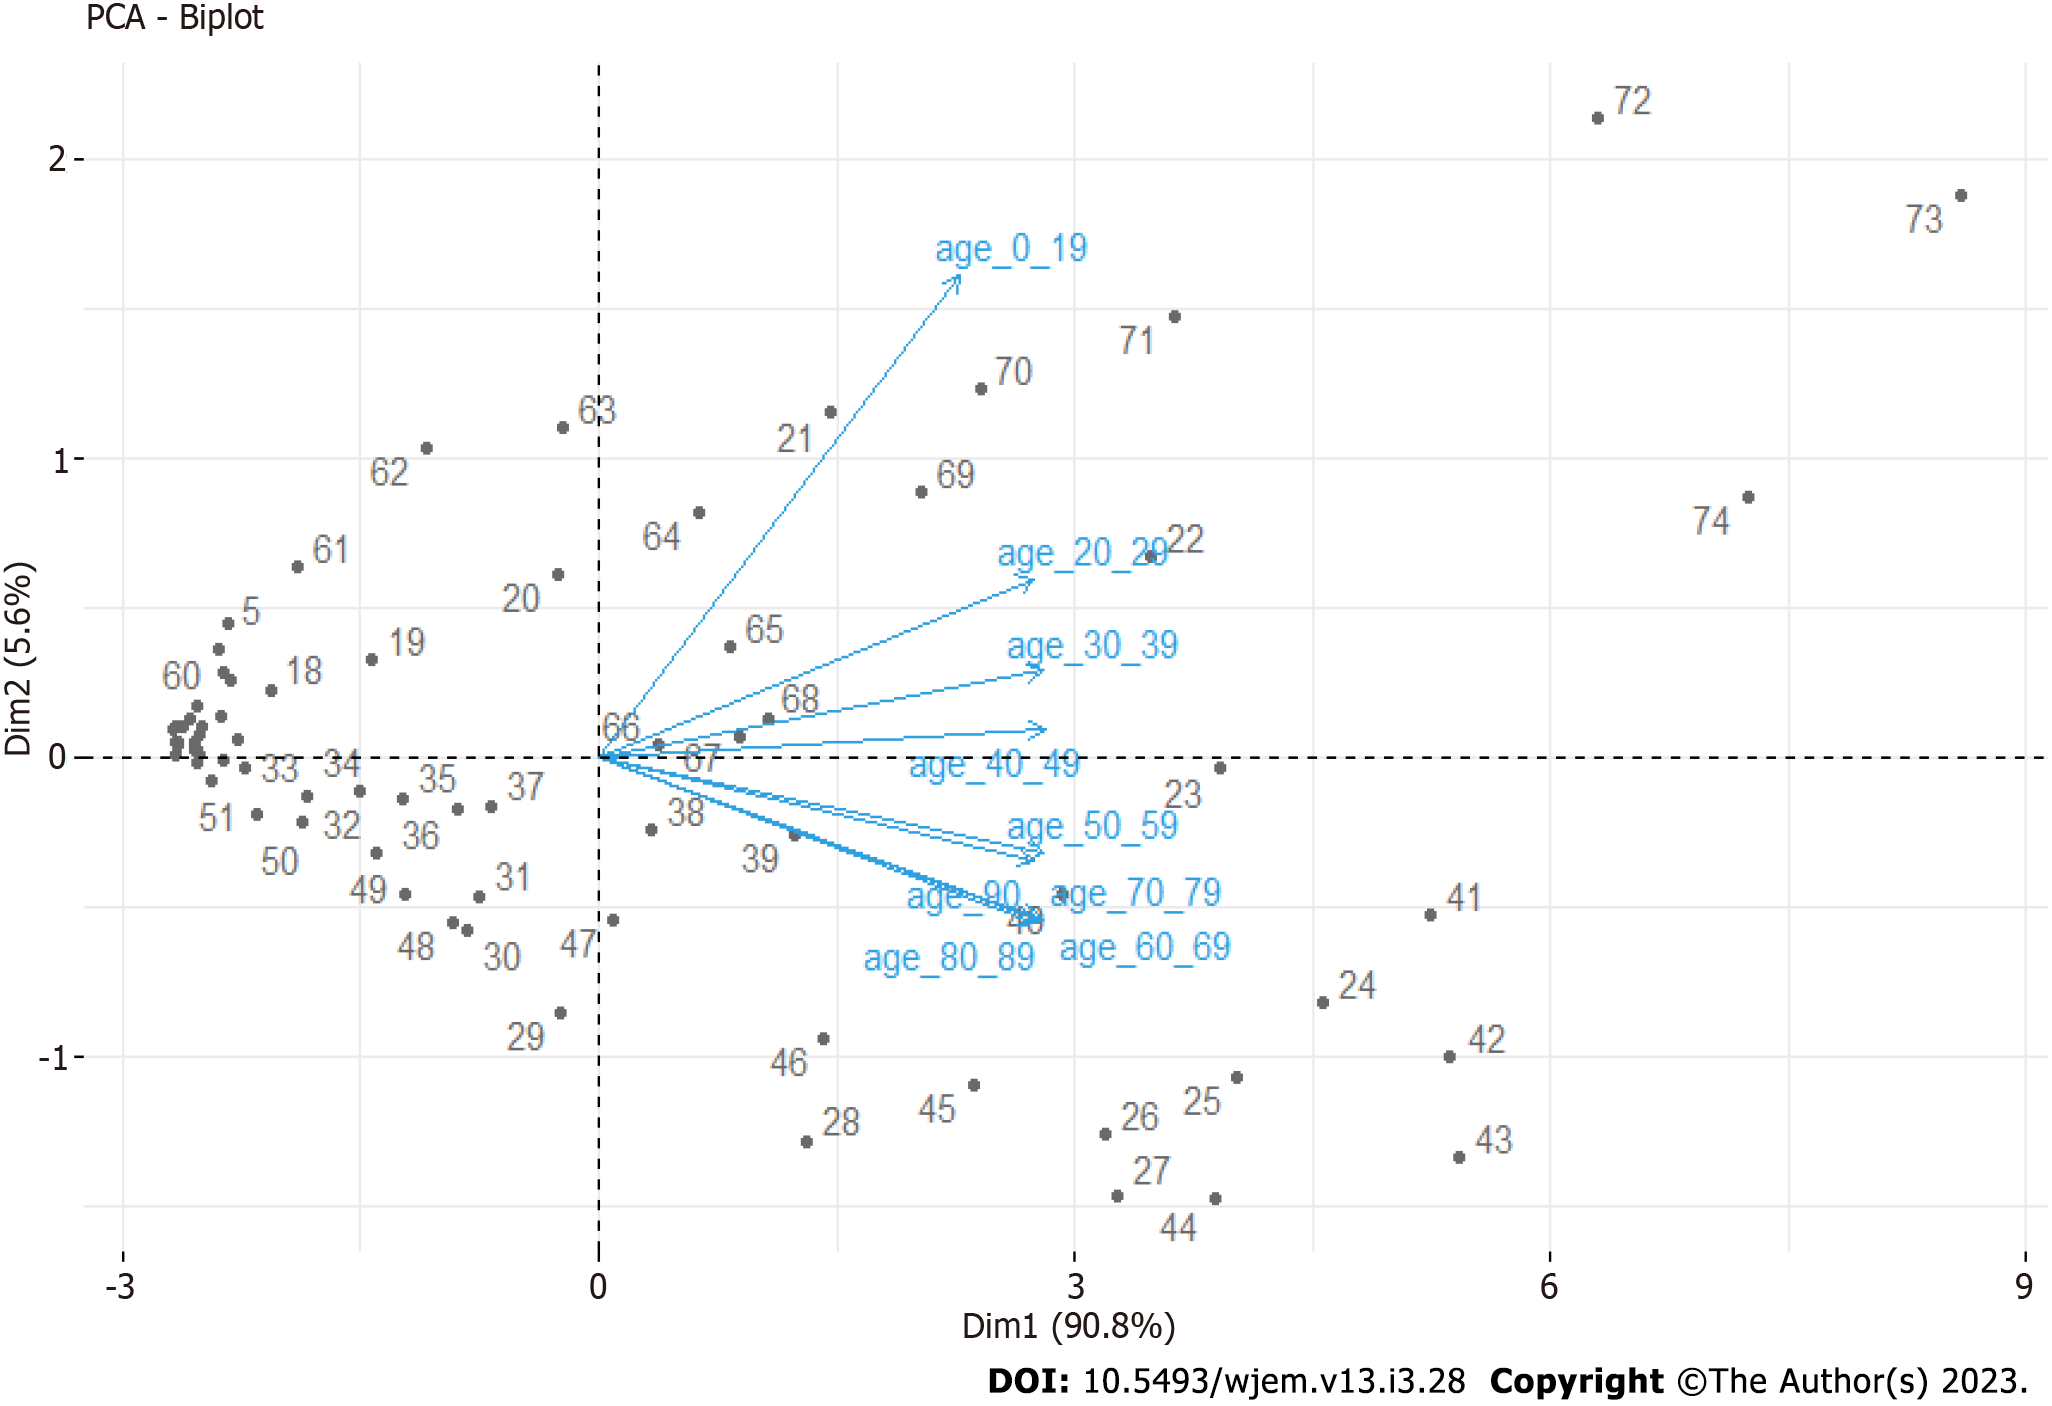
Figure 4 Principal component analysis Biplot for age groups on a weekly basis.
PCA: Principal component analysis.
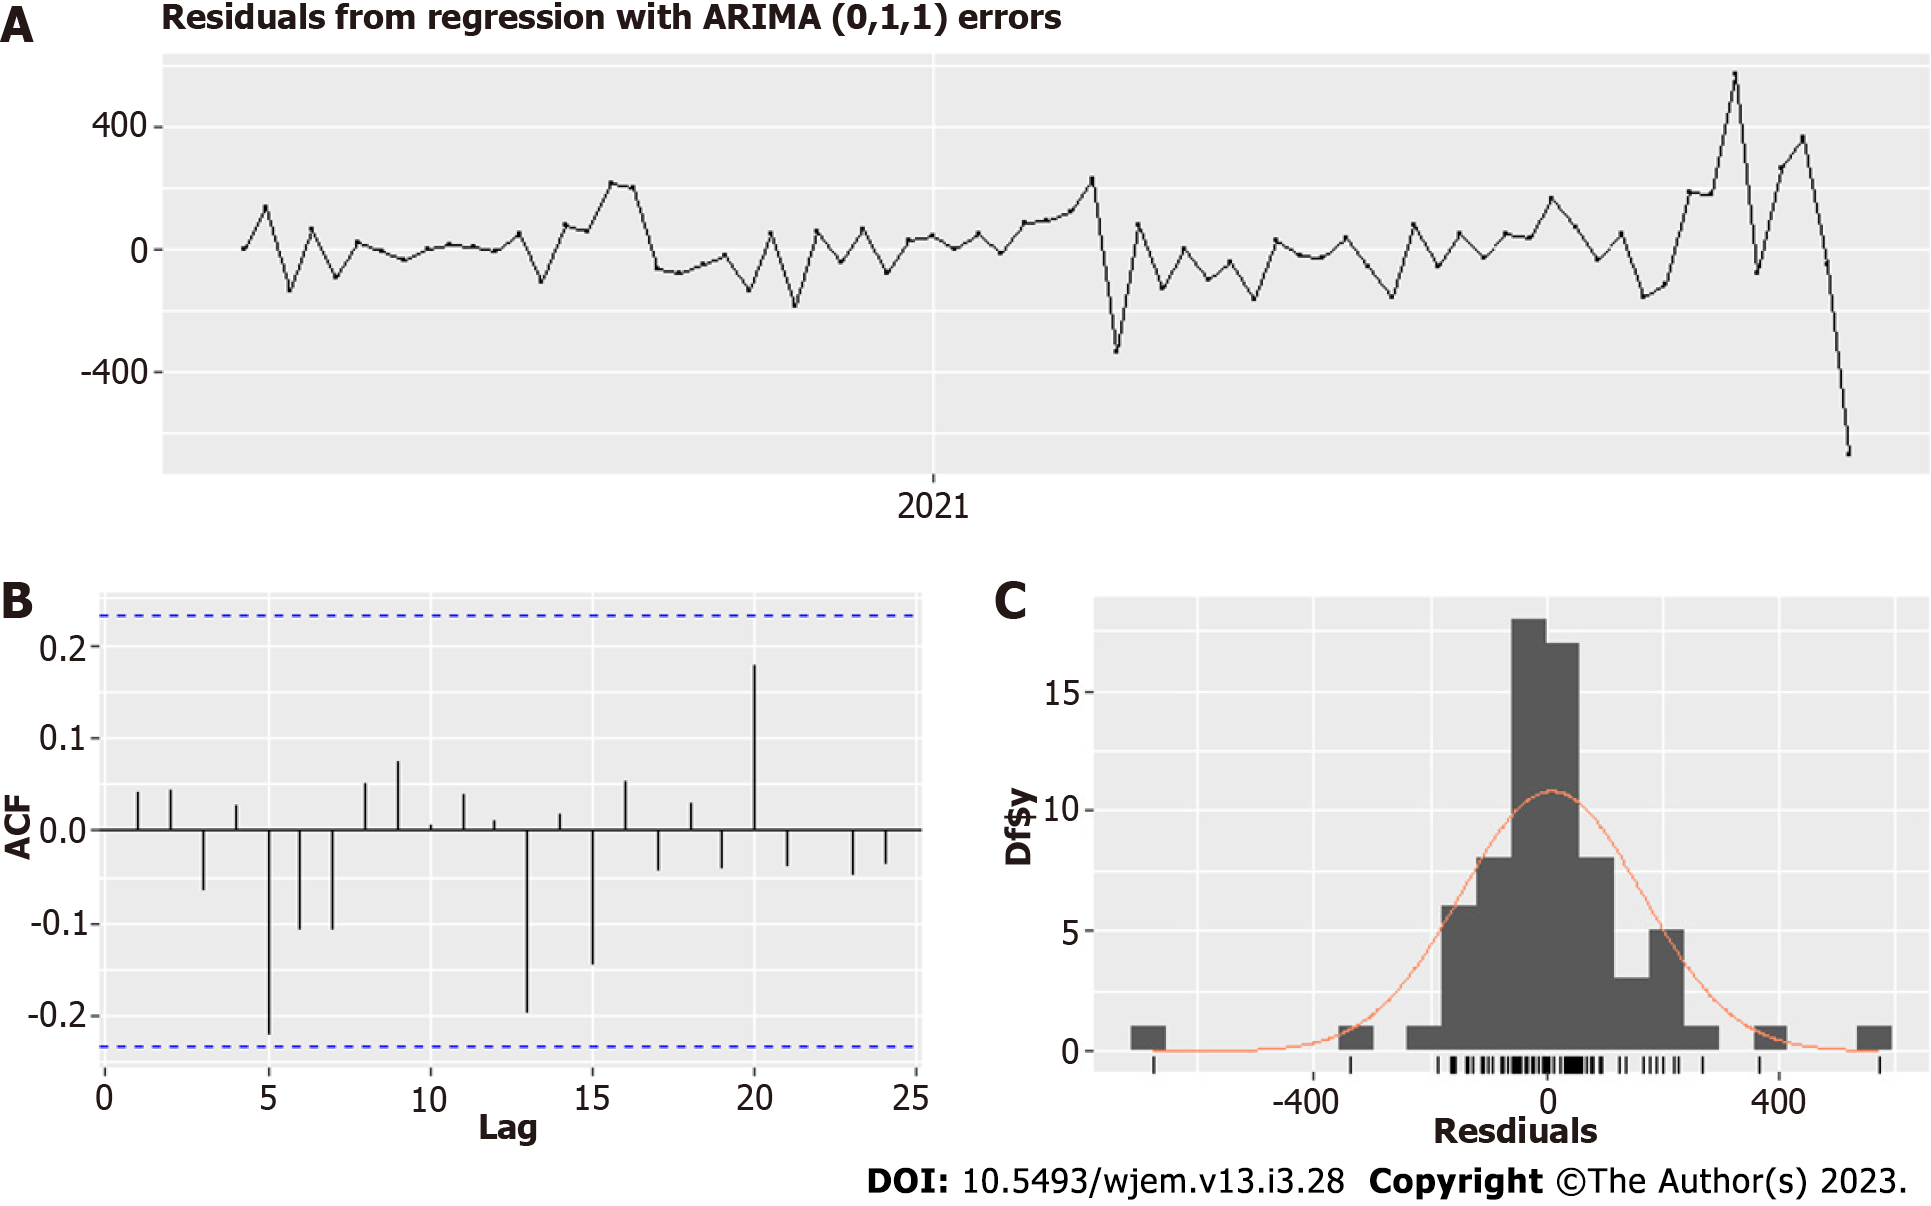
Figure 5 Residuals of Model I – Factors contributing to the spread among children.
A: Residuals of the model; B: Autocorrelation function of the residuals; C: Distribution of the residuals.
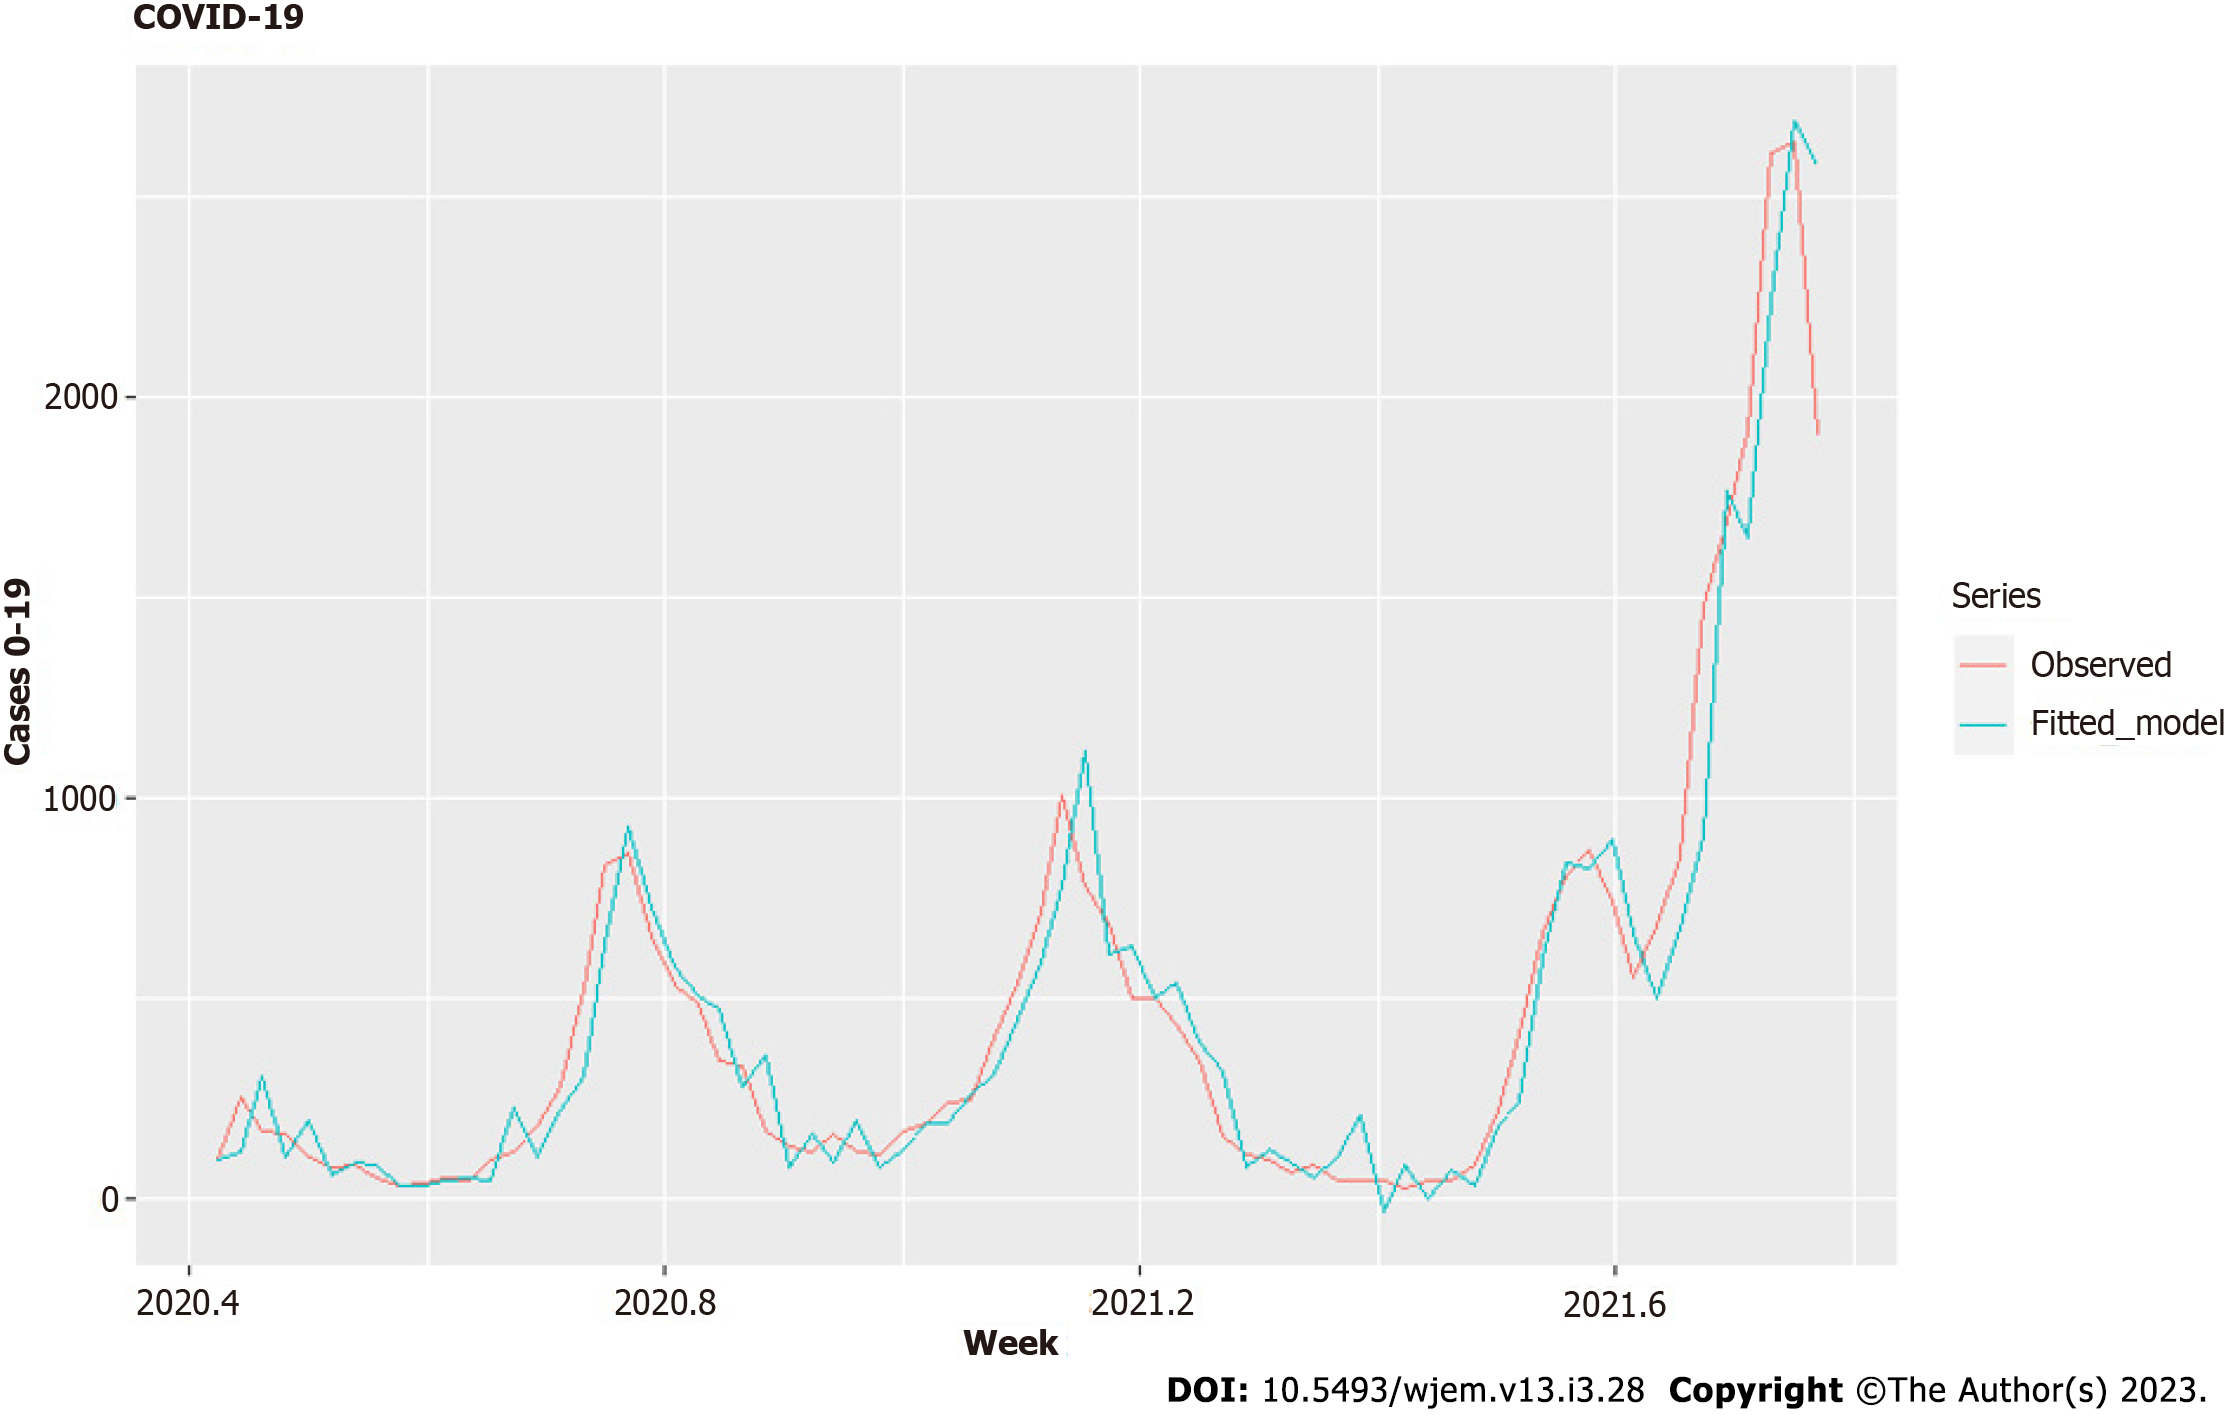
Figure 6 Fitted Model I – Factors contributing to the spread among children.
COVID-19: Coronavirus disease 2019.
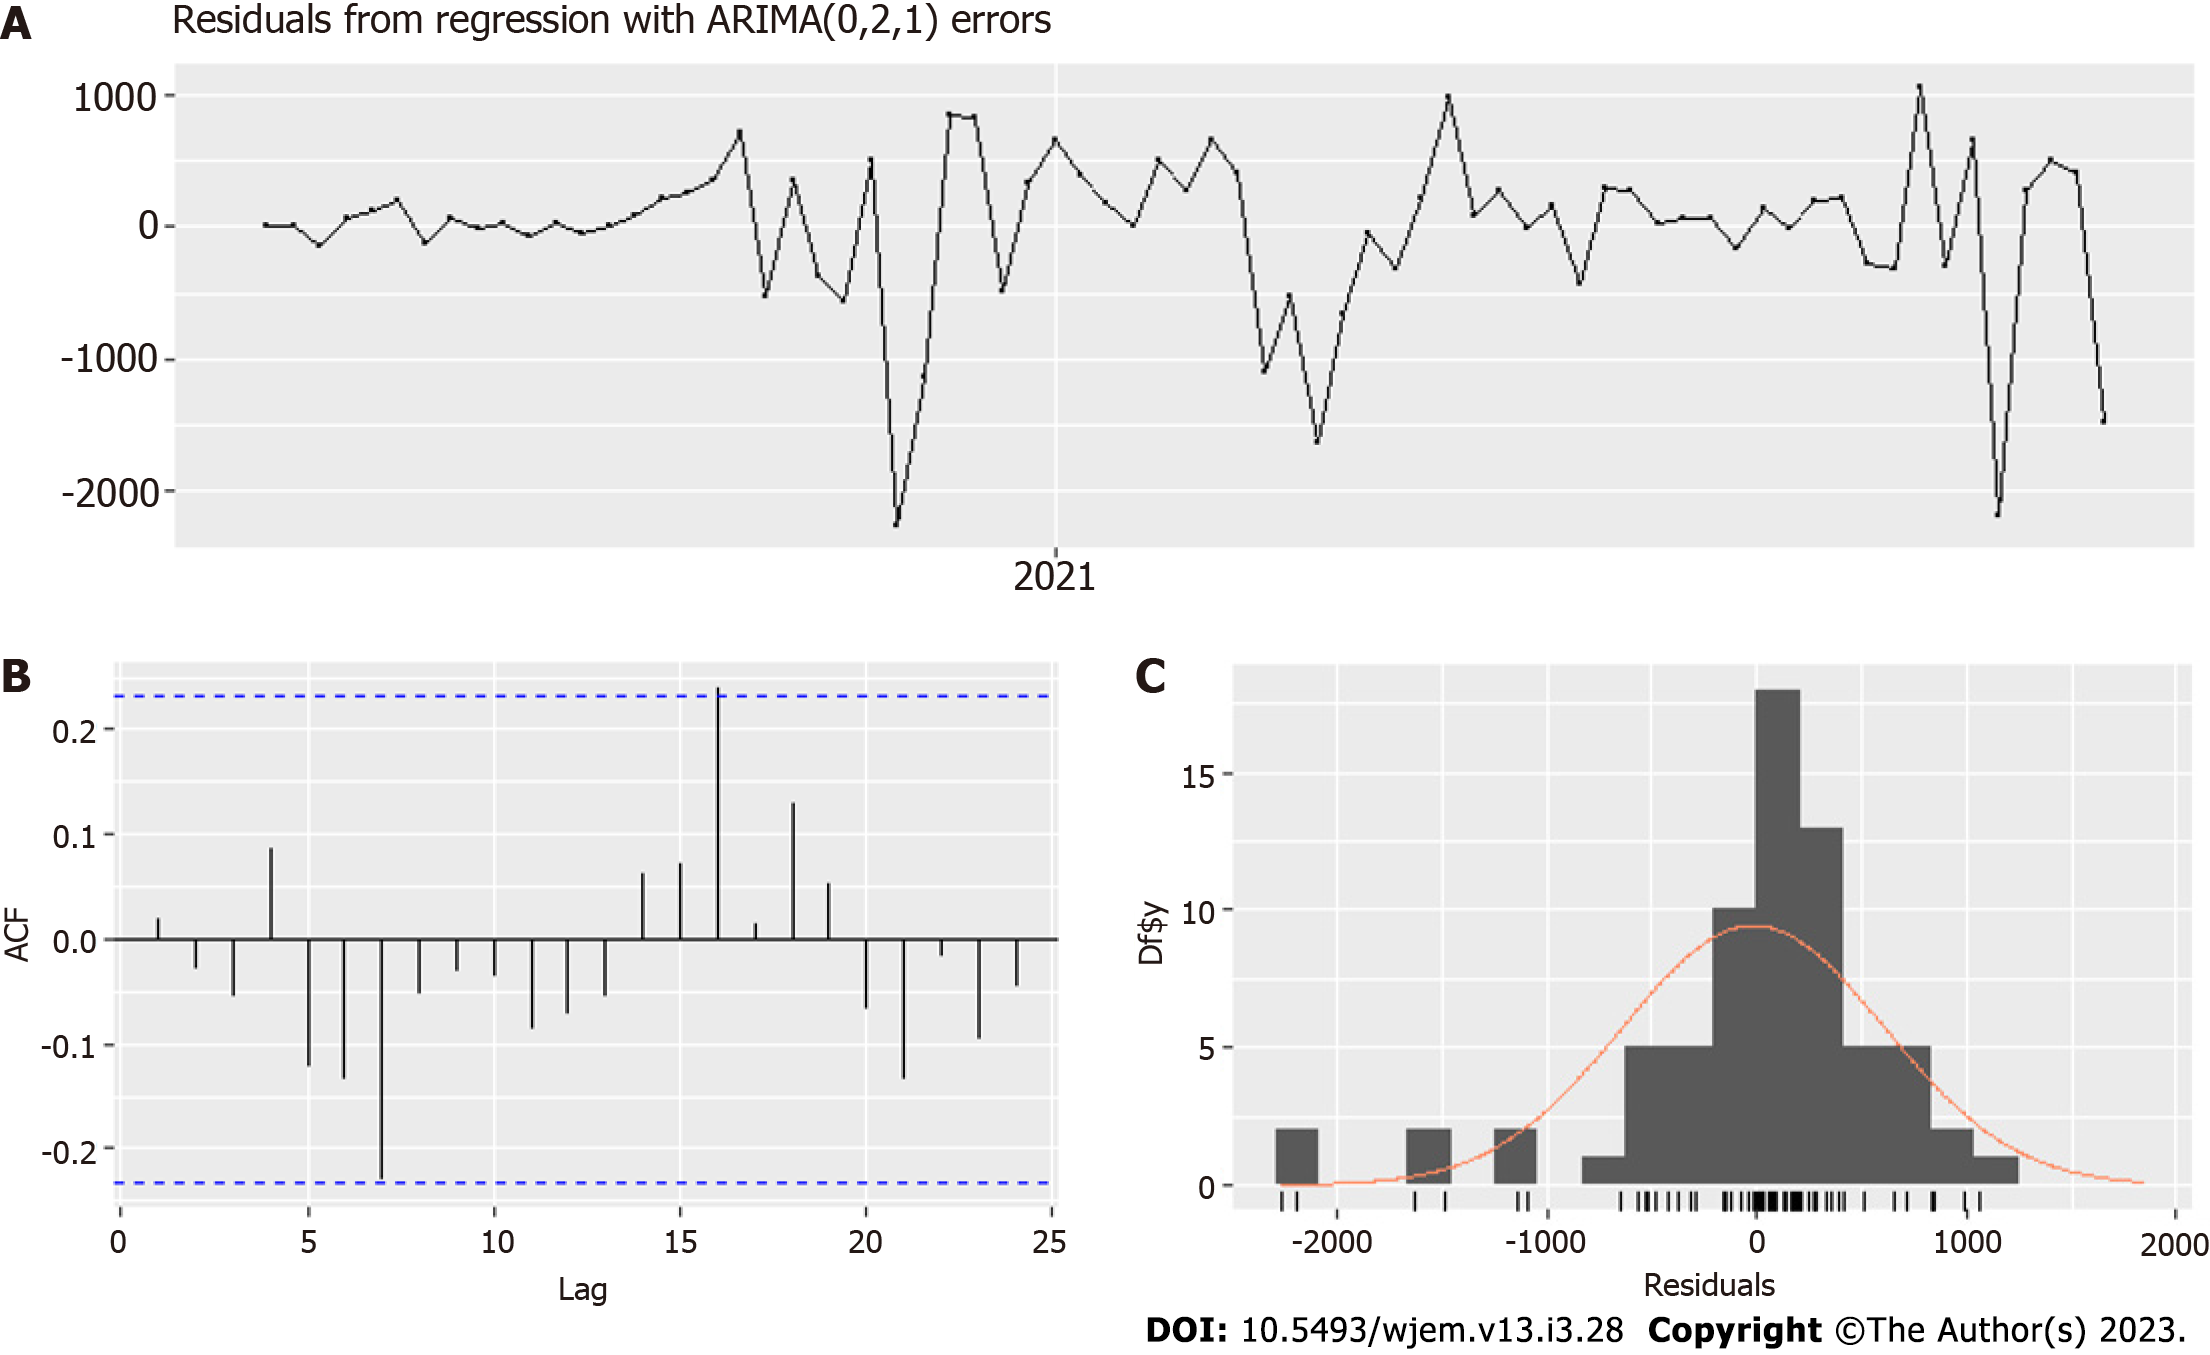
Figure 7 Residuals of MODEL III –III – Temporal spread across age groups 20-49.
A: Residuals of the model; B: Autocorrelation function of the residuals; C: Distribution of the residuals.
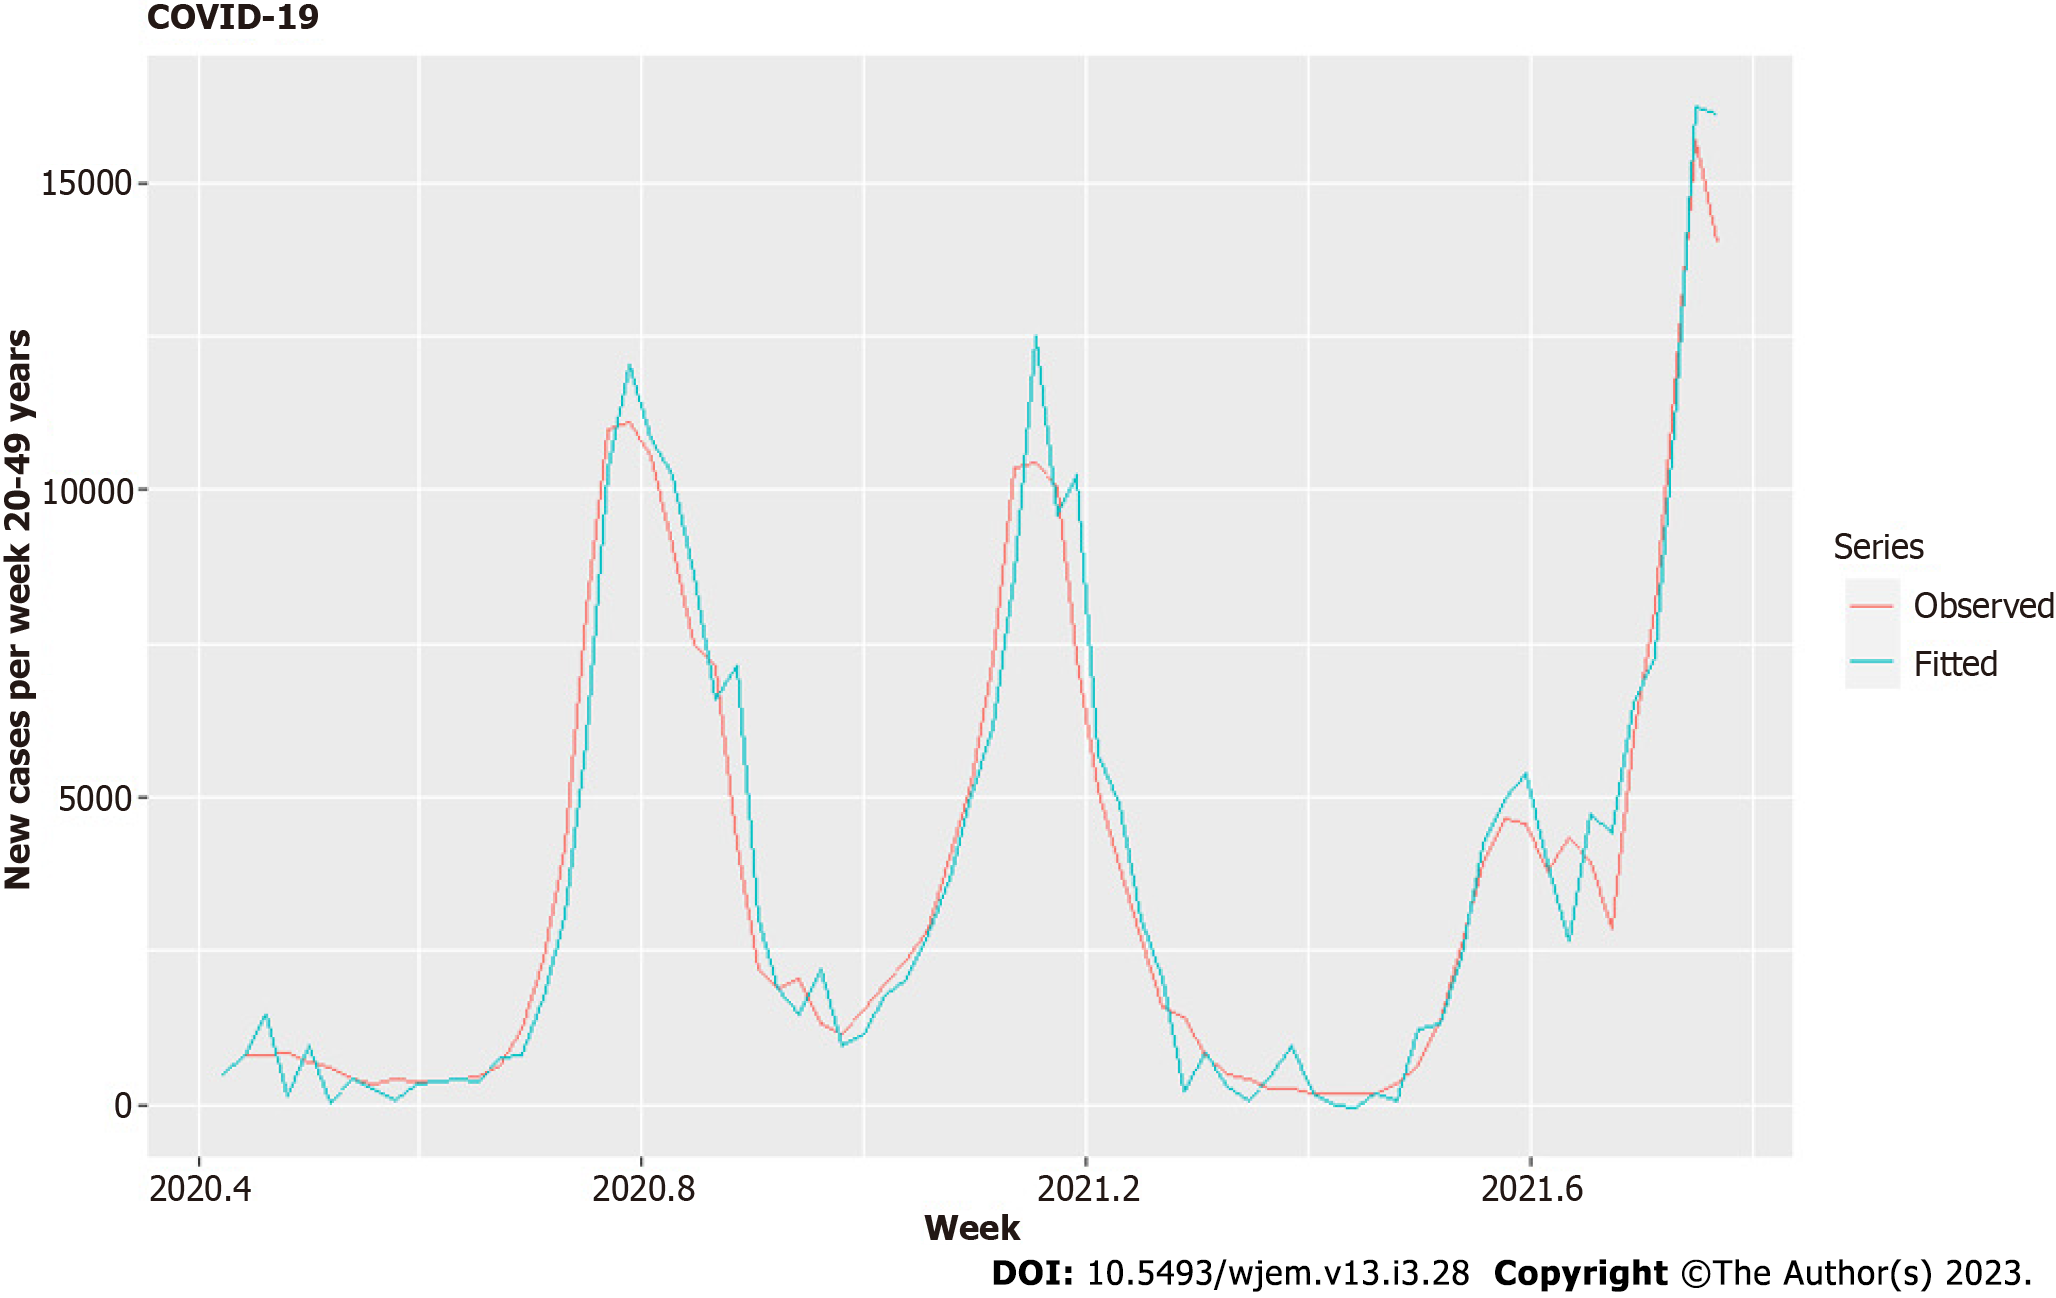
Figure 8 Fitted MODEL III – Temporal spread across age groups 20-49.
COVID-19: Coronavirus disease 2019.
Figure 9 Residuals of Model II – Temporal spread across age groups 60-89.
A: Residuals of the model; B: Autocorrelation function of the residuals; C: Distribution of the residuals.
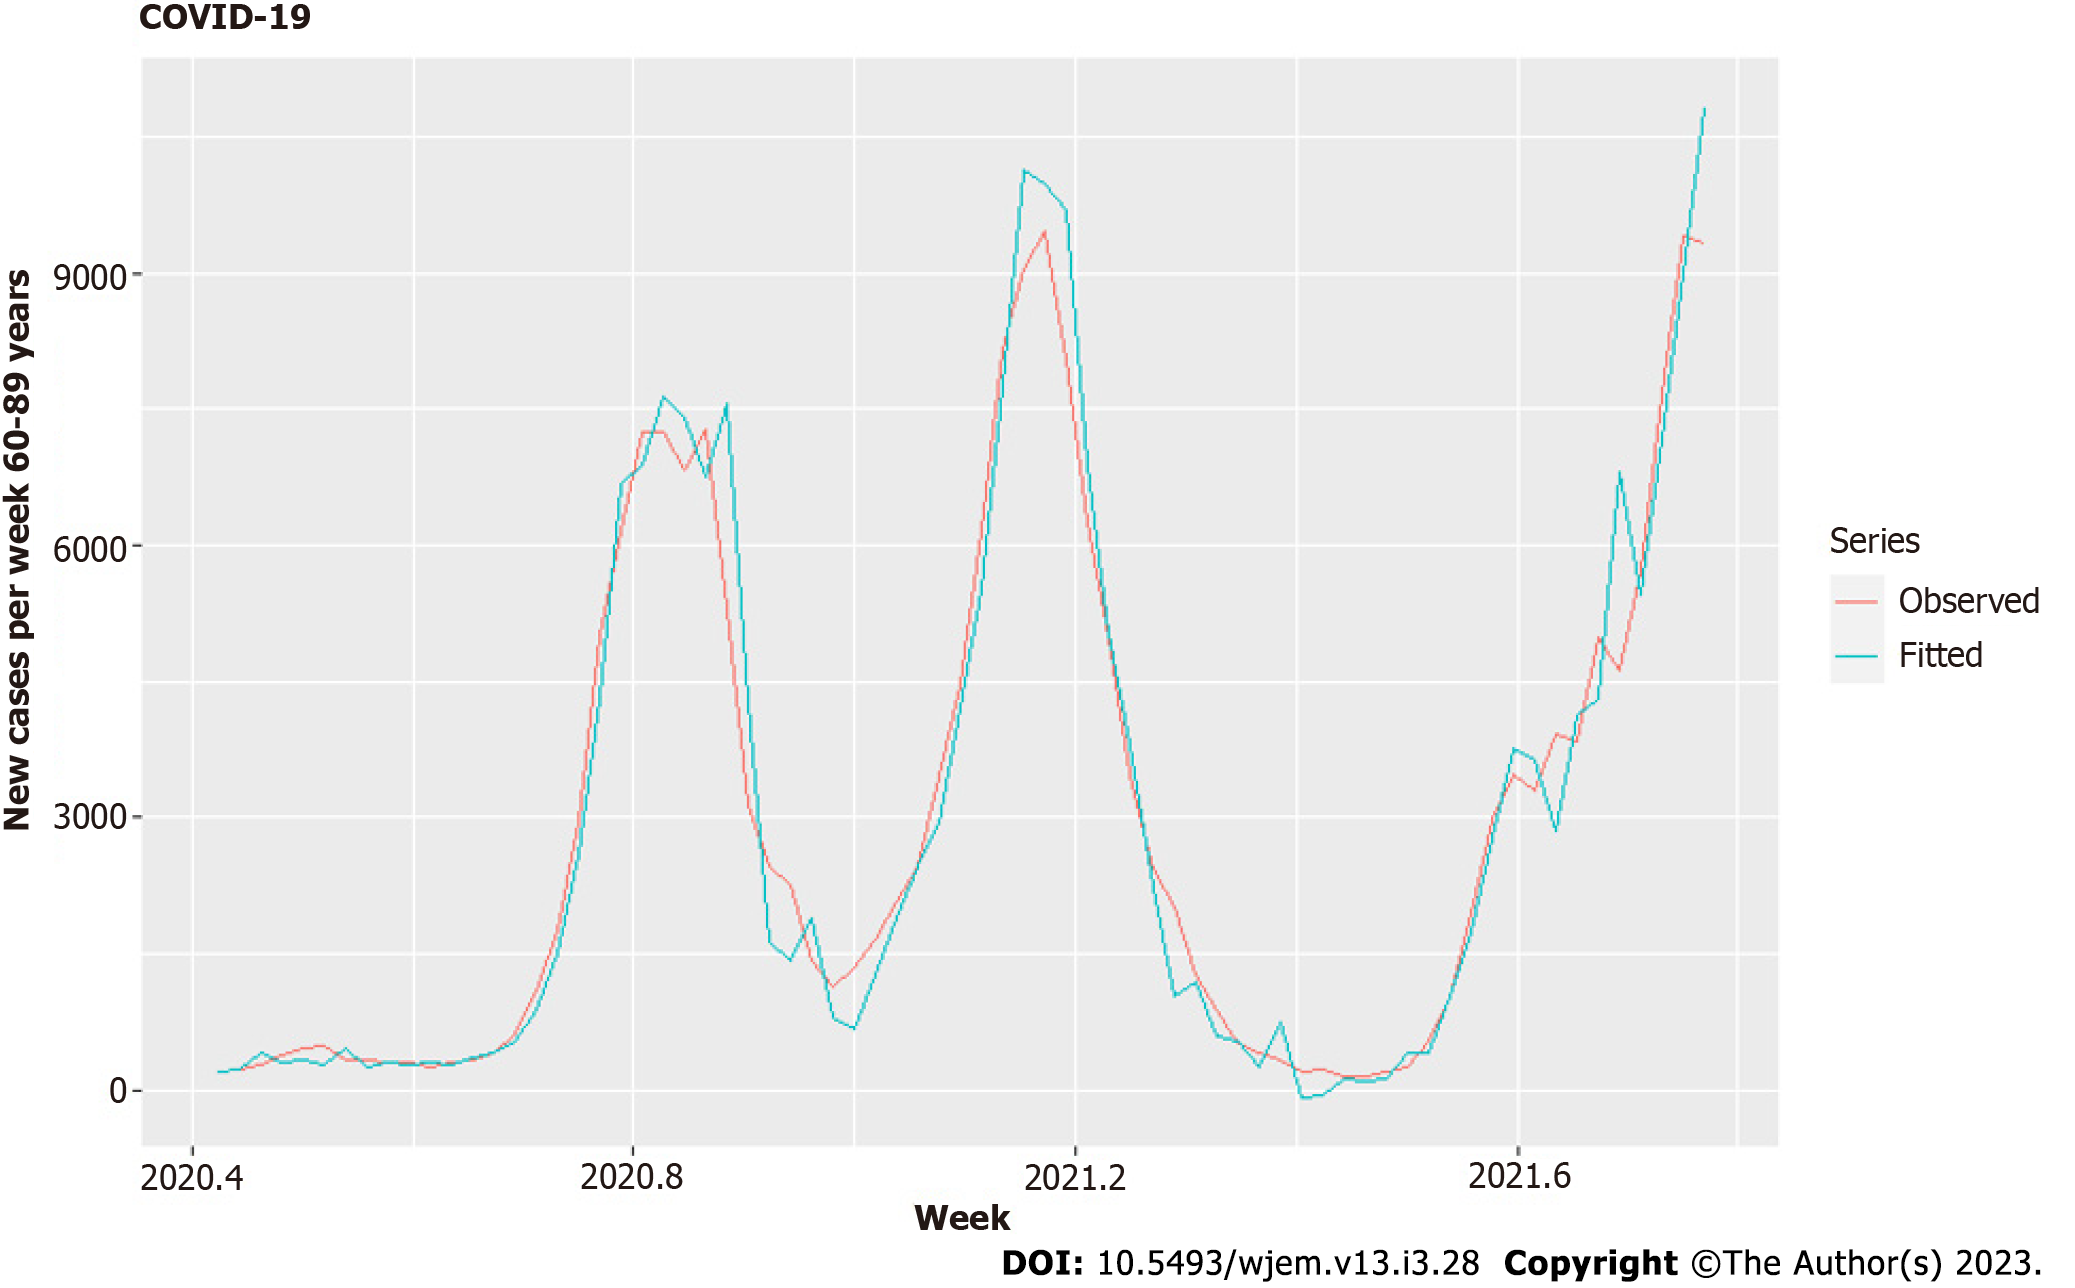
Figure 10 Fitted Model II – Temporal spread across age groups 60-89.
COVID-19: Coronavirus disease 2019.
Figure 11 Probability density distribution of the number of multisystem inflammation in children cases on a weekly basis.
Poisson distribution for total cases up to 4.12.2021 is with λ = 0.50∈ [0.355, 0.835]. MIS-C: Multisystem inflammation in children.
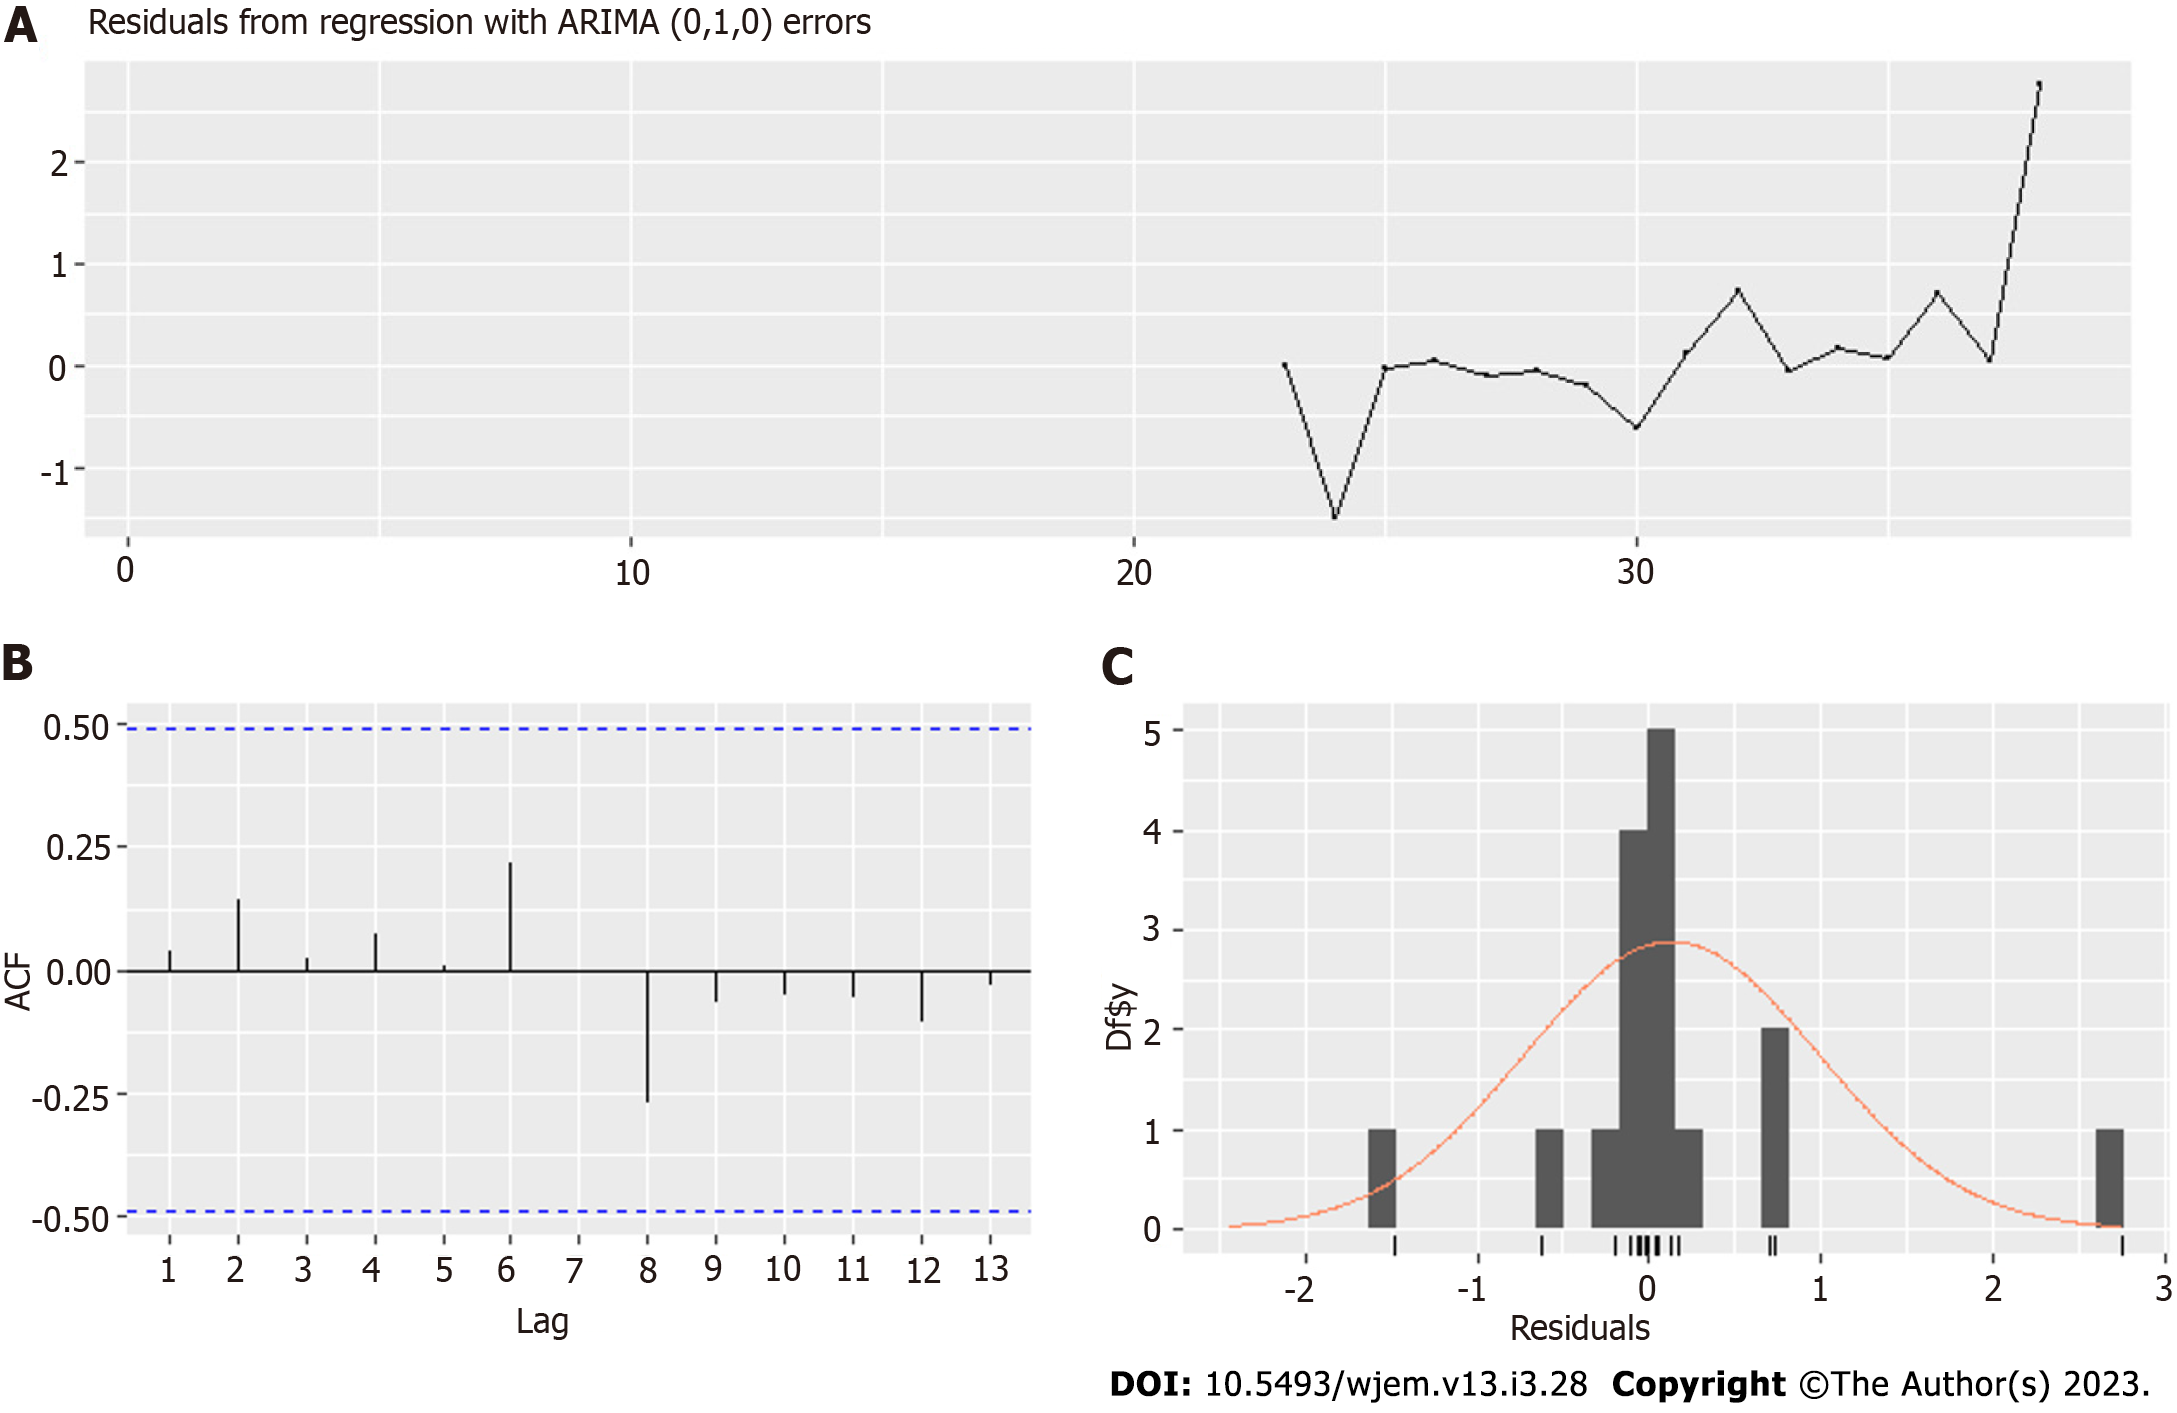
Figure 12 Residuals of model for the bi-weekly period.
A: Residuals of the model; B: Autocorrelation function of the residuals; C: Distribution of the residuals.
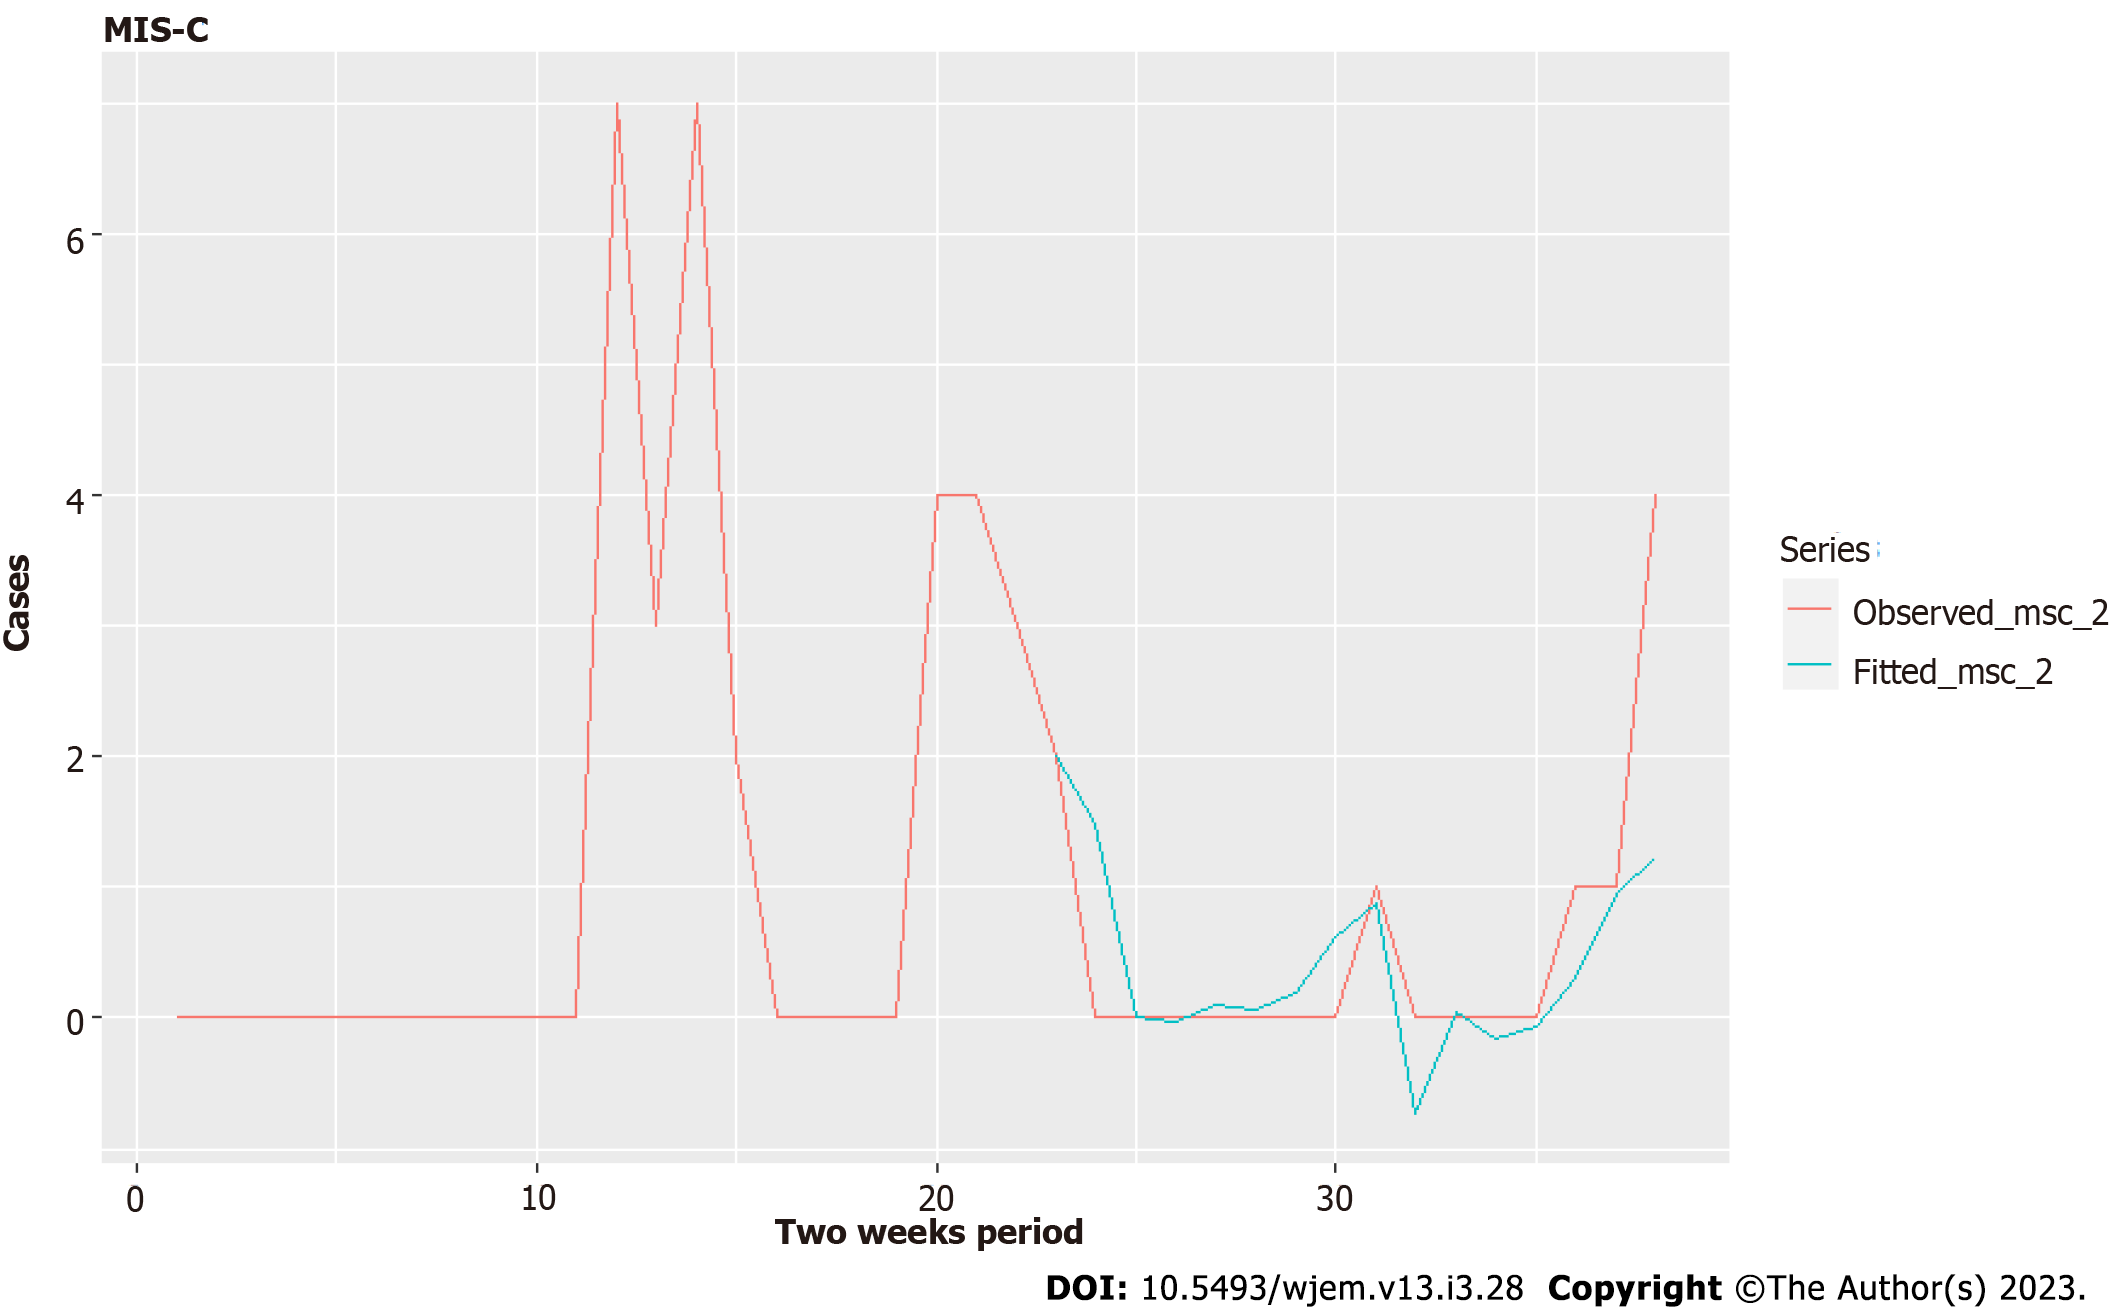
Figure 13 Fitted model for a bi-weekly period.
MIS-C: Multisystem inflammation in children.
Figure 14 Share of fully vaccinated individuals per age group up to November 16, 2021.
Data for the number of fully vaccinated individuals is taken from[35].
- Citation: Tomov L, Batselova H, Lazova S, Ganev B, Tzocheva I, Velikova T. Role of children in the Bulgarian COVID-19 epidemic: A mathematical model study. World J Exp Med 2023; 13(3): 28-46
- URL: https://www.wjgnet.com/2220-315X/full/v13/i3/28.htm
- DOI: https://dx.doi.org/10.5493/wjem.v13.i3.28


