INTRODUCTION
Recently, there has been increased attention on fluid overload and positive fluid balance as complications arising from iatrogenic fluid resuscitation and clinical or subclinical cardiac dysfunction. Striking a right balance of fluid resuscitation to maintain hemodynamic stability and organ perfusion is a challenge for both internists and intensivists alike[1]. Heart failure is one of the main cardiac causes of intensive care unit (ICU) admissions with congestive organopathy as a classic presentation. It has emerged as an increasingly significant focus for physicians, given its profound impact on healthcare expenditures and patients' quality of life[2,3]. Fluid overload in heart failure and cardiogenic shock is an intricate interplay of impaired cardiac contractility causing renal dysfunction, salt and water retention, and extracellular overhydration which lead to deleterious cascade of multi-organ failure, contributing to worsening critical care outcomes[4]. Studies have shown association of fluid overload with higher mortality in critically ill patients. In a meta-analysis conducted by Malbrain et al[5], involving 19902 critically ill patients, non-survivors exhibited a cumulative fluid balance after one week of ICU stay that was 4.4 L more positive compared to survivors. Additionally, restrictive fluid management showed a lower mortality rate compared to a more liberal fluid resuscitative approach (24.7% vs 33.2%; 95%CI: 0.32-0.55; P < 0.0001). Another study by the Dose Response Multicenter Investigation on Fluid Assessment group analyzed 1734 critically ill patients and concluded that severity and rapidity of fluid overload are independent risk factors for ICU mortality[6]. Multi organ congestion manifests as pulmonary edema, bowel edema, ascites, hepatic dysfunction, acute kidney injury (AKI), compromised wound healing, elevated intracranial pressure etc all of which contribute to high morbidity[7].
Apart from increased mortality rate, patients with acute decompensated heart failure continue to have residual congestion despite standard de-resuscitative therapy by day 7 of hospitalization or discharge which increases risk of readmission (HR 1.06, 95%CI: 0.95-1.19)[8]. One study noted a 24% readmission rate in 30 d[9]. One of the major causes of readmission is employment of imprecise assessment tools like physical examination which are highly dependent on the skills of clinicians. Adjunct objective data like serum B-type natriuretic peptide (BNP), hemoglobin and hematocrit also aid in better evaluation of the decongestion. Despite the availability of various bedside methods and tools for assessing congestion, each harbors limitations that may constrain their utility[7,10,11]. Hence, an arduous task to determine the ‘stability’ of heart failure patients, from downgrading out of ICU and eventual discharge from medicine floors lay on the shoulders of intensivists and internists, respectively.
During treatment of heart failure, beyond conventional signs and symptoms, point-of-care ultrasonography (POCUS) serves as a tool to address specific clinical queries at the bedside, like ensuring adequate decongestion following initial therapy to furnish guidance for management and formulate better discharge plans. Multi-organ POCUS, encompassing focused cardiac ultrasound (FoCUS), lung ultrasound, and Doppler assessment of venous congestion, is increasingly recognized as an invaluable non-invasive tool for assessing hemodynamics[7,12,13]. In this narrative review, we will delve into the role of venous excess Doppler ultrasound in heart failure management, scrutinizing its practical utility and limitations.
CONGESTIVE NEPHROPATHY
The term "congestive nephropathy" delineates renal dysfunction originating from venous congestion, culminating in diminished renal perfusion[14]. When congestive nephropathy manifests in the context of heart failure, it mirrors cardio renal syndrome types 1 and 2. In such instances, acute or chronic heart failure may precipitate AKI or chronic kidney disease, respectively, through the aforementioned mechanism[15,16]. Moreover, congestive nephropathy may be exacerbated by increased intra-abdominal pressure, such as in cases of ascites or bowel wall edema, which can compress intra-abdominal vessels, thereby impeding venous drainage[17]. Renal perfusion pressure denotes the difference between inflow pressure mean arterial pressure and outflow pressure (central venous pressure) or intra-abdominal pressure when elevated[18]. A comprehension of this mechanism explains how venous congestion and increased intra-abdominal pressure may contribute to a reduction in renal perfusion.
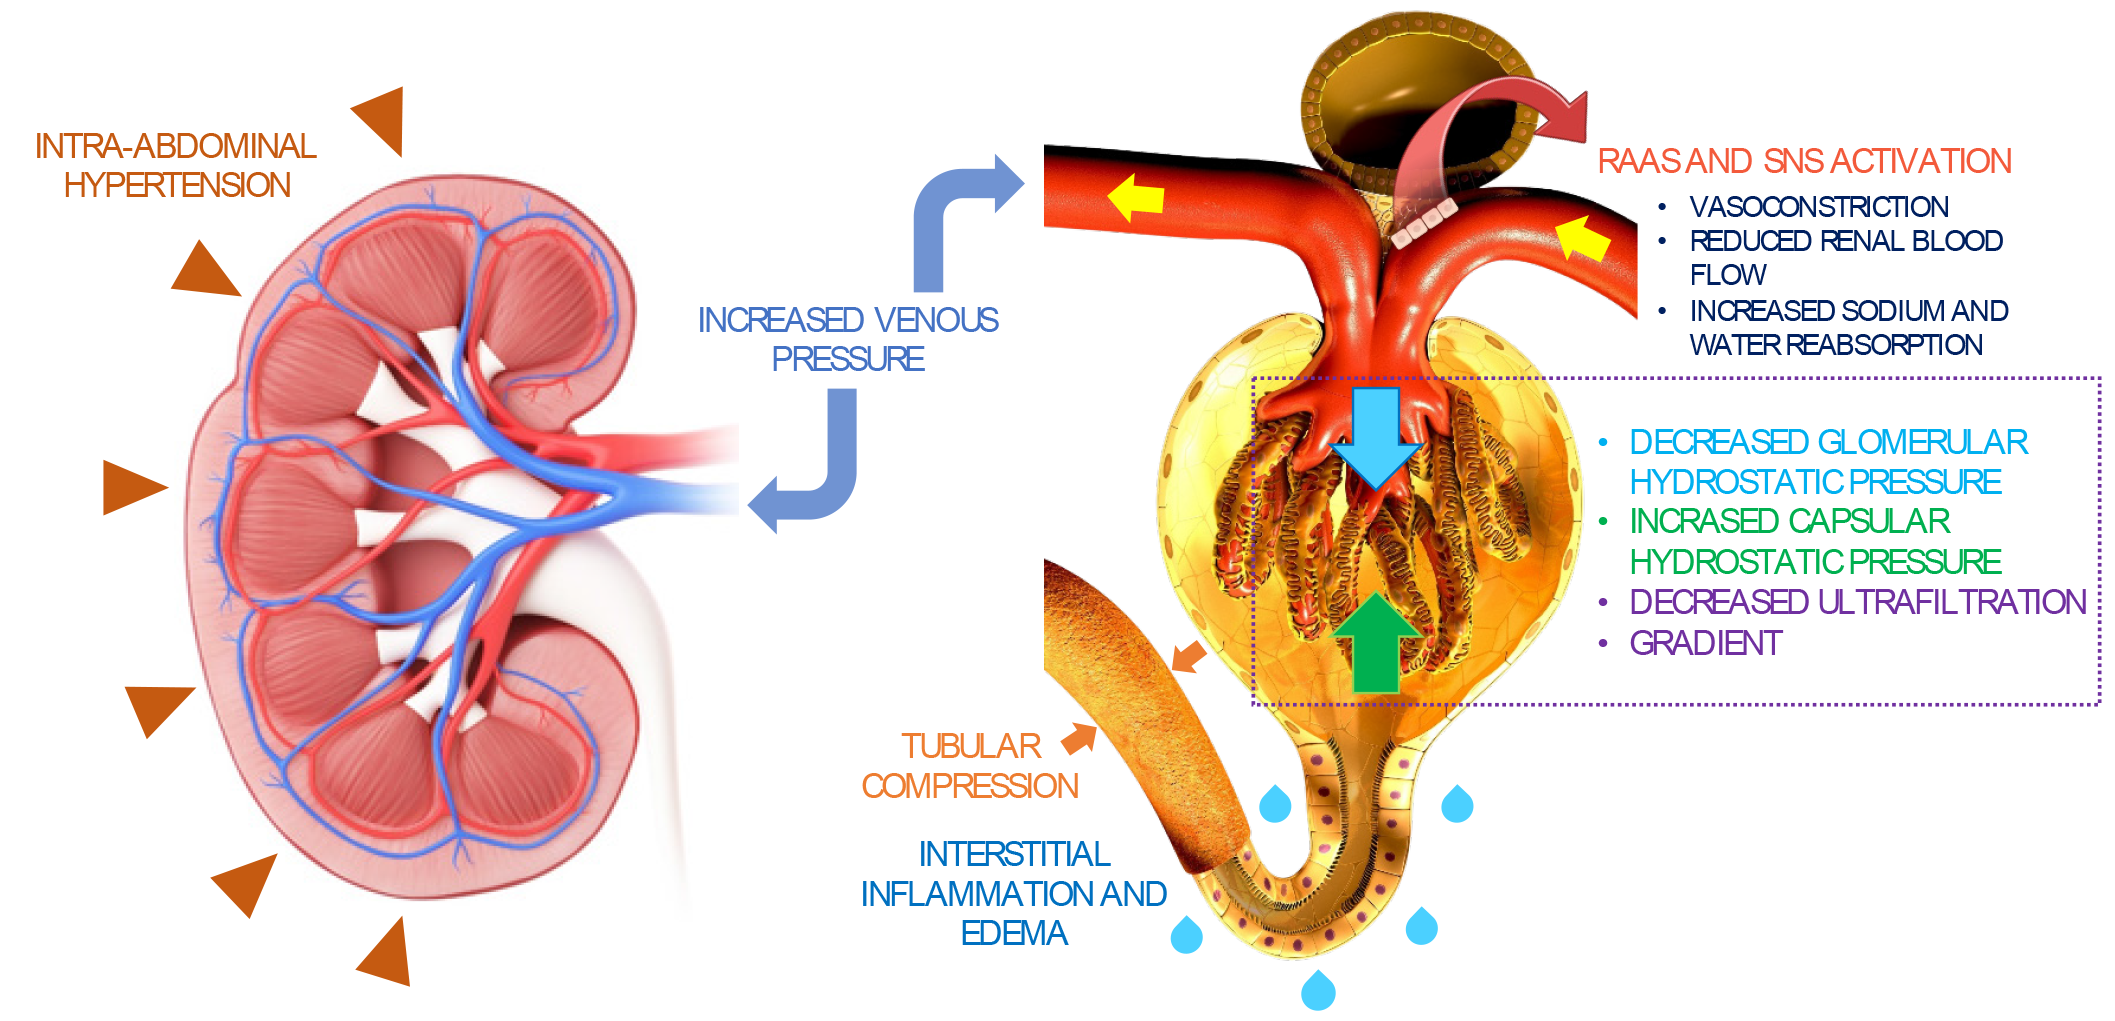
In individuals experiencing systemic congestion, the elevation in central venous pressure induces renal venous congestion, precipitating an augmentation in renal interstitial hydrostatic pressure due to the limited expansibility of the encapsulated kidney. Consequently, there ensues a simultaneous rise in the glomerular transcapillary hydrostatic pressure gradient, initiating glomerular hyperfiltration initially but potentially compromising both glomerular filtration rate (GFR) and renal blood flow subsequently Figure 1[18,19]. The kidneys endeavor to sustain pressures by augmenting lymphatic outflow, yet a persistent increase in central venous pressure ultimately diminishes lymphatic outflow[20]. Furthermore, renal venous congestion incites inflammation, ischemia, and oxidative stress, culminating in tubular injury. When renal perfusion pressure is compromised, the kidneys activate the renin-angiotensin-aldosterone system and the sympathetic nervous system in response, precipitating volume retention, interstitial edema, endothelial dysfunction, and a further decrement in GFR[3,21,22]. In instances of acute or acute-on-chronic renal venous congestion, decongestive therapy has exhibited efficacy in ameliorating renal function when administered before the onset of acute tubular necrosis, renal parenchymal hypoxia, or tubulointerstitial fibrosis[22]. This underscores the pivotal role of early identification as a critical determinant in potentially achieving complete recovery.
Figure 1 Summary of congestive nephropathy.
Congestion-induced acute renal dysfunction is mediated by retrograde transmission of central venous pressure to the kidneys, leading to development of interstitial edema, inflammation, and activation of the renin-angiotensin-aldosterone system and sympathetic nervous system. This further results in global cessation of glomerular filtration. Intra-abdominal hypertension adds to the problem by simulating a tamponade pathophysiology together with increased interstitial pressures. Citation: Argaiz ER, Romero-Gonzalez G, Rola P, Spiegel R, Haycock KH, Koratala A. Bedside Ultrasound in the Management of Cardiorenal Syndromes: An Updated Review. Cardiorenal Med 2023; 13: 372-384. Copyright ©Karger Publishers 2023. Published by Karger Publishers.
ASSESSING CONGESTION AT THE BEDSIDE: A COMPLEX ENDEAVOR
In patients with heart failure, the initial evaluation commences with a comprehensive history and meticulous cardiopulmonary examination. However, patients may provide ambiguous information, potentially leading to misinterpretation by clinicians and fostering anchoring bias[23,24]. Physical examination findings such as jugular venous distention, S3 heart sound, pedal edema, and lung crackles exhibit limited sensitivity. Relying solely on documented body weight proves imprecise, and chest X-rays, typically employed for pulmonary congestion assessment, may yield misleading results[11]. Furthermore, right-sided heart failure might manifest as congestive hepatopathy and nephropathy without discernible pulmonary congestion evident on chest X-rays. Natriuretic peptides (BNP and NT-proBNP) can assist in diagnosis but may be influenced by factors such as obesity and chronic kidney disease. Additionally, BNP elevation lacks specificity and can occur in various conditions including pulmonary embolism, acute respiratory distress, pulmonary hypertension, and valvular cardiac disease[25]. Fractional excretion of urea, a urinary marker, exhibits limitations in distinguishing congestive nephropathy from volume depletion, particularly in patients with underlying chronic kidney disease[26]. Consequently, diagnosing and monitoring congestion in routine clinical practice pose challenges in the absence of supplementary objective data. When interpreted alongside clinical and laboratory data, POCUS furnishes real-time insights into patients' hemodynamics, facilitating the tailoring of individualized decongestive management based on the corresponding hemodynamic profile[27].
POCUS-ASSISTED ASSESSMENT OF CONGESTION
The evaluation of congestion encompasses an appraisal of global cardiac function and the repercussions of elevated left and right-sided filling pressures. This can be achieved through FoCUS, lung ultrasound, and inferior vena cava (IVC) ultrasound. While grayscale and color Doppler applications are regarded as basic, spectral Doppler applications (enabling blood flow measurement and/or waveform analysis) are more advanced and demand a higher skill level[7]. It is imperative for clinicians performing POCUS to recognize both their personal limitations and those inherent in their equipment.
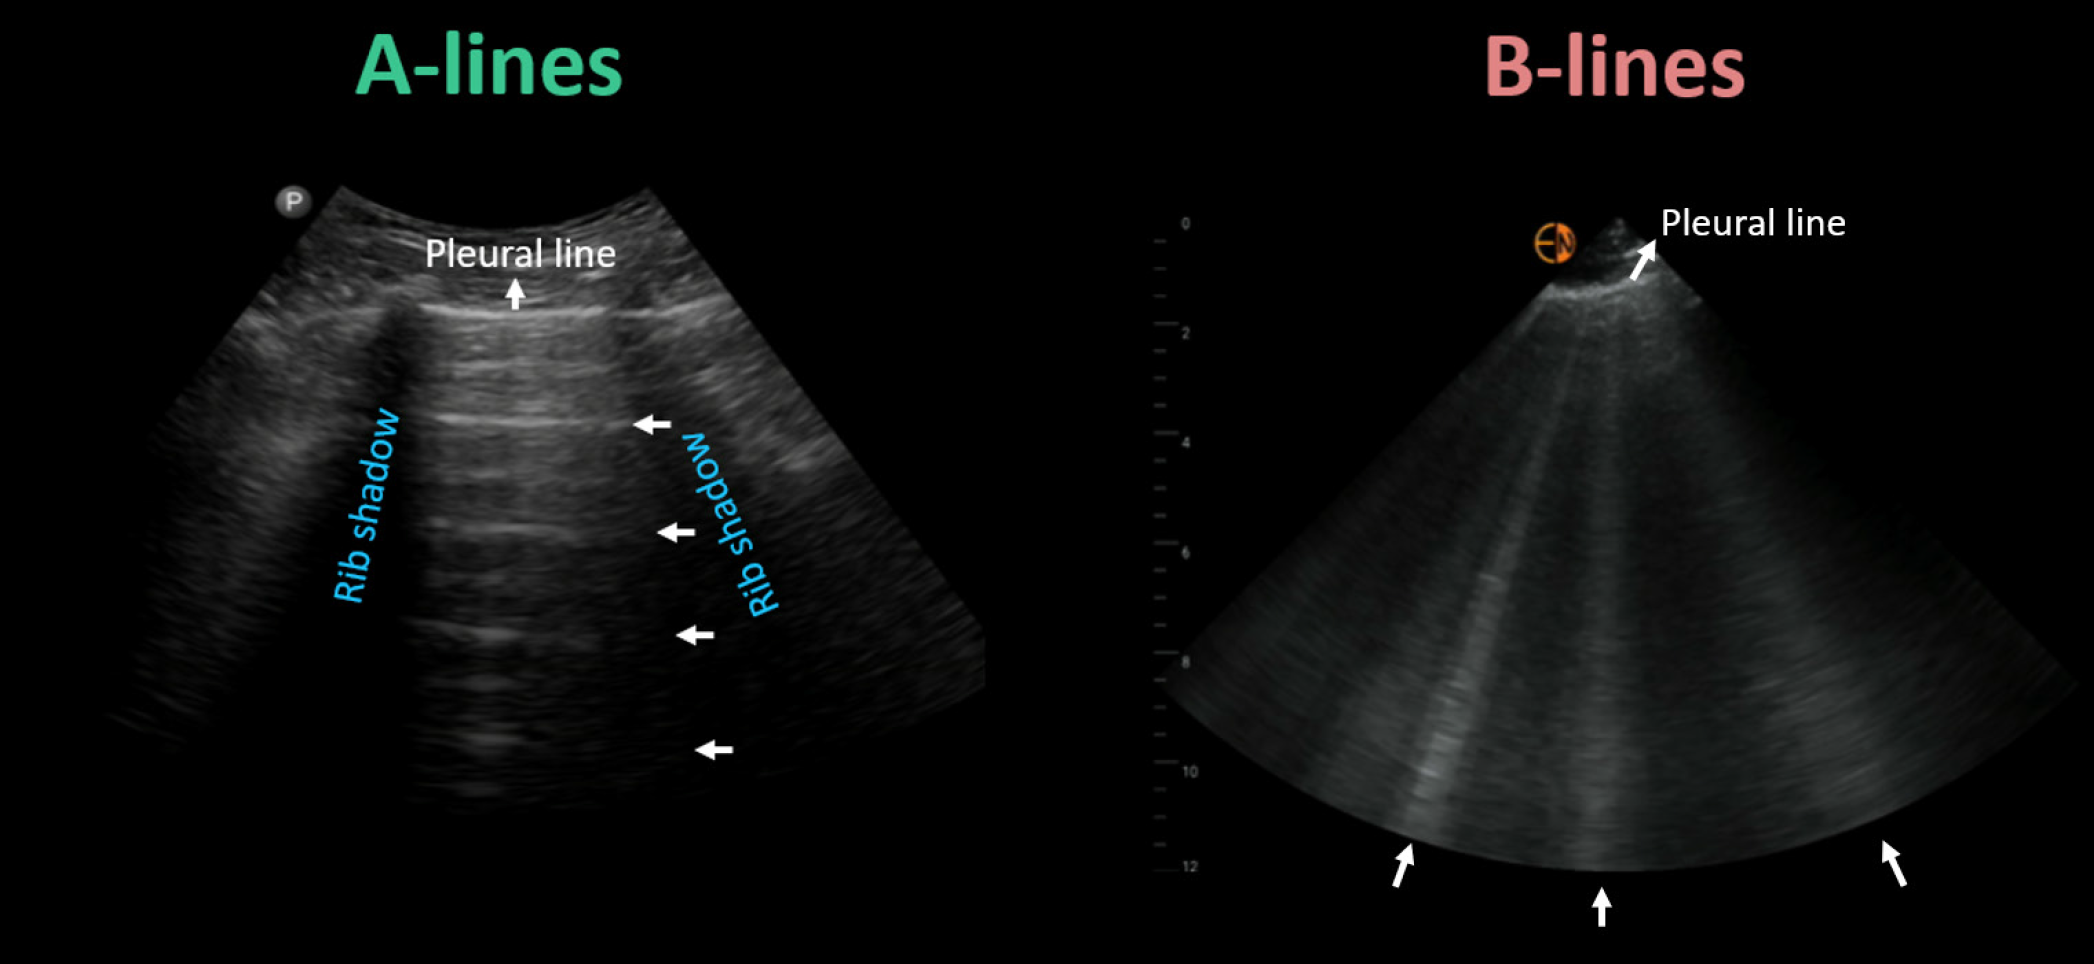
Lung POCUS can detect fluid accumulation in the lungs with greater accuracy than a chest X-ray, allowing for the diagnosis of cardiogenic pulmonary edema before symptoms appear. The presence of vertical, hyperechoic reverberation artifacts on ultrasound, termed B-lines, distributed bilaterally in dependent zones, signifies pulmonary congestion Figure 2. The quantity of B-lines has been correlated with escalating severity of pulmonary capillary wedge pressure. Intriguingly, a meta-analysis involving over 1800 patients concluded that lung ultrasound exhibits higher sensitivity than chest X-ray for detecting pulmonary edema (88% vs 73%)[28]. Another advantage is that lung ultrasound is a relatively accessible skill to acquire and can be effectively employed by non-physician team members. A study of 240 patients admitted with acute decompensated heart failure revealed that detecting subclinical pulmonary congestion through nurse-performed POCUS at discharge increased the risk of readmission and/or heart failure-related death within 90 days by 3.3- to 4.2-fold (P < 0.01). This correlation remained significant even after adjusting for demographics, heart failure characteristics, comorbidities, and event risk score. Additionally, patients with congestion had fewer days alive outside of the hospital over the 90-d period compared to those without congestion (78.3 vs 85.5; P < 0.01)[29].
Figure 2 Key lung ultrasound findings: horizontal A-lines (normal) and vertical B-lines (abnormal).
Citation: Argaiz ER, Romero-Gonzalez G, Rola P, Spiegel R, Haycock KH, Koratala A. Bedside Ultrasound in the Management of Cardiorenal Syndromes: An Updated Review. Cardiorenal Med 2023; 13: 372-384. Copyright ©Karger Publishers 2023. Published by Karger Publishers.
FoCUS aids in identifying sonographic findings indicative of the underlying etiologies associated with congestive nephropathy. These findings encompass left and right ventricular systolic dysfunction, pericardial effusion, chamber enlargement, and significant valvular anomalies. FoCUS can guide therapy by identifying these conditions[30]. For instance, underlying mitral valve pathology can cause pulmonary edema. If this is overlooked and only lung POCUS is relied upon, it could lead to delayed care. Additionally, in certain scenarios, distinguishing between cardiogenic and non-cardiogenic pulmonary edema using lung POCUS alone can be challenging. Clinicians adept in Doppler echocardiography can endeavor to differentiate by concurrently assessing left ventricular filling pressures.
The IVC provides a reasonable estimate of the right atrial pressure (practically same as the central venous pressure) given its direct connection to the right atrium. It constitutes a standard element of clinical echocardiography employed for this purpose. In spontaneously breathing patients, an IVC diameter of < 2.1 cm with a collapse of > 50% during a sniff suggests a right atrial pressure between 0-5 mmHg, whereas an IVC > 2.1 cm with collapse < 50% during a sniff indicates 10-20 mmHg of right atrial pressure. When the vessel appears dilated yet retains considerable collapsibility or vice versa, it indicates intermediate right atrial pressure (5-10 mmHg). This parameter garners popularity among POCUS practitioners due to its relative technical simplicity and its prognostic implications in heart failure patients[31].
However, isolated IVC ultrasound, despite its diagnostic utility, exhibits several limitations. One of the principal constraints lies in its interpretation, heavily reliant on the user's skill. Novice users might incorrectly identify neighboring structures such as the abdominal aorta, duodenum (in longitudinal views), or right atrium (in transverse views) as the IVC. It is noteworthy that the "sniff" test utilized to evaluate collapsibility may lack accuracy in hospitalized patients exhibiting varying degrees of respiratory strength. Additionally, the reliability of employing the IVC to estimate right atrial pressure is compromised in intubated patients due to unpredictable collapse induced by positive pressure ventilation. Furthermore, the 'cylinder effect' may impact measurements, where assessing the anteroposterior diameter in an incorrect plane can result in significant underestimation. Elevated intraabdominal pressure stemming from large abdominal ascites or pregnancy can influence the IVC diameter, emphasizing the importance of clinical correlation. Furthermore, it is pertinent to acknowledge that athletes and fitness enthusiasts may present with chronically dilated IVC alongside normal right atrial pressure[32,33]. In situations where IVC POCUS is impractical or deemed unreliable, the utilization of internal jugular vein POCUS can serve as an alternative method to estimate right atrial pressure. This approach mirrors the traditional visual assessment of jugular venous pulsations but facilitates reliable identification of the vein through ultrasound imaging.
VENOUS EXCESS ULTRASOUND
Venous congestion at the organ level arises from elevated right atrial pressure and diminished venous compliance. Doppler ultrasonography facilitates the assessment of blood flow patterns in systemic veins, including the hepatic vein, portal vein, and intra-renal vessels, which are pivotal for detecting venous congestion. While prior studies have scrutinized individual venous waveforms, a scoring system known as the venous excess ultrasound (VExUS) score was developed to quantify congestion. Beaubien-Souligny et al[34] devised the VExUS score after analyzing 145 patients undergoing cardiac surgery. Their findings revealed that severe flow abnormalities in Doppler patterns in at least two of the aforementioned three veins, coupled with a dilated IVC measuring 2 cm or more, exhibited the strongest correlation with subsequent AKI (HR: 3.69, 95%CI: 1.65-8.24, P = 0.001). It is noteworthy that the VExUS score outperformed central venous pressure alone in predicting AKI.
Components of VExUS and the scoring system
The typical hepatic vein Doppler waveform resembles a central venosus pressure tracing and is characterized by four distinct waves: S, V, D, and A. The S wave, a negative (below-the-baseline) deflection, manifests during ventricular systole when blood is drawn into the right atrium due to the motion of the tricuspid annulus toward the cardiac apex. Following this, V wave arises at the end-systole when the tricuspid annulus reverts to its regular position, leading to an increase in right atrial pressure. The V wave may manifest either above or below the baseline. Another negative deflection, the D wave, appears during ventricular diastole as the tricuspid valve opens, representing the passive filling of the right atrium. At end-diastole, the A wave, characterized by a slight, positive deflection, becomes apparent due to the increased right atrial pressure resulting from atrial contraction. Typically, the S wave exhibits a larger magnitude than the D wave, indicating an S > D pattern. As the right atrial pressure increases, the pressure gradient between the hepatic veins and the right atrium diminishes, causing reduced venous return during systole, resulting in an S < D pattern. With further increases in right atrial pressure, the S wave reverses, appearing above the baseline. While the S wave reverses in congestive states, in conditions of impaired diastolic filling, such as pericardial tamponade, reversed D waves can be identified[35,36]. It is advisable to obtain simultaneous electrocardiogram (EKG) tracing alongside hepatic vein Doppler whenever possible to prevent the misidentification of S and D waves[32]. The S wave corresponds to the R wave of the EKG, while the D wave aligns with the T wave.
In contrast to the hepatic vein, the portal vein lacks distinct S and D waves and maintains a continuous pattern with slight undulations corresponding to the A wave. It is separated from the IVC by hepatic sinusoids. The waveform appears above-the-baseline as blood flow in the main portal vein is directed towards the transducer. As right atrial pressure increases, transmitting to the portal vein across the sinusoids, it becomes more pulsatile. This pulsatility can be measured using the pulsatility fraction, calculated as (Vmax - Vmin ÷ Vmax) × 100, where Vmax and Vmin represent the highest and lowest velocities in a cardiac cycle, respectively. Typically, a pulsatility of greater than 30% is considered abnormal, and a pulsatility of greater than 50% is considered severely abnormal. The flow in the renal parenchymal veins, which are the interlobar veins, reflects the downstream impact of renal arterial pressure and interstitial edema within the encapsulated kidneys. Therefore, Doppler interrogation focuses on interlobar veins rather than the main renal vein (‘intrarenal’ venous Doppler). In normal state, blood flow in interlobar veins typically exhibits continuous flow, akin to the portal vein, but is seen below the baseline, indicating flow away from the transducer. As right atrial pressure rises, the veins become less compliant, resulting in pulsatile flow. This leads to the emergence of a biphasic pattern characterized by distinct systolic (S) and diastolic (D) waves. With further increases in right atrial pressure, the flow pattern transitions to a monophasic pattern, where only the D wave remains below the baseline. This pattern closely resembles the Doppler pattern observed in hepatic veins, where the S wave is reversed but may not be clearly visualized as it is obscured by the arterial waveform above.
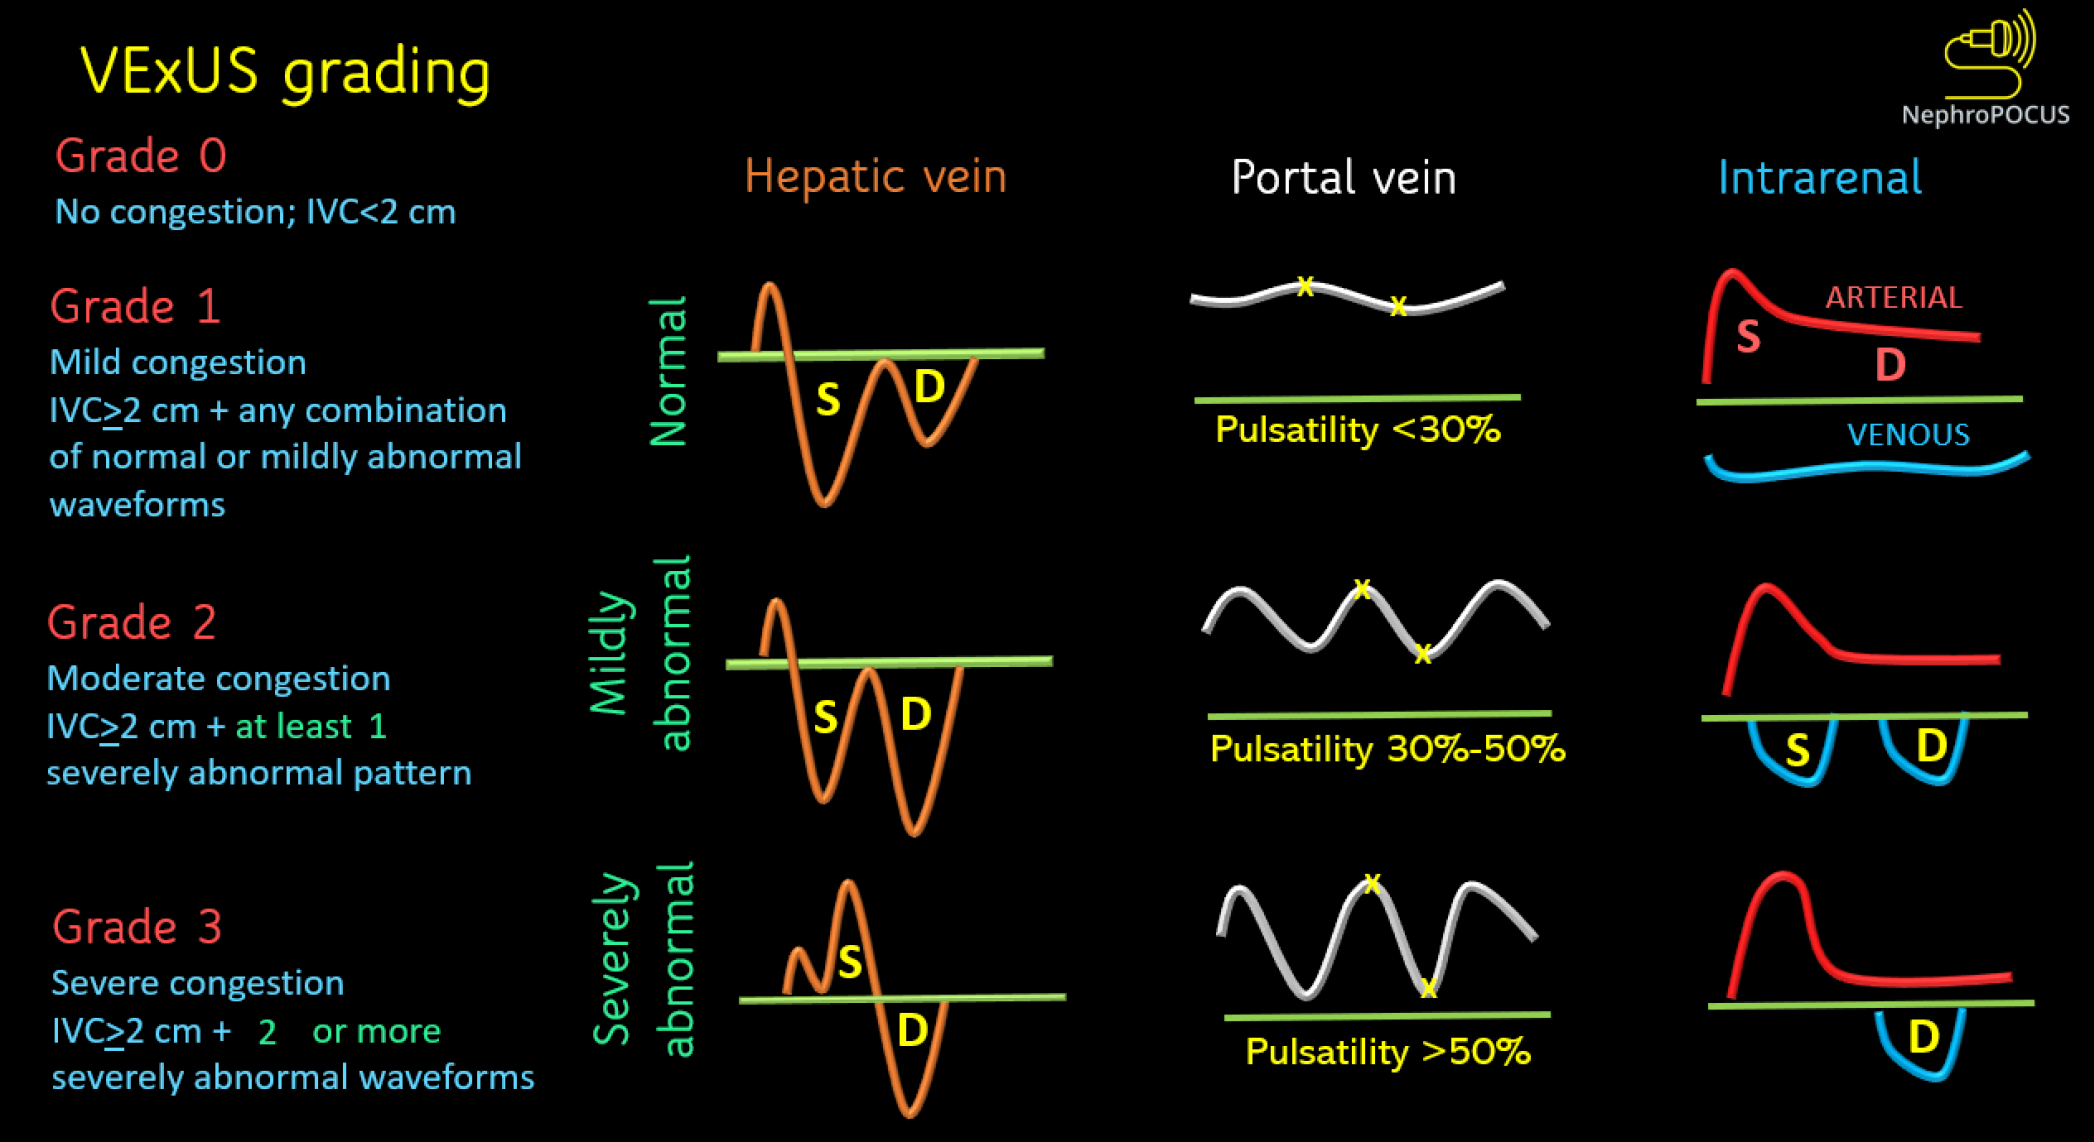
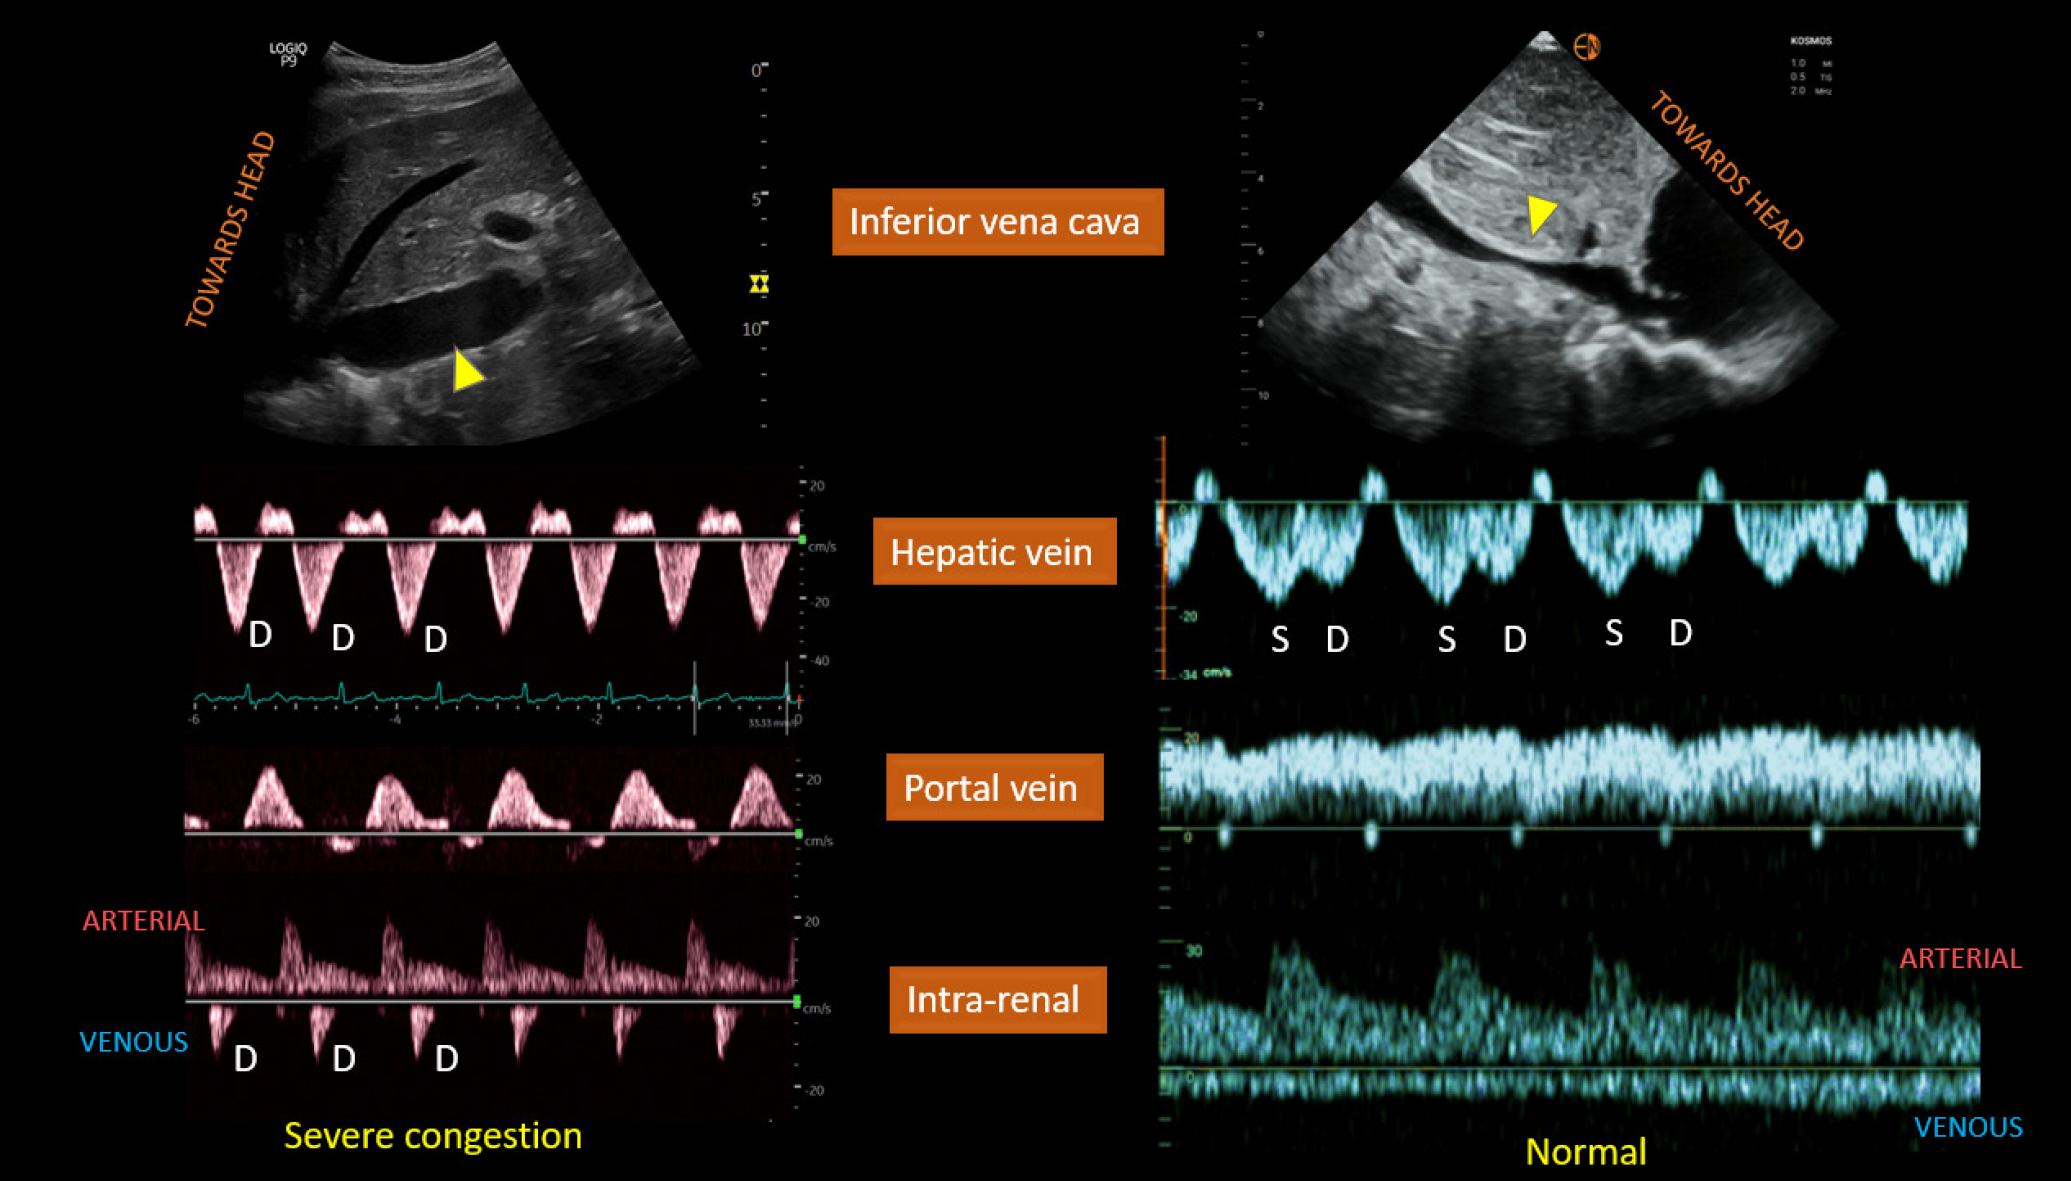
The VExUS scoring is depicted in Figure 3. Simply put, when the IVC is plethoric (i.e., right atrial pressure is elevated), severe congestion is identified by severe flow abnormalities in at least two veins, while moderate congestion is characterized by severe flow abnormality in at least one of the above-discussed veins. If there are only slight abnormalities in the flow patterns, it suggests mild congestion. However, if the right atrial pressure is not elevated, venous congestion is considered absent. In such cases, caution is warranted regarding the technical limitations of the IVC in estimating the right atrial pressure. Figure 4 illustrates the significant differences in sonographic observations between severe congestion and a normal state.
Figure 3 Venous excess ultrasound grading system.
When the diameter of inferior vena cava is more than or equal to 2 cm, three grades of congestion are defined based on the severity of abnormalities on hepatic, portal, and renal parenchymal venous Doppler. Hepatic vein Doppler is considered mildly abnormal when the systolic (S) wave is smaller than the diastolic (D) wave, but still below the baseline; it is considered severely abnormal when the S-wave is reversed. Portal vein Doppler is considered mildly abnormal when the pulsatility is 30% to 50%, and severely abnormal when it is ≥ 50%. Asterisks represent points of pulsatility measurement. Renal parenchymal vein Doppler is mildly abnormal when it is pulsatile with distinct S and D components, and severely abnormal when it is monophasic with D-only pattern. VExUS: Venous excess ultrasound. Reused from NephroPOCUS.com with permission (https://nephropocus.com/about/).
Figure 4 Left panel.
Plethoric inferior vena cava (IVC) (arrowhead), only diastolic (D) wave below-the-baseline on hepatic vein Doppler, pulsatile portal vein Doppler, and D-only or monophasic renal parenchymal vein Doppler obtained from a patient with fluid overload and severe venous congestion; right panel: normal-appearing IVC with < 2 cm diameter (arrowhead) and normal venous waveforms. Citation: Koratala A, Ronco C, Kazory A. Diagnosis of Fluid Overload: From Conventional to Contemporary Concepts. Cardiorenal Med. 2022; 12: 141-154. Copyright ©Silverchair Publisher 2022. Published by Karger Publishers.
Clinical application
Numerous studies have illustrated the effectiveness of venous Doppler waveforms and the VExUS score in predicting outcomes for patients experiencing volume overload across diverse clinical scenarios[37-48]. The dynamic nature of these waveforms, shifting in response to volume loading or decongestive therapy, renders them invaluable for monitoring treatment effectiveness[49-55]. In critical care settings, VExUS not only quantifies the congestion but also aids in planning de-resuscitative measures like diuretic therapy and renal replacement therapy. The quantification of effective decongestion, as reflected by improvement in Doppler patterns, serves as a valuable tool for adjusting diuretic doses, setting ultrafiltration goals during renal replacement therapy, evaluating ventilator weaning tolerance, preparing for safe extubation, and planning transfers from the ICU to medical floors as adequate tissue perfusion is restored and organ dysfunction begins to resolve. Often, the ICU-downgraded patients report symptomatic improvement as their health status improves compared to their initial presentation. Sole dependance on body weight and intake-output documentation may not provide an accurate assessment of their true congestive status. Hence, similar to a stethoscope offering objective insights into cardiopulmonary dysfunction, the combined use of VExUS, lung POCUS, and focused cardiac ultrasound by internists at the bedside offers more comprehensive data that can be promptly integrated into the management plan. This integration involves adjusting the maintenance dose of diuretics and optimizing discharge plans. Following discharge, in outpatient settings, VExUS can aid in titrating diuretic dosage and frequency, potentially reducing instances of heart failure exacerbation and subsequent hospital readmissions. In essence, effective use of POCUS ensures continuity of care across various clinical settings[9,56-58].
Limitations
VExUS should be regarded as one element of bedside hemodynamic assessment and should not be conflated with volume status. Importantly, VExUS cannot discriminate between volume and pressure overload. For example, conditions such as chronic pulmonary hypertension and tricuspid regurgitation may already present baseline abnormalities in these waveforms. The same applies to hemodynamically significant pulmonary embolism or cardiac tamponade, where alterations occur due to pressure overload. Given the differing treatments for these conditions, sole reliance on VExUS is not advisable, necessitating a comprehensive evaluation. Arrhythmias also impact Doppler profiles, particularly in hepatic vein Doppler. Moreover, patients with cirrhosis and portal hypertension may exhibit abnormal hepatic and portal vein waveforms at baseline, which do not accurately reflect right atrial pressure[32,59]. Similarly, advanced chronic kidney disease patients may present with pulsatile intrarenal venous Doppler without evidence of elevated RAP or venous congestion in other regions. Additionally, acquiring intrarenal Doppler poses technical challenges, with reported failure rates as high as 30%[60].
EXTENDED VEXUS
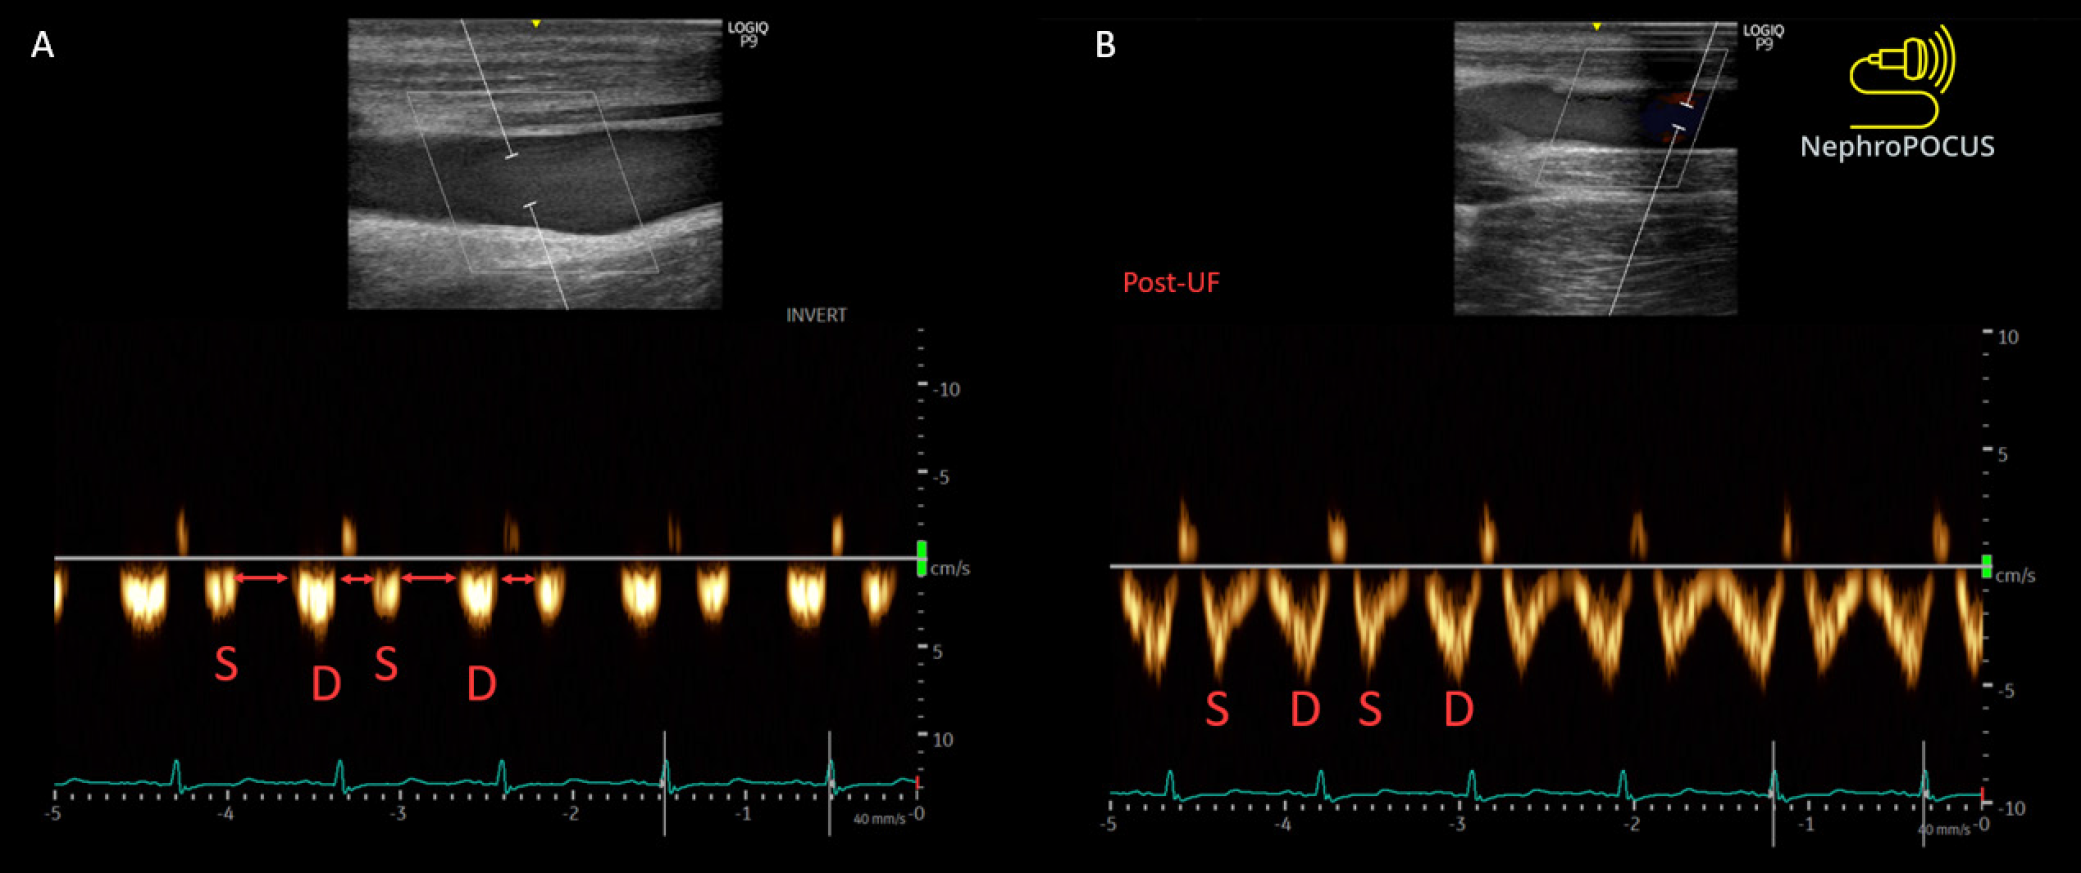
The concept of extended VExUS, or eVExUS, has been introduced to incorporate Doppler assessment of additional veins like the internal jugular, superior vena cava, splenic, and femoral veins in situations where examination of primary veins is limited[23]. Like the individual components of the original VExUS, these veins have been independently studied and have proven useful in assessing the impact of right atrial pressure on venous flow[61]. Particularly, there is a current emphasis on femoral vein Doppler, primarily due to its perceived simplicity. Increased pulsatility and flow interruption in the femoral vein suggest venous congestion with a reasonable level of specificity Figure 5. However, the relatively low sensitivity of this parameter may render it unreliable for ruling out congestion[62]. An intriguing study found that femoral vein Doppler demonstrates good accuracy in detecting venous congestion and exhibits moderate agreement with VExUS grading (Kappa value of 0.62, P < 0.001). Nonetheless, the weak correlation with central venous pressure in this study underscores the caution required due to low sensitivity[63]. Additional studies incorporating combined use of multiple Doppler waveforms are imperative before the widespread acceptance of eVExUS.
Figure 5 Improvement in the femoral vein stasis index (i.e., reduced venous flow interruptions (red arrows) after fluid removal in a dialysis patient.
S = systolic wave, D = diastolic wave. Reused from NephroPOCUS.com with permission (https://nephropocus.com/about/).
CONCLUSION
VExUS is emerging as a promising diagnostic tool in the management of patients with heart failure and other congestive states. However, like any evolving modality, it possesses specific areas requiring refinement. Its accuracy hinges on a clinician's adeptness in handling spectral Doppler, necessitating appropriate training and practice. Its reliability diminishes in cases of renal and liver parenchymal disease. Although POCUS training is increasingly incorporated into medical curricula and residencies, it falls short in advanced applications such as VExUS. Specialties like critical care medicine and nephrology should take the lead in mastering it and instructing general internists and medical residents. In practice, internists bear primary responsibility for managing heart failure patients and ensuring adequate decongestion before discharge. Despite the potential benefits, reluctance persists among medical practitioners to adopt VExUS and POCUS extensively until these applications demonstrate significant improvements in patient outcomes. Accurate diagnosis is pivotal for enhancing patient outcomes as it facilitates appropriate treatment leading to better results. However, expecting a diagnostic modality alone to enhance outcomes without an independent treatment providing such benefits is unrealistic. Conventional diagnostic methods like chest X-rays, CT scans, or echocardiograms have not shown positive outcomes or mortality benefits in randomized control trials. Nevertheless, physicians continue to utilize them due to the critical role of accurate diagnosis in their practice. Numerous factors influence the outcomes of hospitalized patients, and while POCUS is unlikely to alter this reality, it does positively impact practical outcomes such as reducing healthcare costs, enhancing patients' understanding of their condition, and delivering faster and more accurate diagnoses[64-68]. Future research should explore the optimal integration of VExUS and POCUS, in general, into diverse clinical scenarios alongside other noninvasive and invasive hemodynamic data. This approach aims to personalize and enhance patient care.
Provenance and peer review: Invited article; Externally peer reviewed.
Peer-review model: Single blind
Specialty type: Critical Care Medicine
Country of origin: United States
Peer-review report’s classification
Scientific Quality: Grade A
Novelty: Grade B
Creativity or Innovation: Grade B
Scientific Significance: Grade A
P-Reviewer: Naeije R S-Editor: Qu XL L-Editor: A P-Editor: Che XX


