©The Author(s) 2016.
World J Crit Care Med. Feb 4, 2016; 5(1): 7-11
Published online Feb 4, 2016. doi: 10.5492/wjccm.v5.i1.7
Published online Feb 4, 2016. doi: 10.5492/wjccm.v5.i1.7
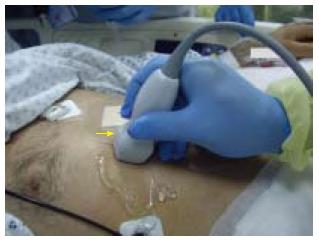
Figure 1 A figure demonstrating the technique to measure the inferior vena cava diameter longitudinally.
A small print convex array probe with a frequency of 3-5 MHZ is located in the mid-clavicular line at 90 degrees perpendicular to the skin. The marker is pointing proximally towards the head (arrow).
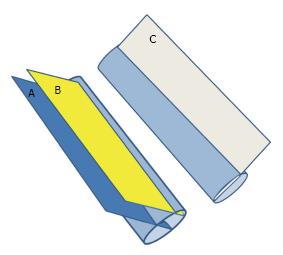
Figure 2 Three dimensional diagram showing the longitudinal ultrasound measurement of the antero-posterior diameter.
Measurements depend on the site and angle at which it crosses the IVC. Section A is the proper one as it crosses the IVC vertically at the midpoint. Section B crosses the IVC vertically but peripherally and gives a false low measurement of the IVC diameter. Section C crosses the IVC obliquely and gives a false high measurement of the IVC diameter. IVC: Inferior vena cava.
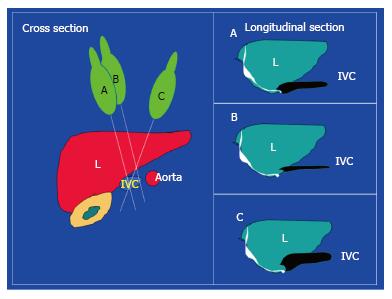
Figure 3 Cross section of the abdomen on the left side of the figure showing the liver, inferior vena cava, and aorta.
The B mode longitudinal ultrasound image will depend on the angle between the plane of the ultrasound section and the IVC. Three different planes are shown on the cross section (A-B-C) and the corresponding longitudinal IVC images are shown to the right. Longitudinal section A is the proper one as it crosses the IVC vertically at the midpoint. Section B crosses the IVC vertically but peripherally and gives a false low measurement of the IVC diameter. Section C crosses the IVC obliquely and gives a false high IVC diameter measurement. IVC: Inferior vena cava.
Figure 4 Inferior vena cava measurements in a 39-year-old man who was in septic shock and complete renal failure.
The upper image is a transverse cross sectional B mode showing the aorta (yellow arrow) and the IVC (white arrow). The lower image is an M mode showing the IVC measurement (A-A) which is 59 mm indicating that the patient was hypovolemic. IVC: Inferior vena cava.
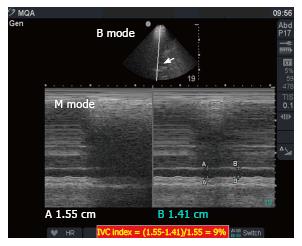
Figure 5 Two point five liters of crystalloids were given to the previous patient over 35 min and repeated measurements of the inferior vena cava diameter were performed.
The upper image is a transverse cross sectional B mode showing the IVC (white arrow). The lower image is an M mode showing that the IVC increased to a maximum 1.55 cm with an IVC index of 9% [(1.55-1.41)/1.55]. A-A in the M mode represents the maximum IVC diameter while B-B represents the minimum IVC diameter. IVC: Inferior vena cava.
- Citation: Abu-Zidan FM. Optimizing the value of measuring inferior vena cava diameter in shocked patients. World J Crit Care Med 2016; 5(1): 7-11
- URL: https://www.wjgnet.com/2220-3141/full/v5/i1/7.htm
- DOI: https://dx.doi.org/10.5492/wjccm.v5.i1.7


