
















Copyright: ©Author(s) 2026.
World J Crit Care Med. Jun 9, 2026; 15(2): 114264
Published online Jun 9, 2026. doi: 10.5492/wjccm.v15.i2.114264
Published online Jun 9, 2026. doi: 10.5492/wjccm.v15.i2.114264
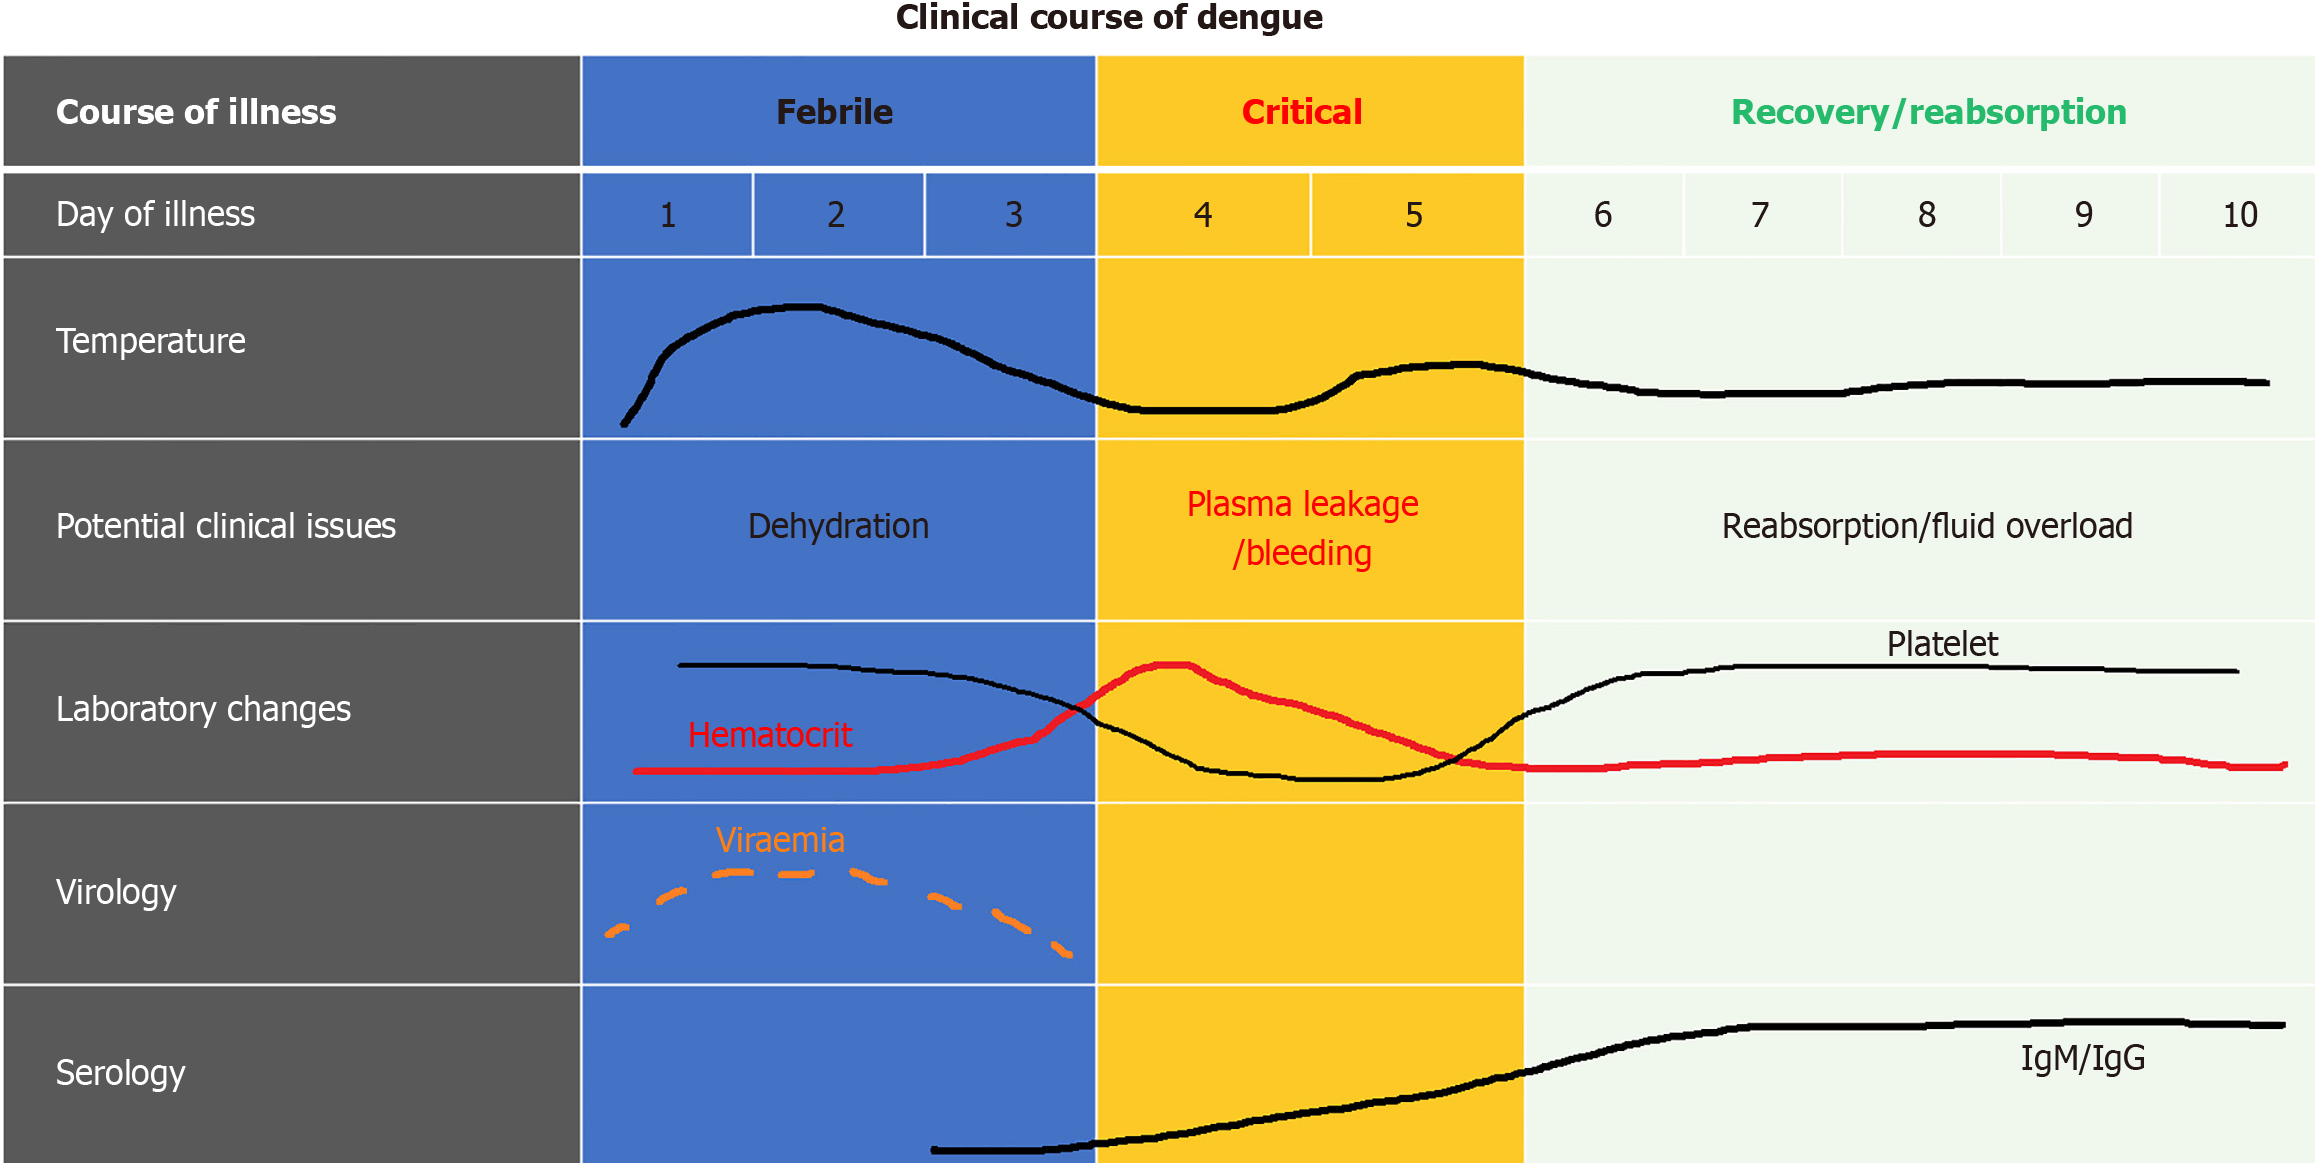
Figure 1 Three phases of dengue fever.
Dengue fever begins with febrile phase after an incubation period of 4 to 7 days. This is followed by critical phase which is characterised by thrombocytopenia and hemoconcentration. Severe dengue usually sets in during this phase. Recovery phase usually starts during day 6 to 8 of the illness. (Adapted from Malaysia CPG Management of Dengue Infection in Adults 2015).
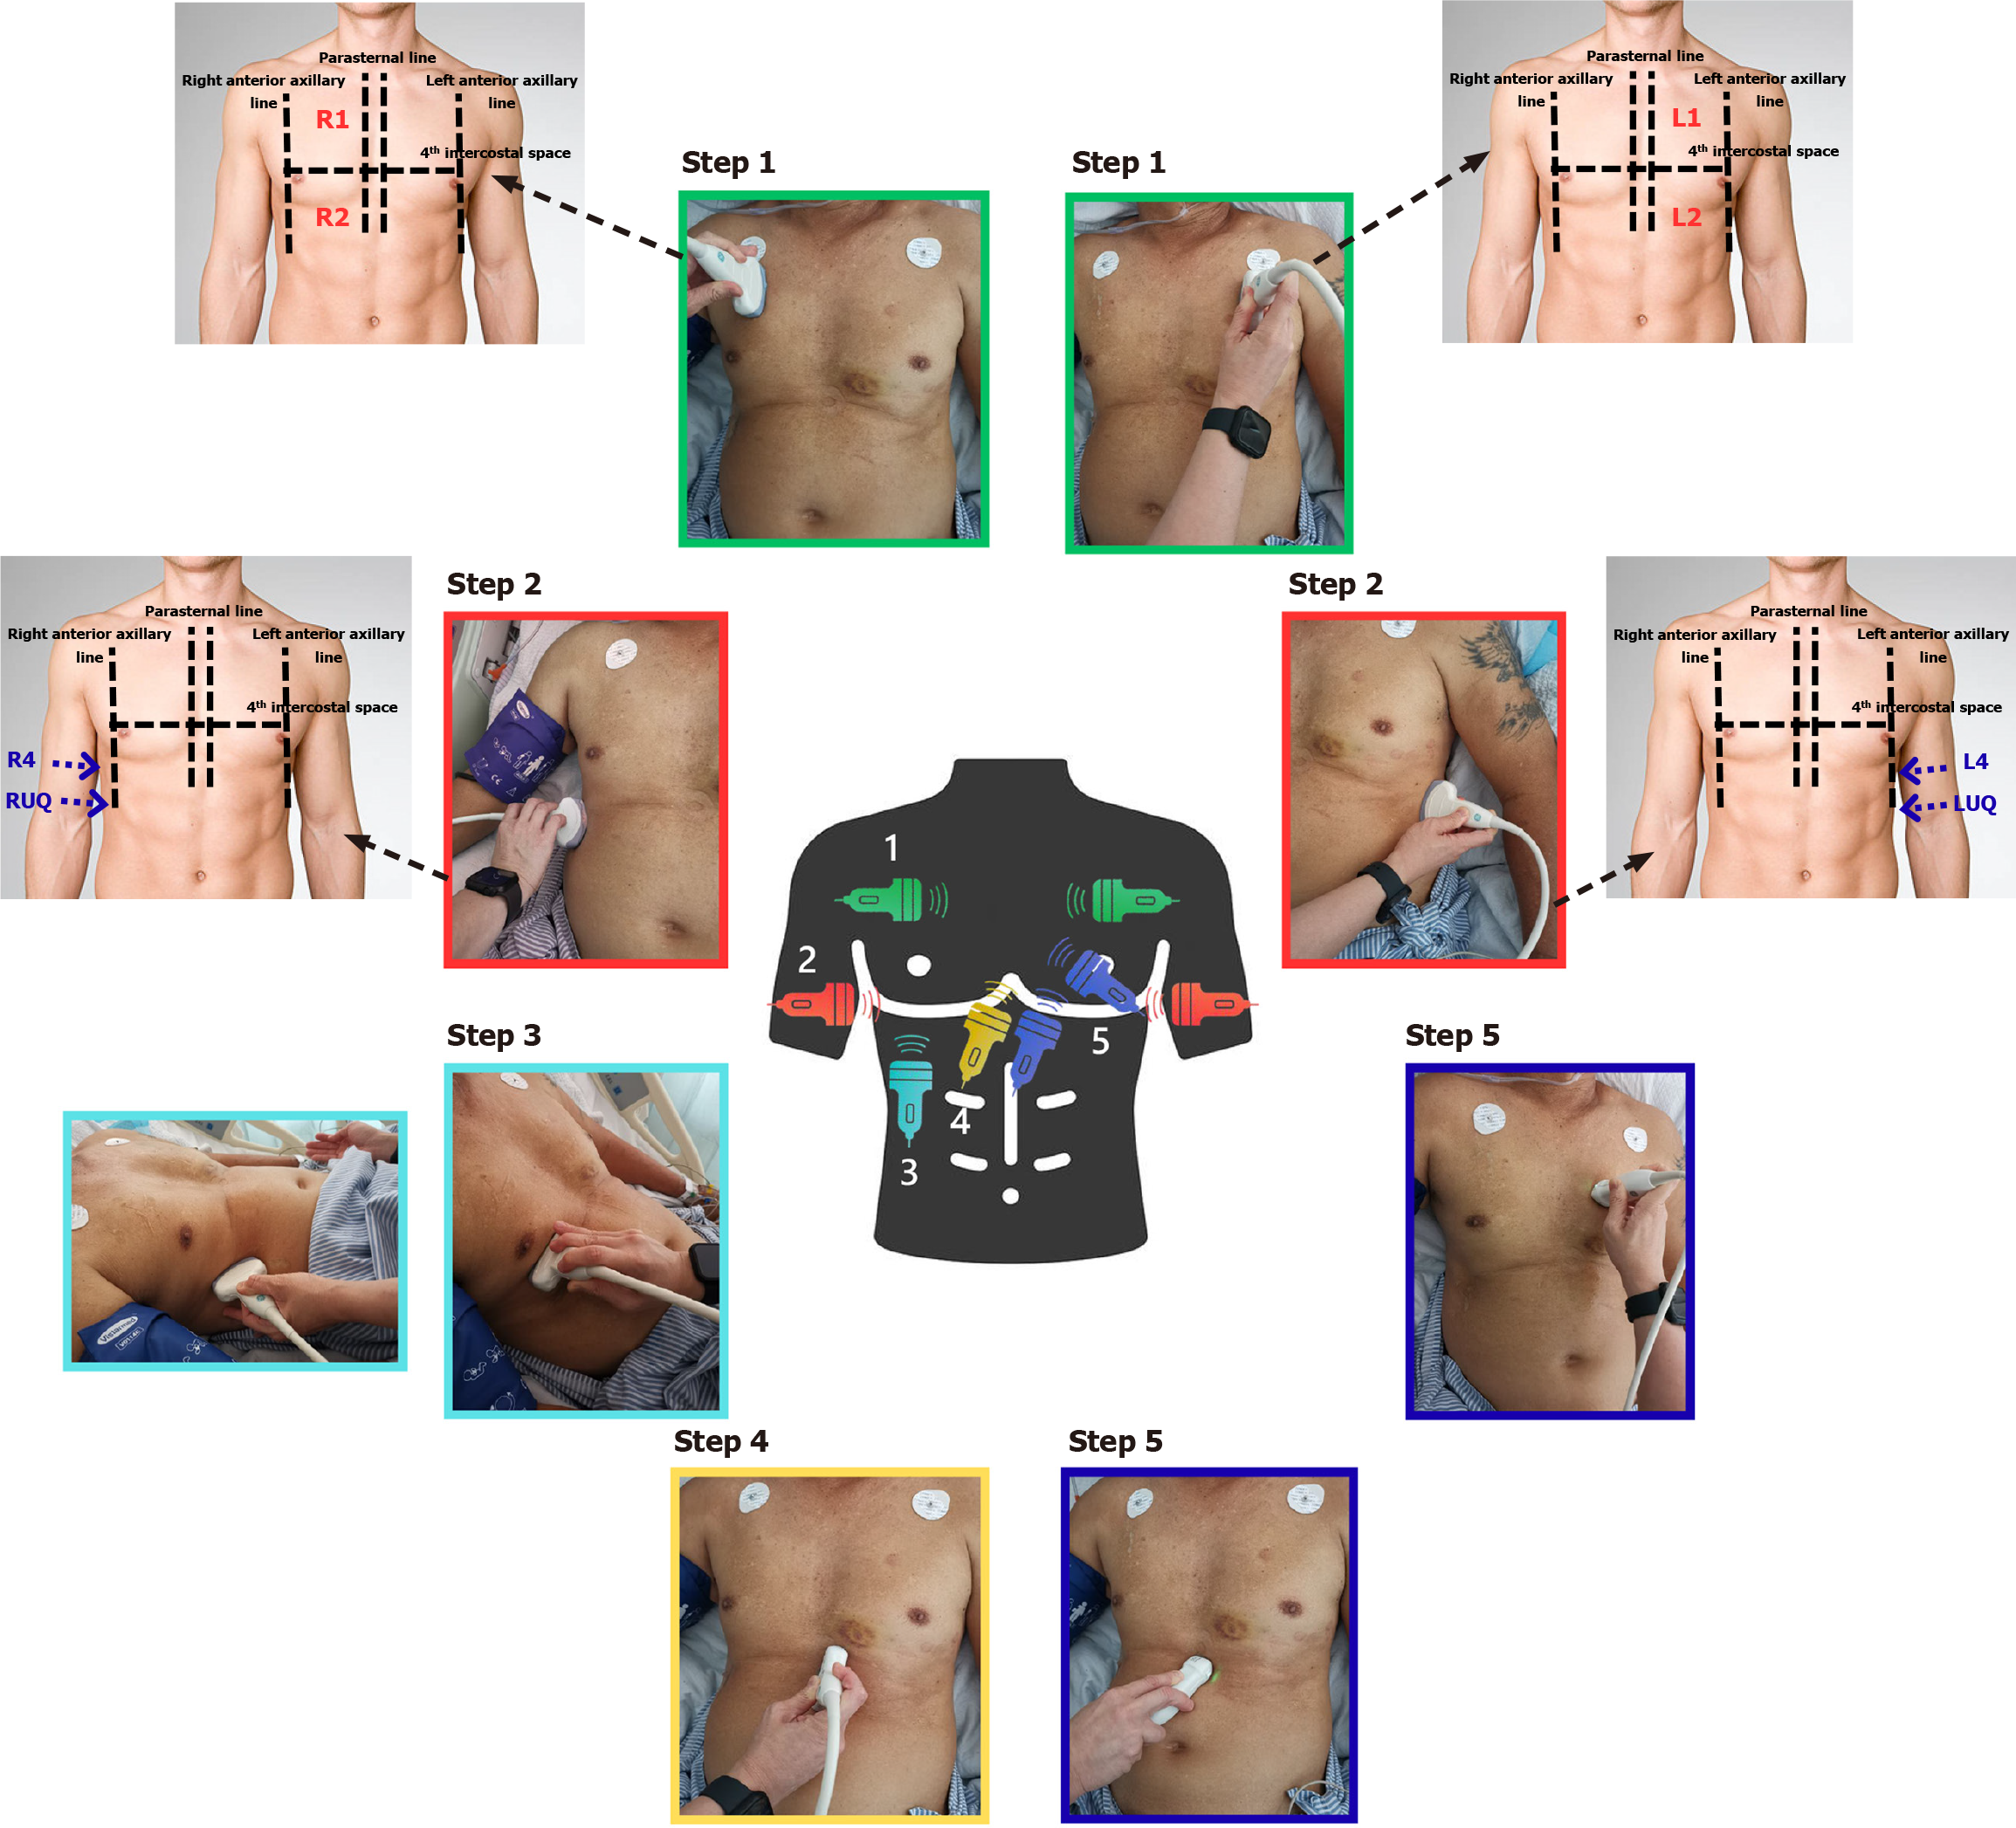
Figure 2 Overview of dengue assessment point-of-care ultrasound (POCUS) protocol.
Probe choice and placement are illustrated. Steps 1-3 for identifying signs of plasma leakage; steps 4-5 for assessment of fluid responsiveness and fluid intolerance. RUQ: Right upper quadrant; LUQ: Left upper quadrant.
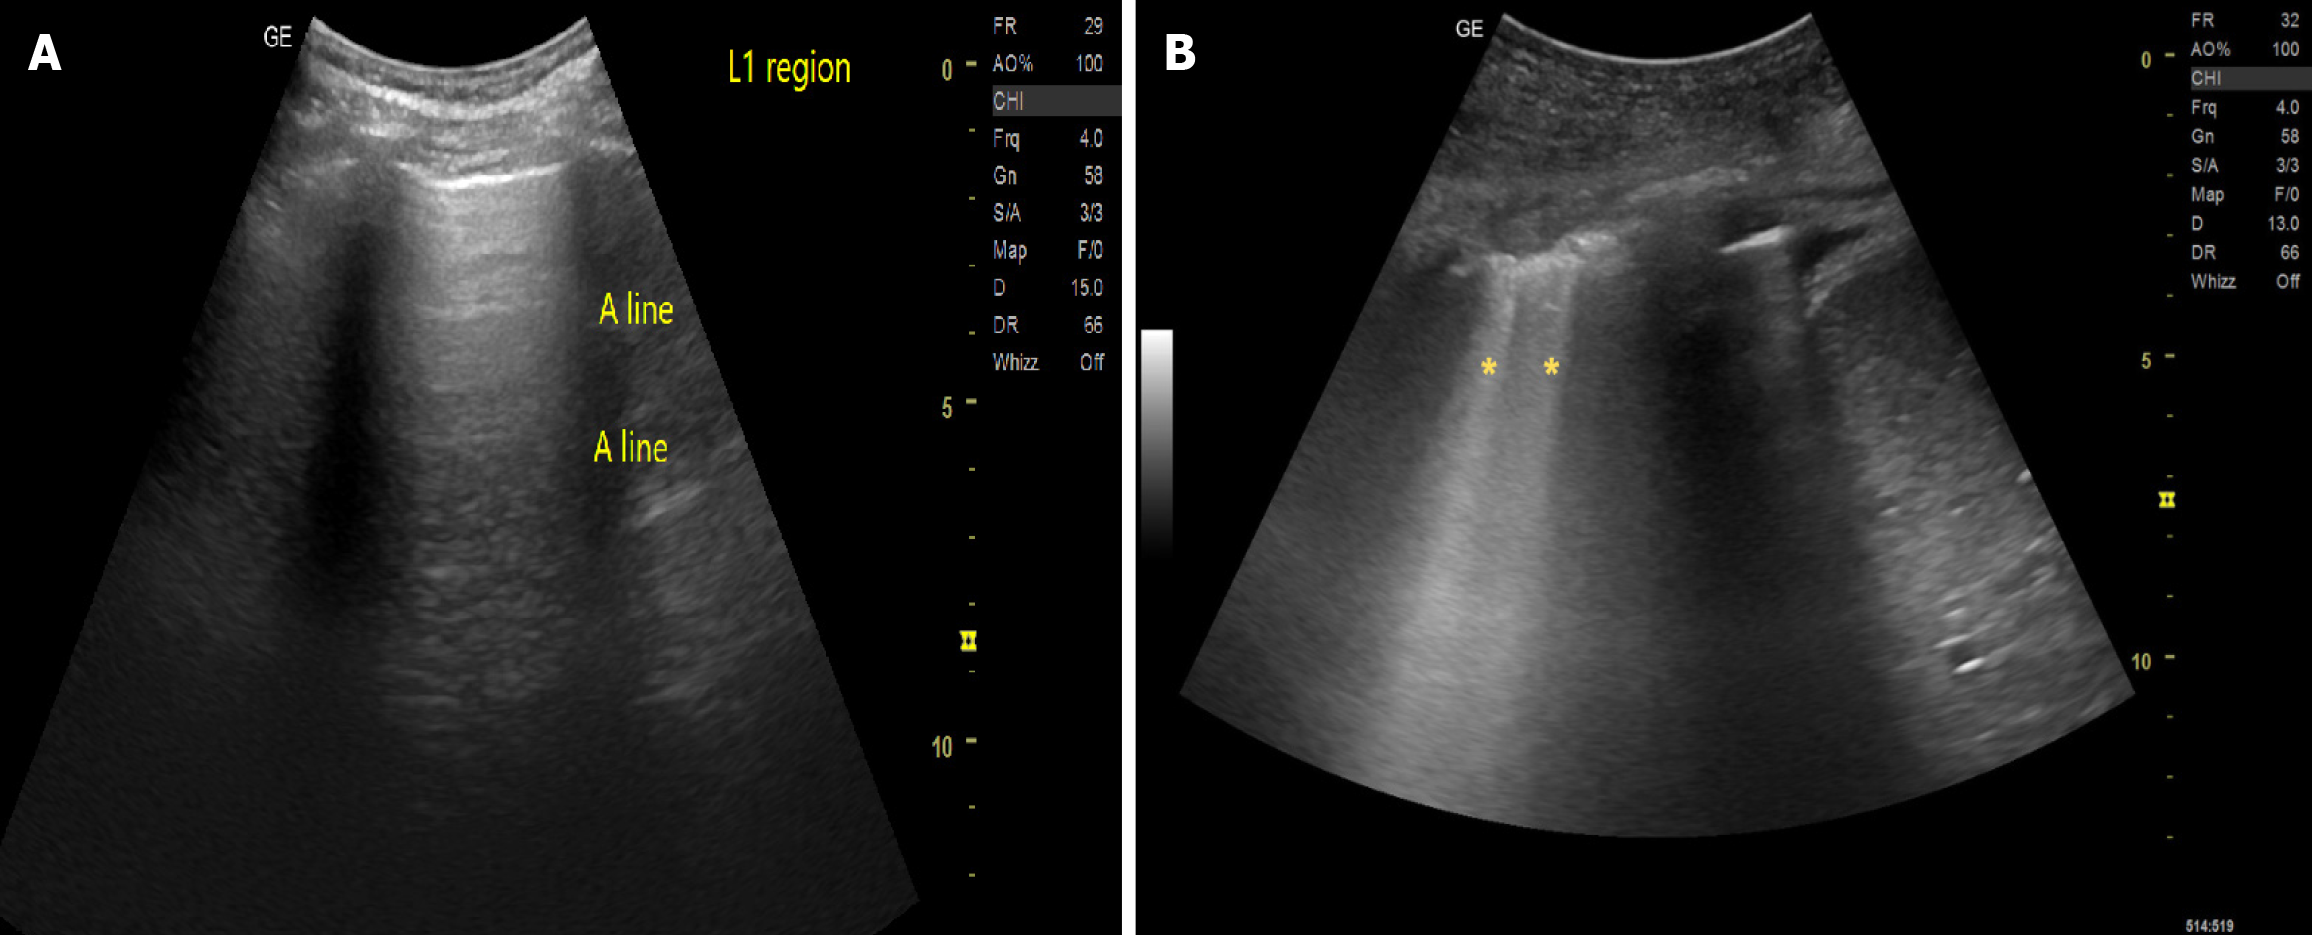
Figure 3 Lung ultrasound.
A: A-lines as a result of reverberation in normal aerated lung. It appears as a series of equally spaced horizontal lines; B: B-lines (yellow asterisks) due to discreet reverberation causing characteristic vertical comet-tail artifacts from interstitial edema.
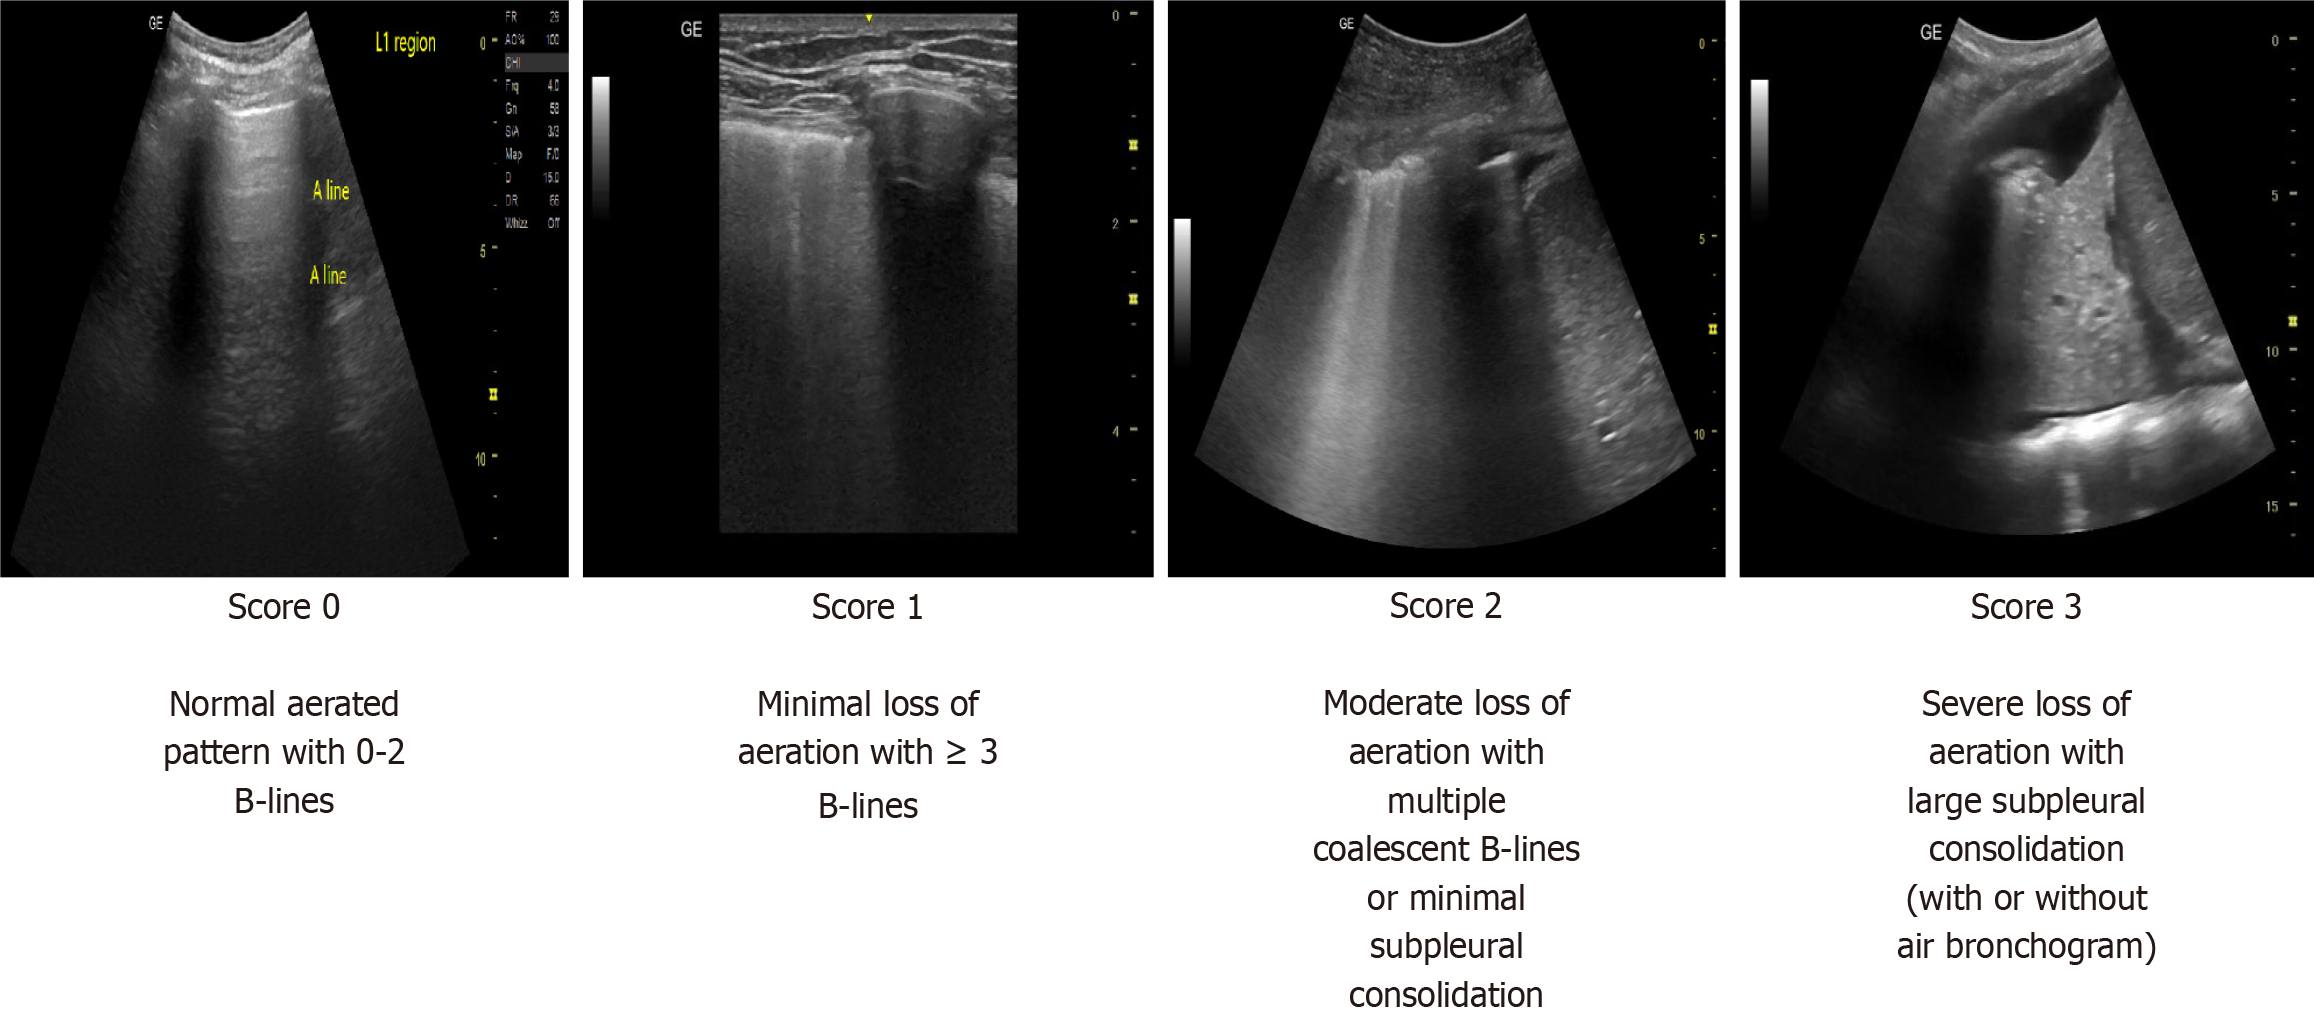
Figure 4 Lung ultrasound score.
Lung ultrasound score (LUS) ranging from 0 to 3 for each lung quadrant (R1-R4 and L1-L4). An LUS of 1 or 2 across the L1, L2, R1 and R2 regions may be suggestive of pulmonary interstitial edema in dengue fever, reflecting ongoing plasma leakage.
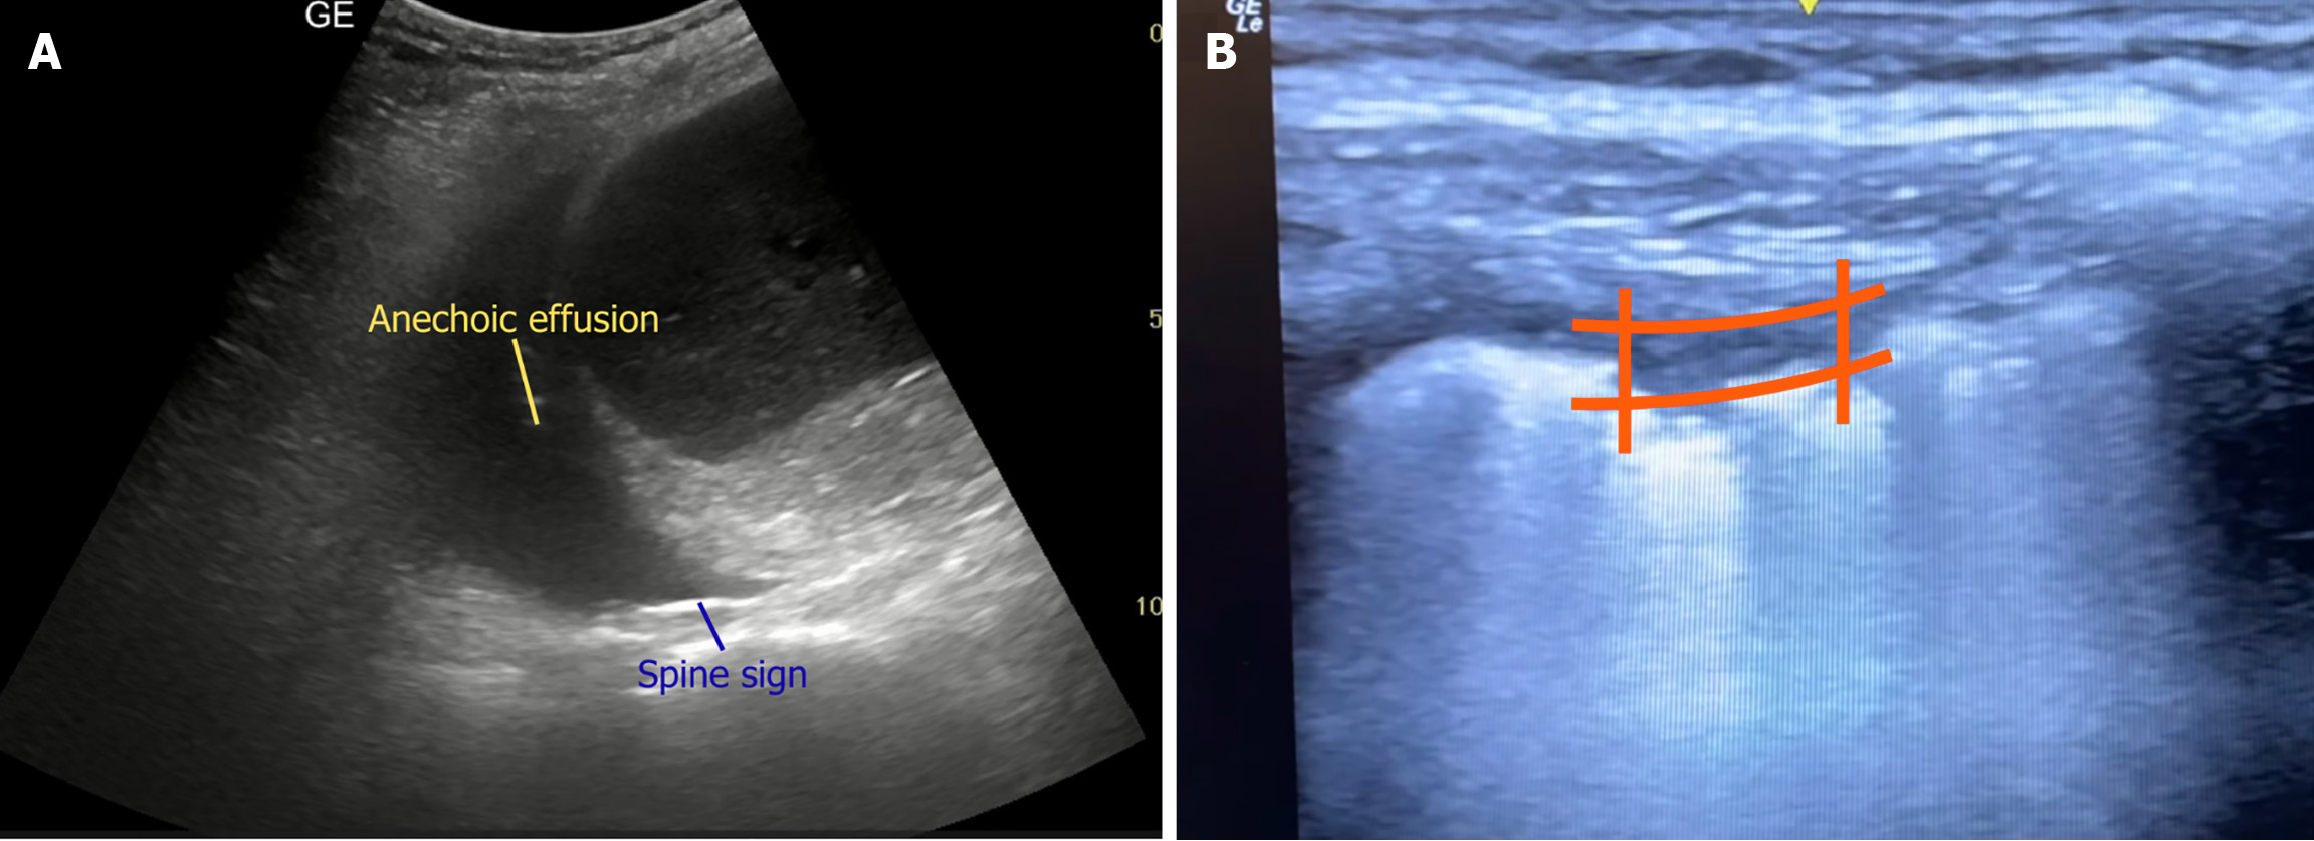
Figure 5 Ultrasonographic features of pleural effusion.
A: Pleural effusion manifests as anechoic collection above the diaphragm with presence of spine sign at R4 region; B: Quad sign suggestive of pleural effusion (R4 region). The orange lines mark the borders of the quad sign - vertical borders by the rib shadows and horizontal borders by parietal and visceral pleura respectively.
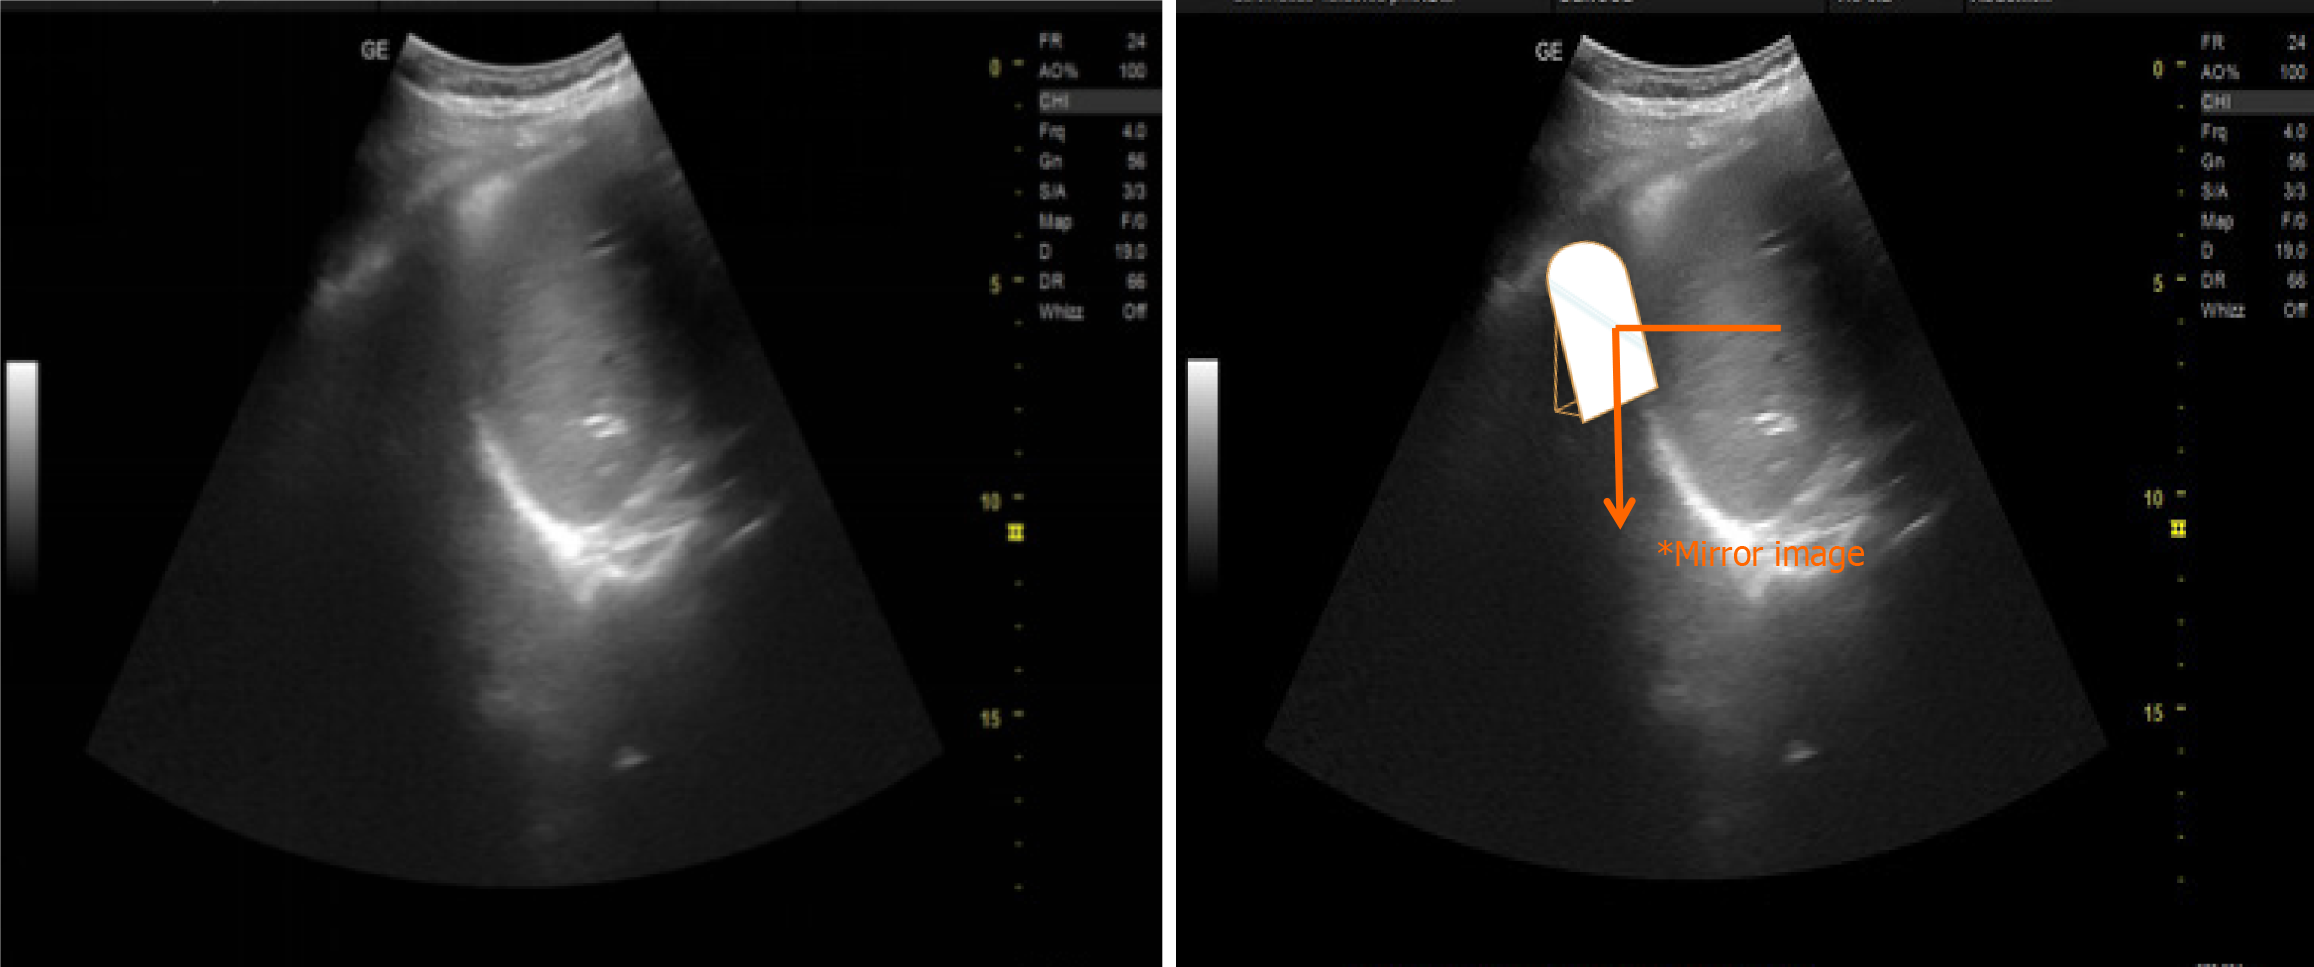
Figure 6 Mirror artifact.
The presence of mirror image artifact rules out pleural effusion. Orange asterisk denotes the mirror image of liver.
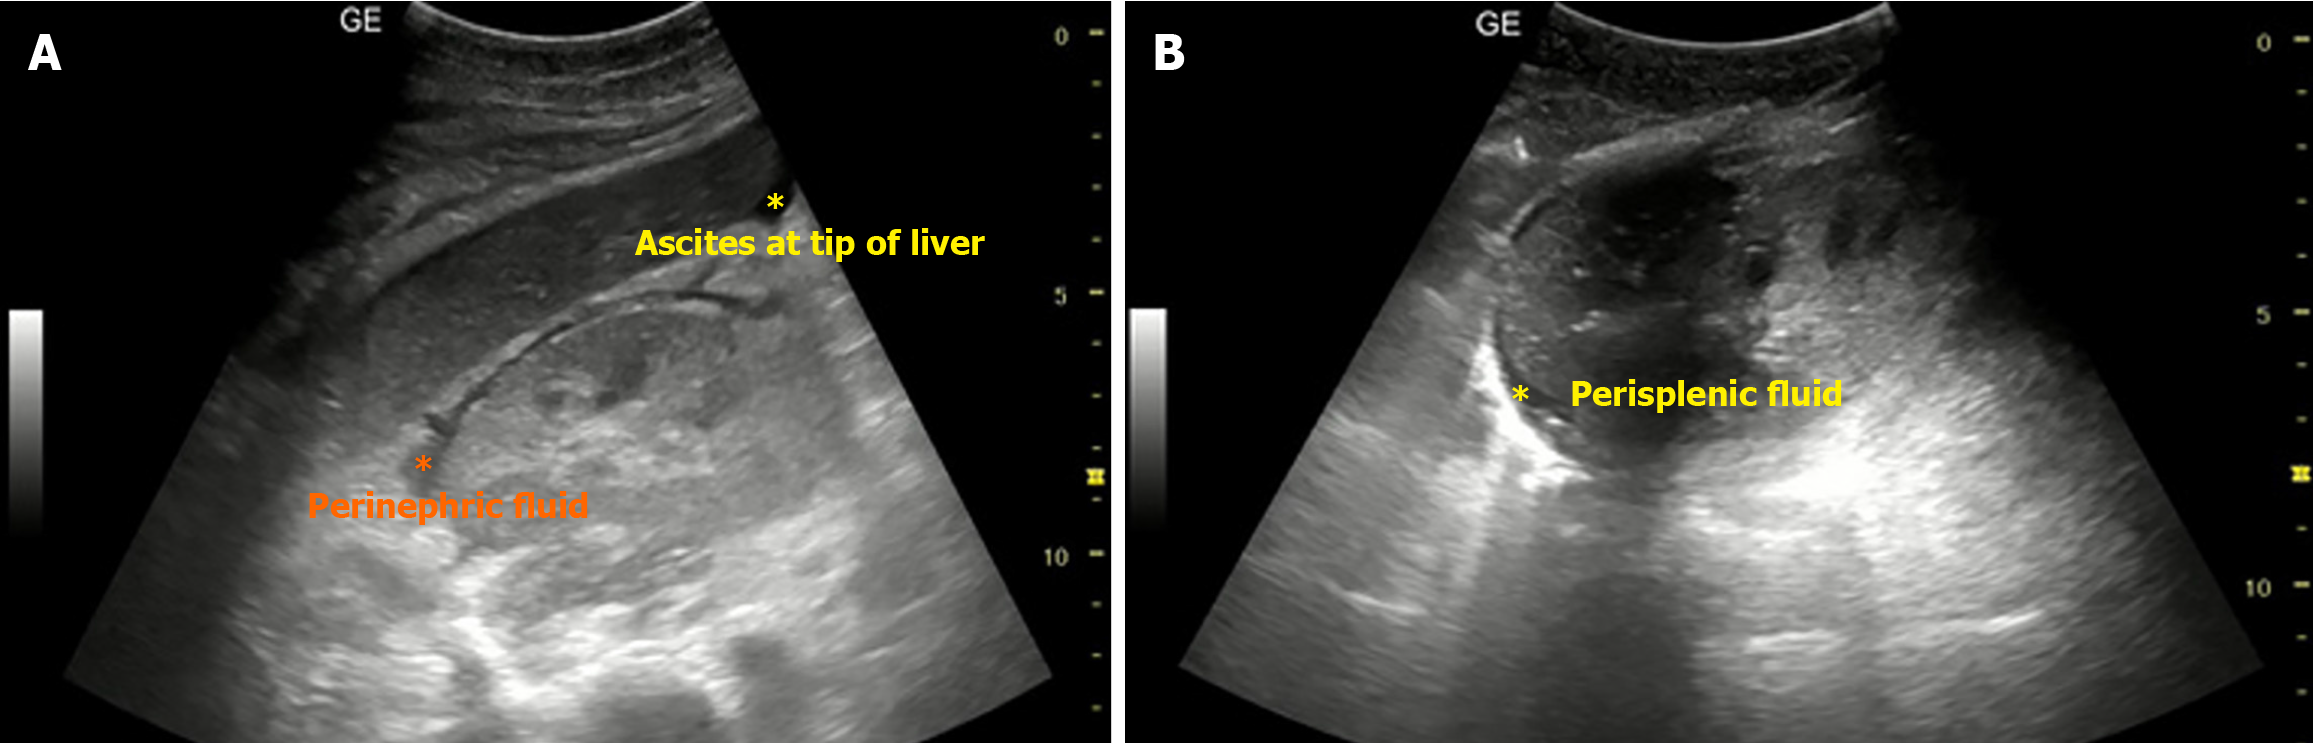
Figure 7 Ultrasonographic features of free fluid in abdomen.
A: Free fluid at hepatorenal pouch and perinephric fluid in dengue, suggestive of plasma leakage. Attention should be directed to the tip of the liver, as this is often the earliest site where fluid becomes detectable; B: Perisplenic fluid in dengue, suggestive of plasma leakage.
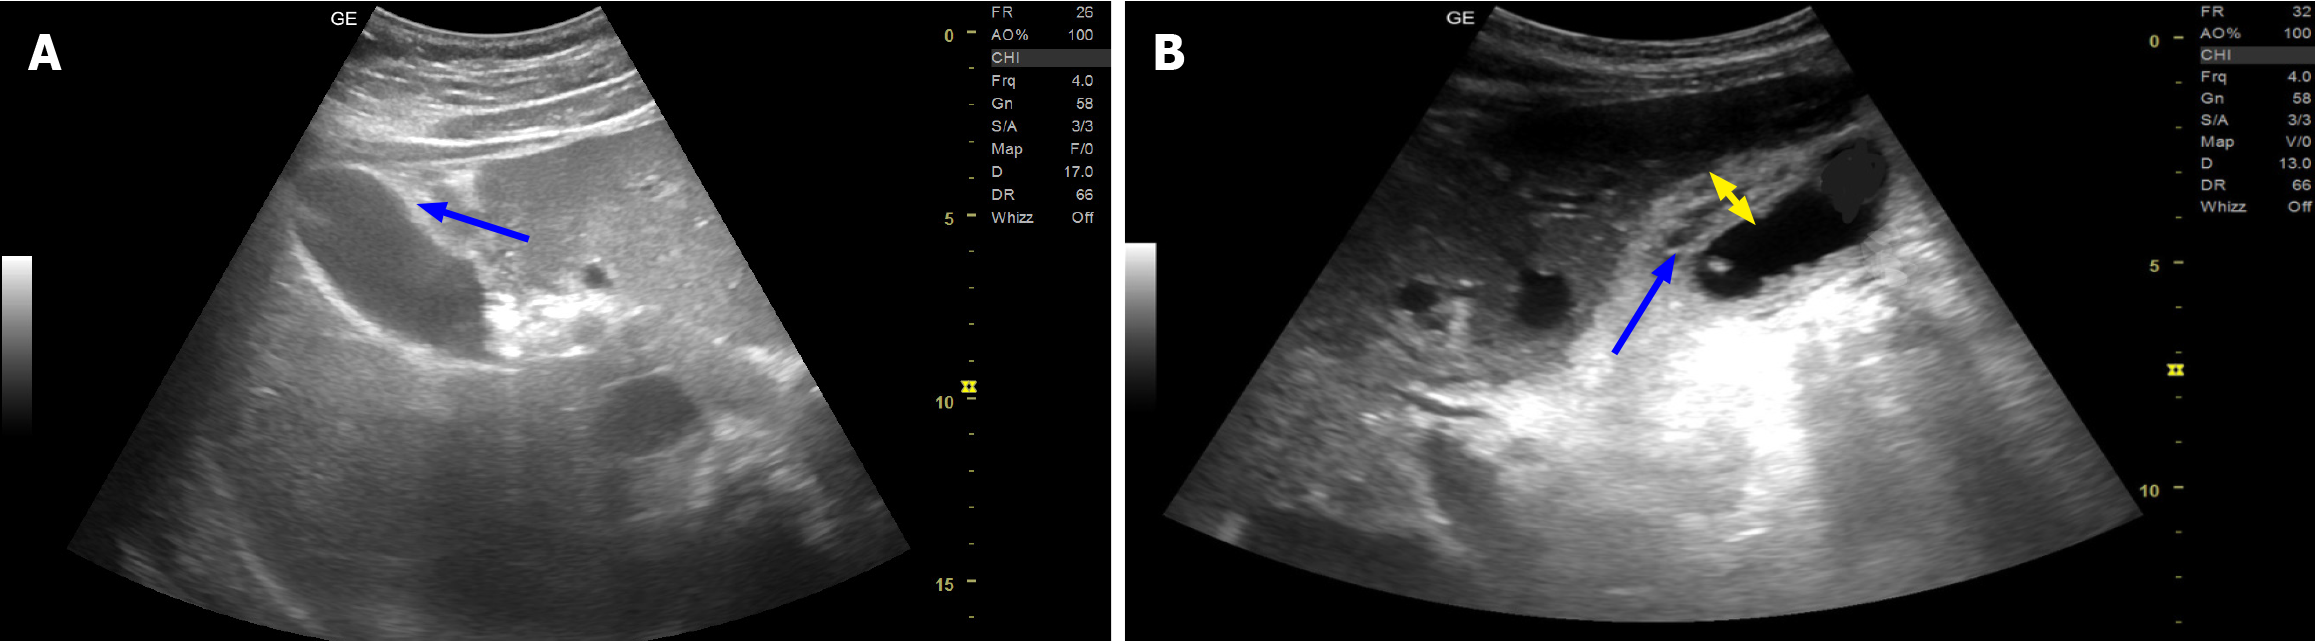
Figure 8 Gallbladder wall.
A: Anterior gallbladder wall (blue arrow) is used to measure the gallbladder wall thickness; B: Gallbladder wall thickening (yellow double arrowhead) with honeycombing pattern (blue arrow) in a severe dengue patient. Other patterns of gallbladder wall thickening include uniform echogenic pattern, striated or tram track pattern and asymmetric pattern.
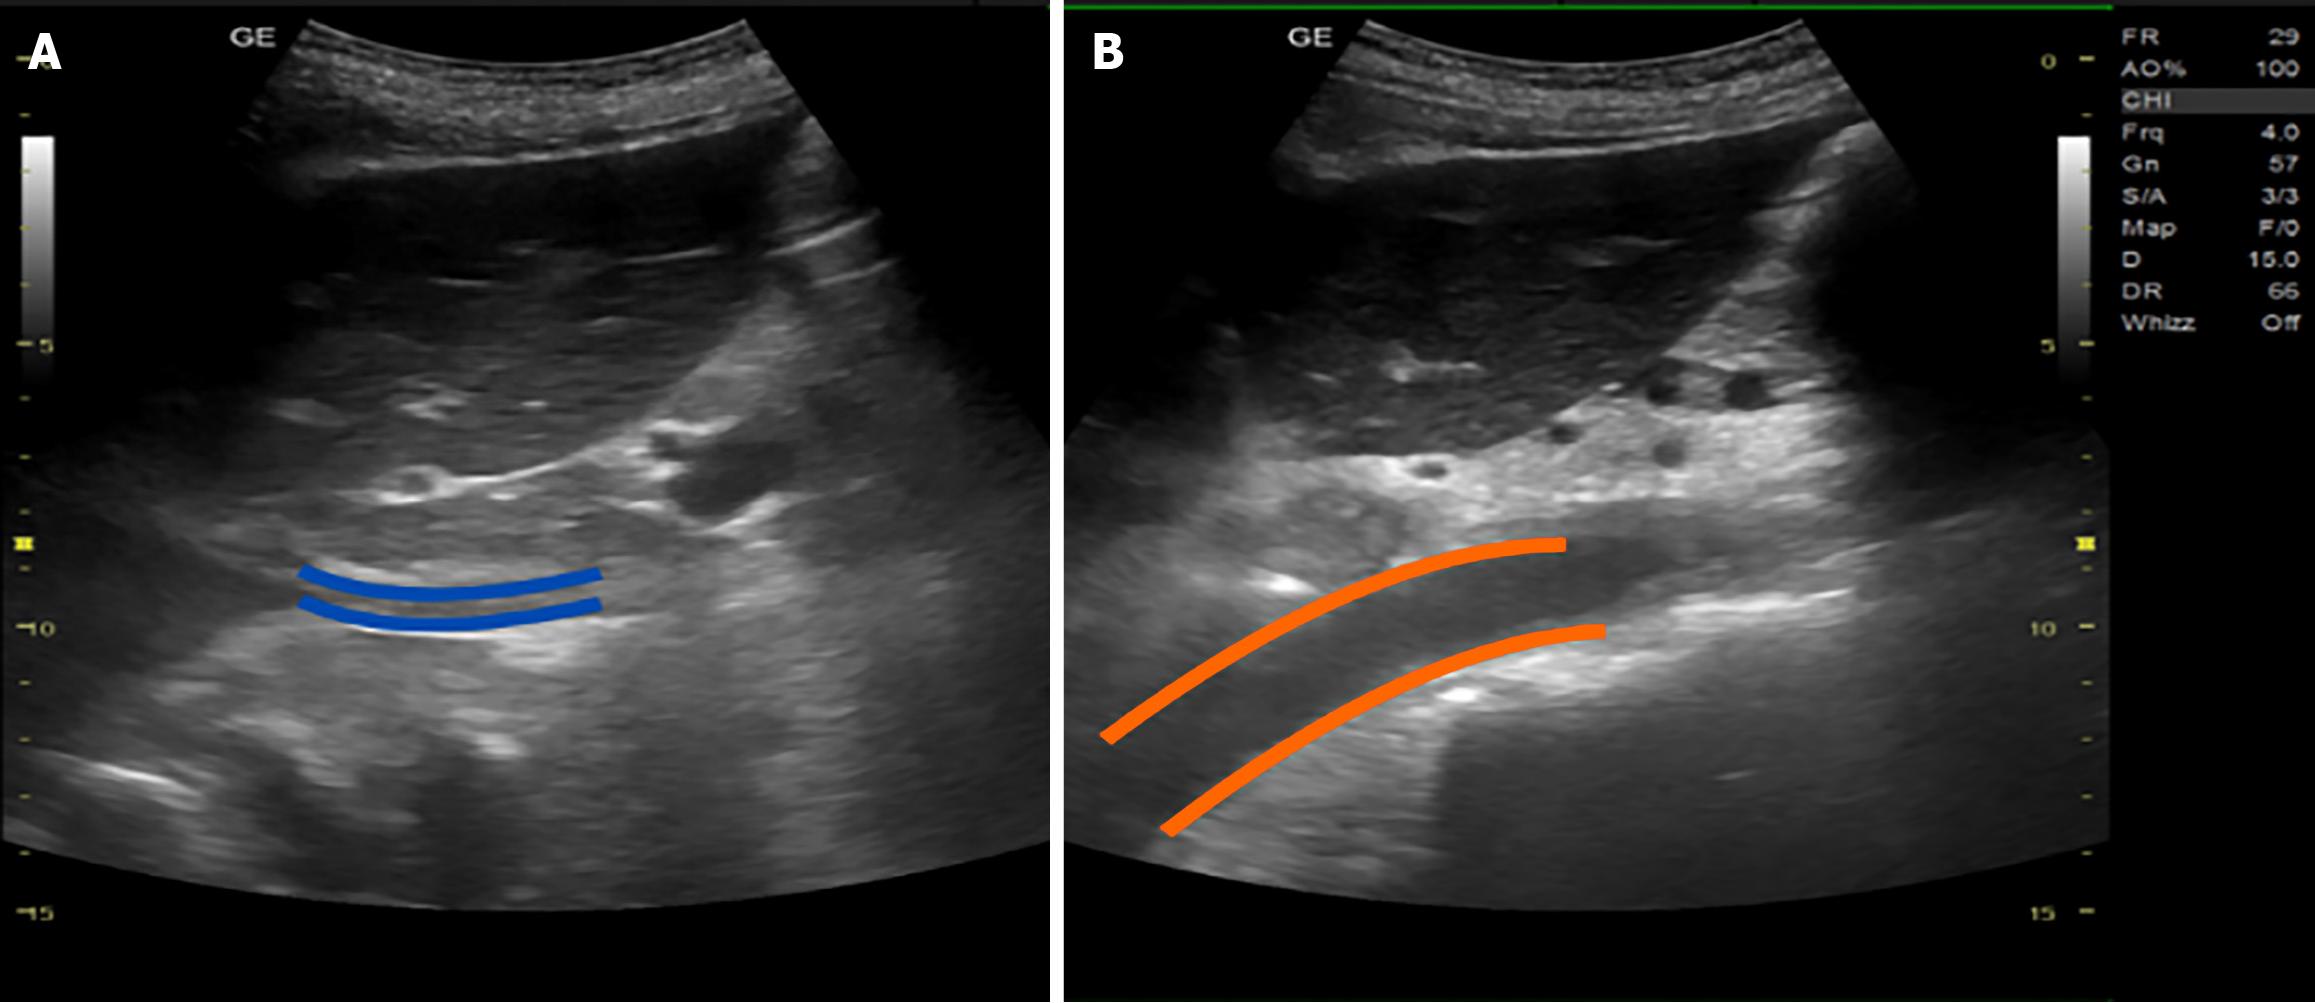
Figure 9 Inferior vena cava (blue marking) and abdominal aorta (orange marking) (longitudinal view).
Note that aorta has a thicker vessel wall and it is more medially located than inferior vena cava (IVC). Blue marking indicates IVC while orange marking indicates abdominal aorta.
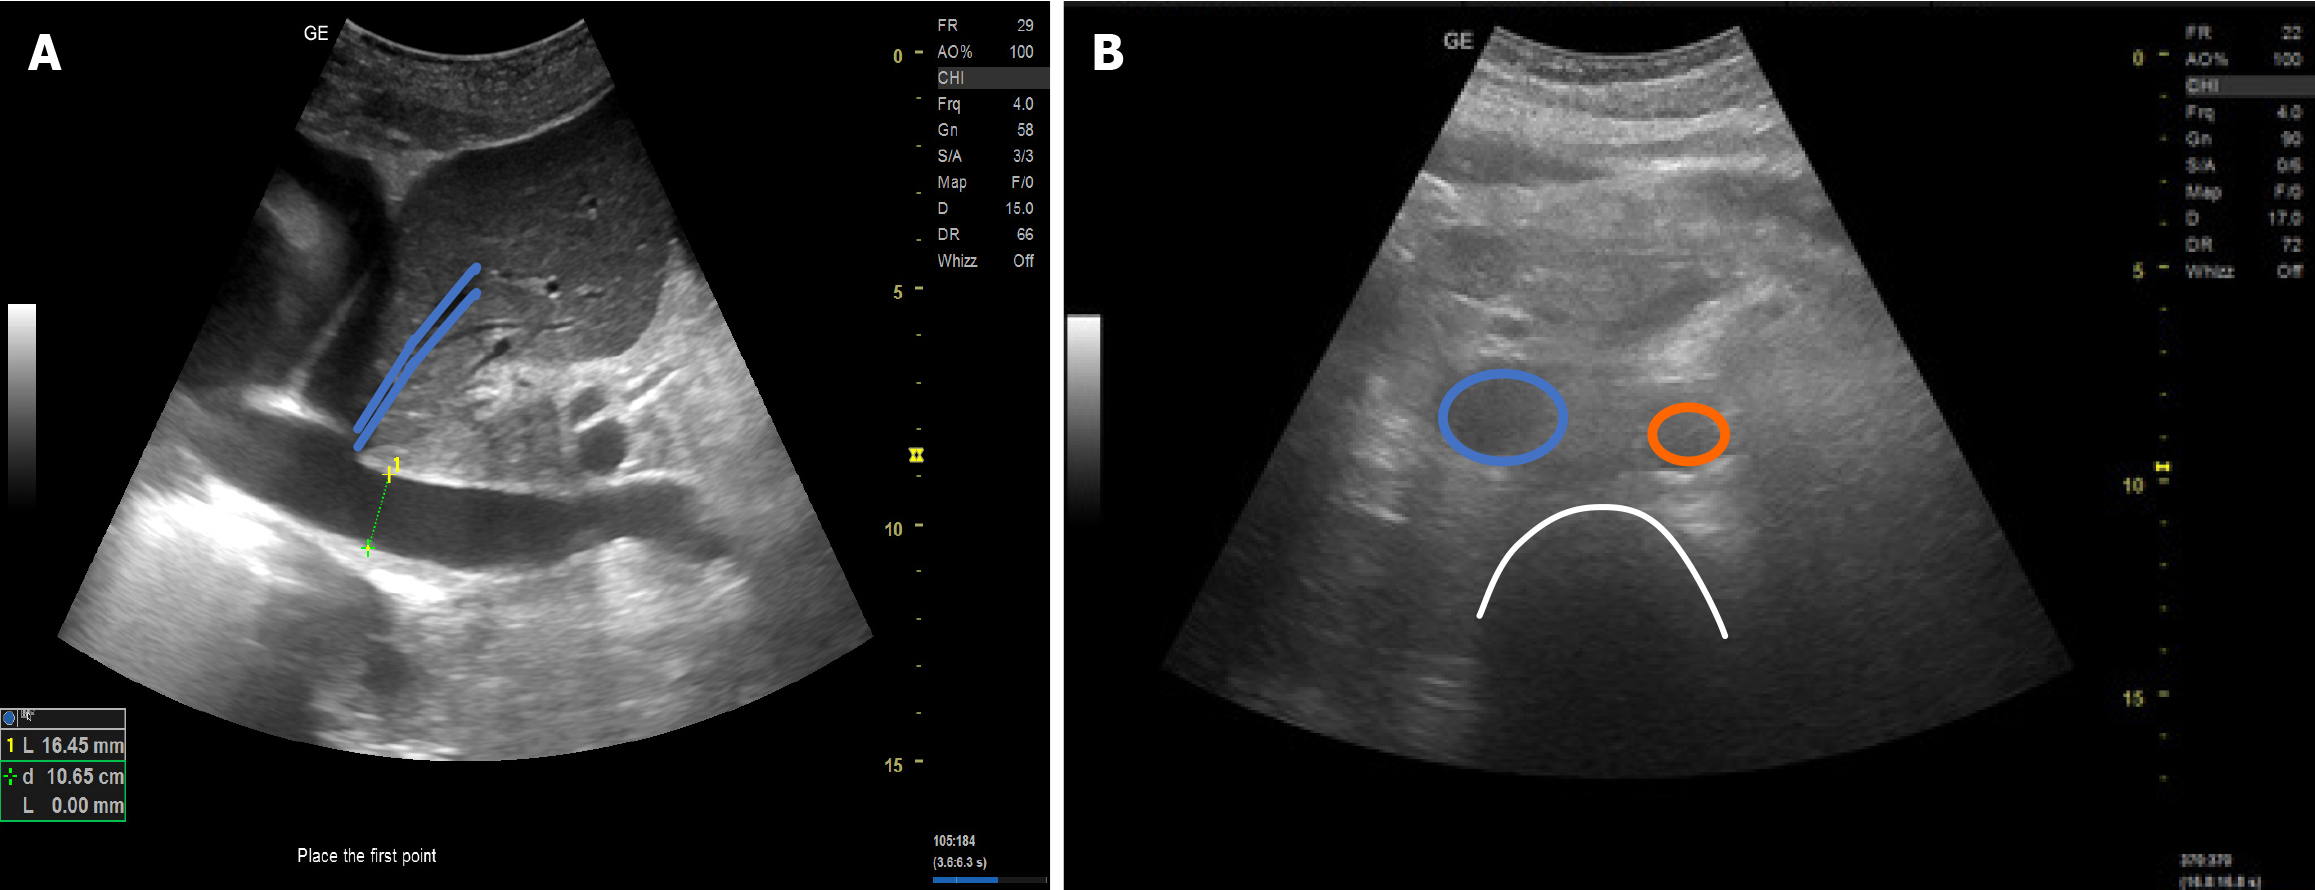
Figure 10 Inferior vena cava.
A: Longitudinal view. Blue marking annotates hepatic vein. Measurement of inferior vena cava (IVC) diameter at 3-5 cm away from the inferior cavoatrial junction or 1 cm away from hepatic vein-IVC junction; B: Transverse view. Blue marking annotates inferior vena cava; orange marking annotates abdominal aorta; white marking annotates thoracic spine.
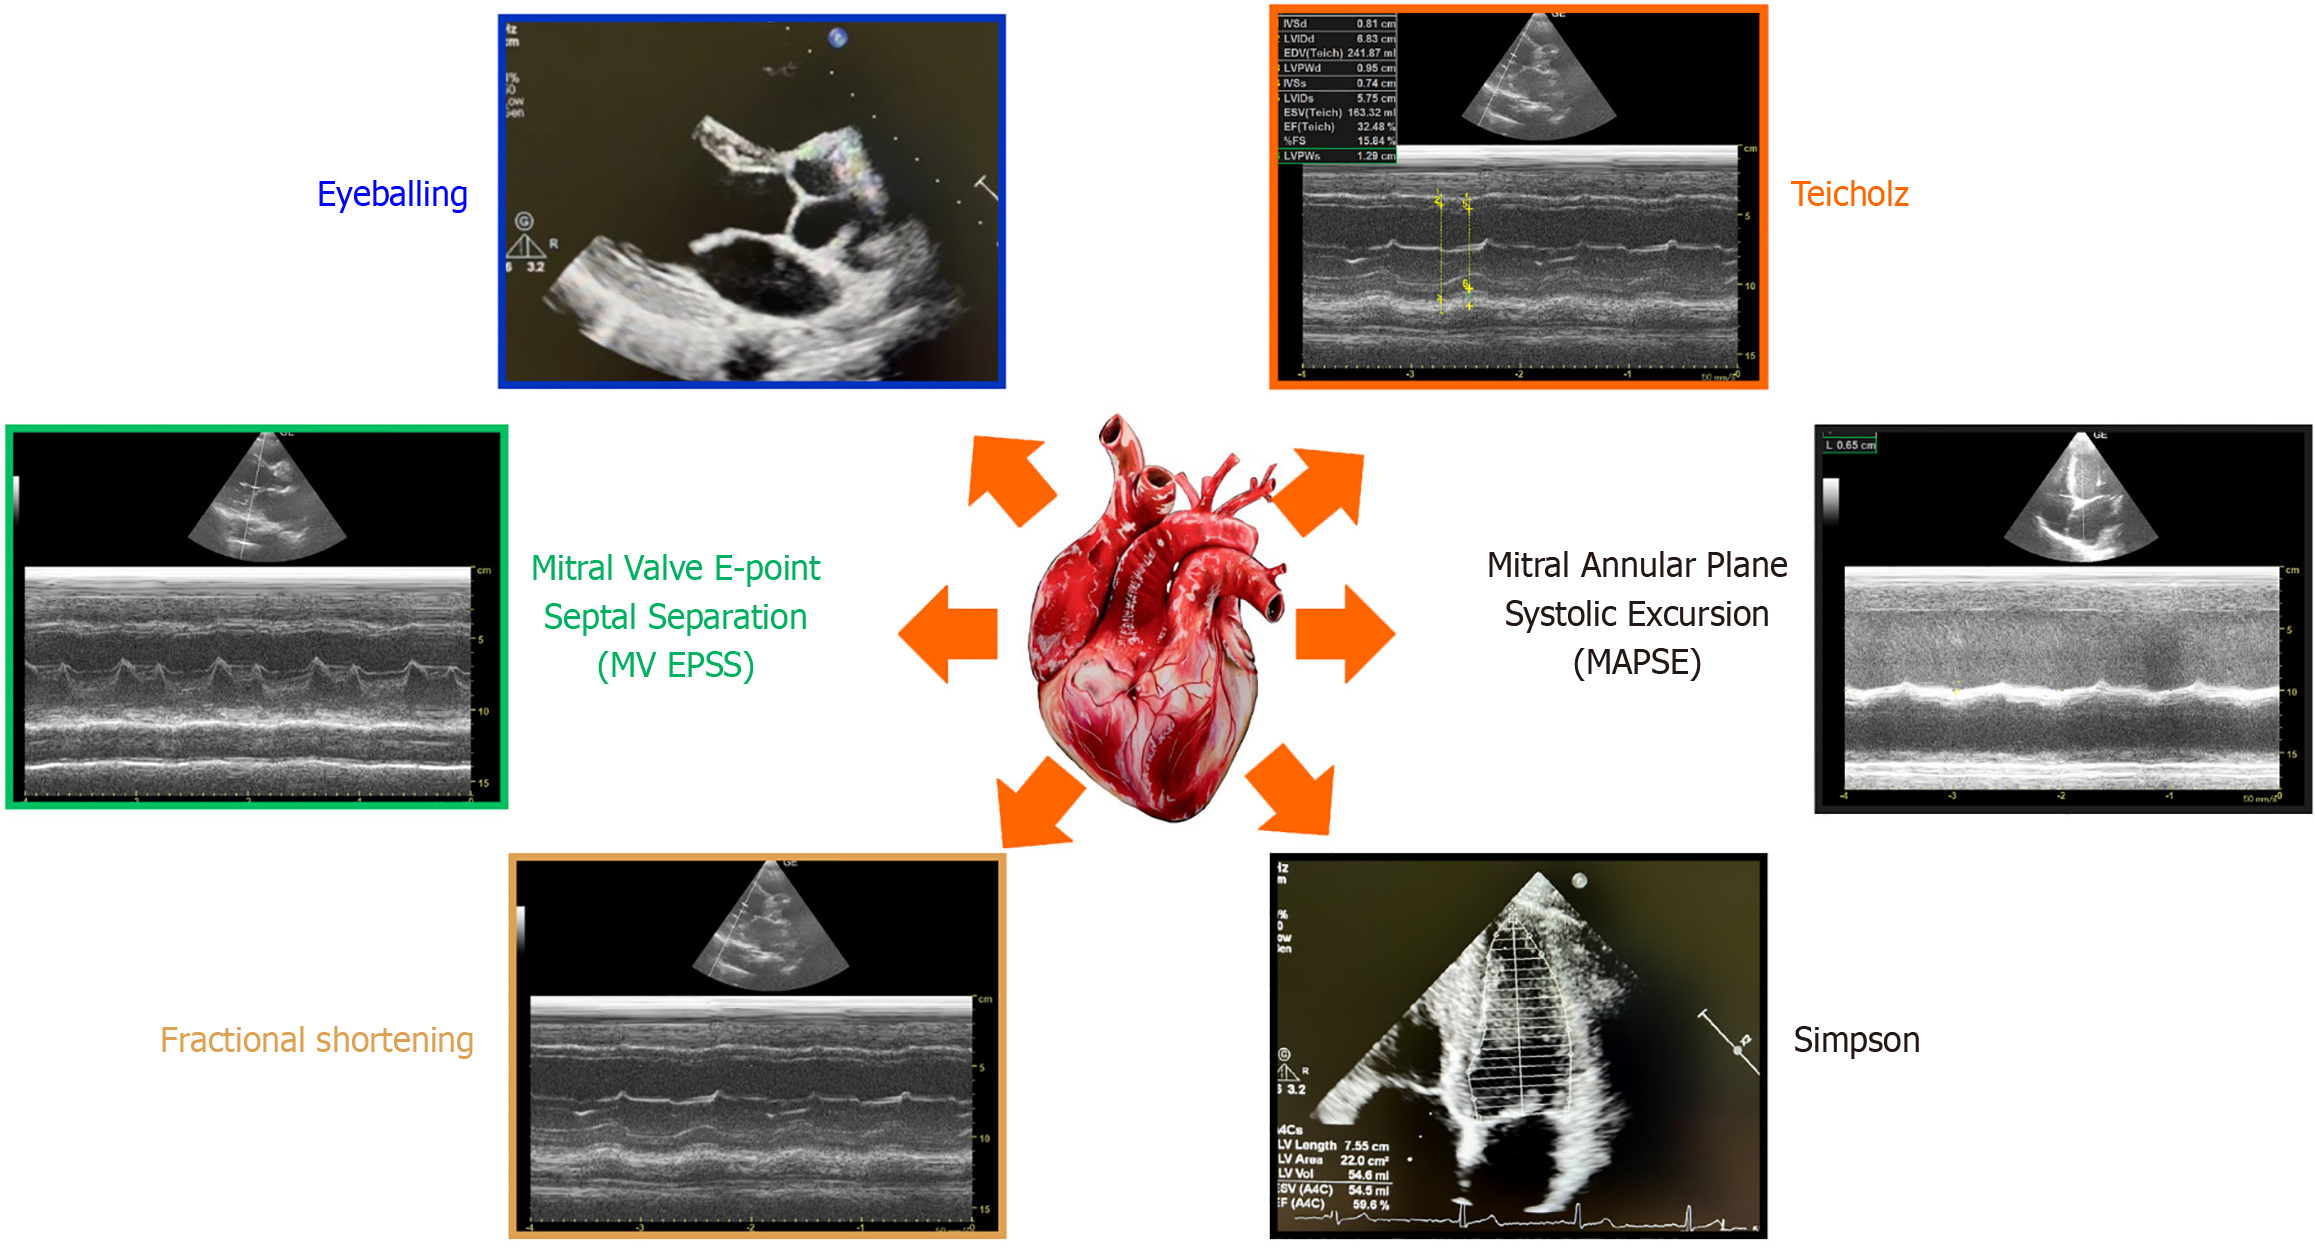
Figure 11
Different methods of left ventricular ejection fraction assessment.
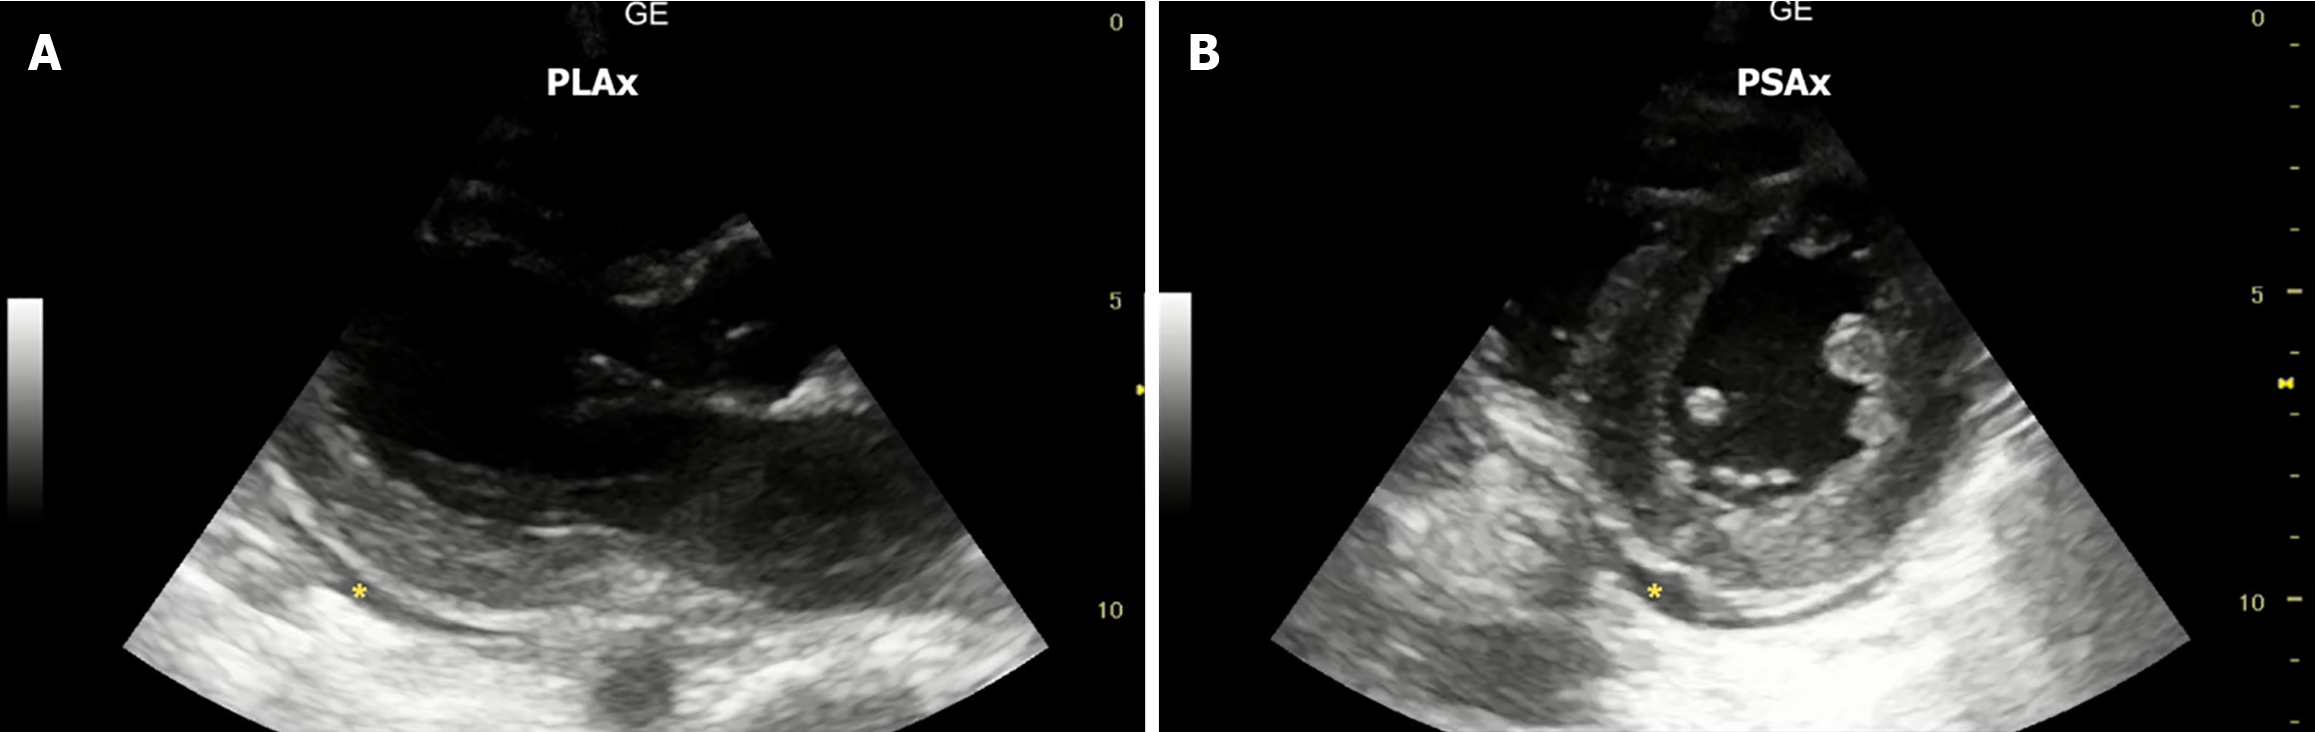
Figure 12 Pericardial effusion (yellow asterisks) due to plasma leakage.
A: Parasternal long axis view; B: Parasternal short axis view. PLAx: Parasternal long axis; PSAx: Parasternal short axis.
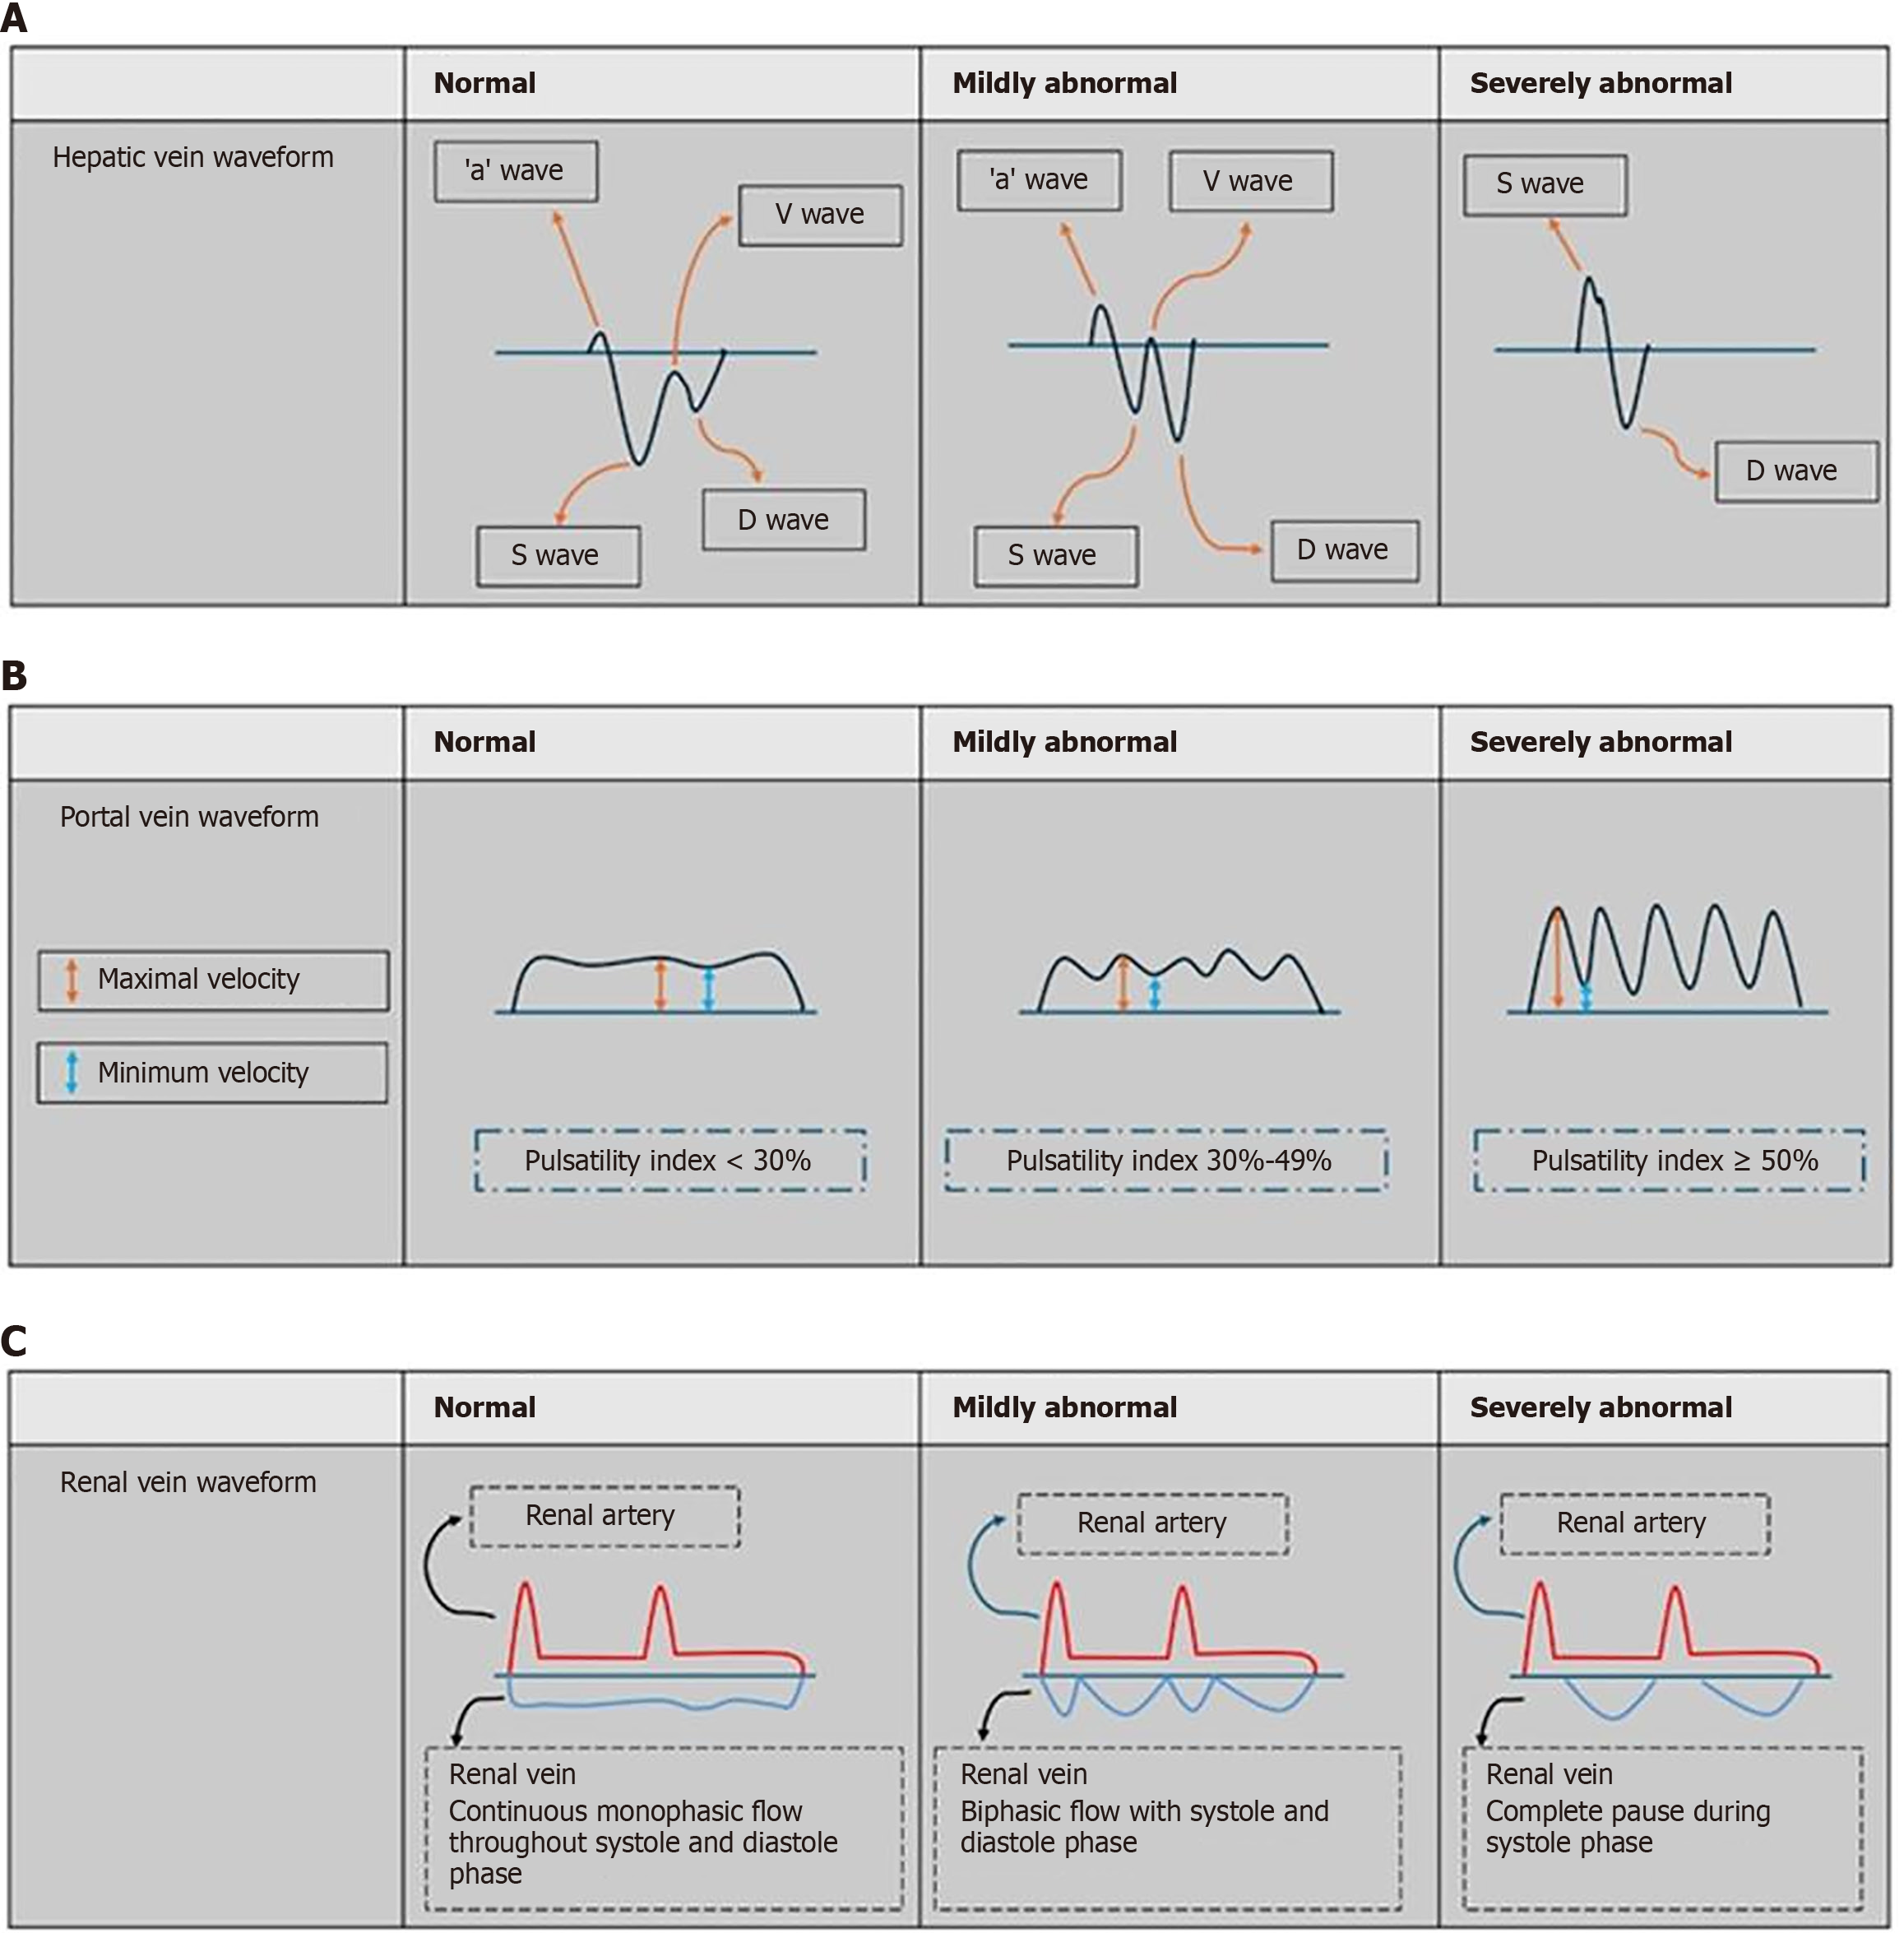
Figure 13 Venous excess ultrasound (VExUS) scoring - non-invasive measurements to evaluate and score the severity of venous congestion.
It involves assessing the inferior vena cava, hepatic vein, portal vein and renal vein waveforms. A: Hepatic vein waveforms; B: Portal vein waveforms; C: Renal vein waveforms. Adapted from: Chin WV, Ngai MMI, See KC. Venous excess ultrasound: A mini-review and practical guide for its application in critically ill patients. World J Crit Care Med 2025; 14: 101708
- Citation: Lee ZY, Chin WV. Integrating structured point-of-care ultrasound into dengue fever management: A mini review and comprehensive clinical guide. World J Crit Care Med 2026; 15(2): 114264
- URL: https://www.wjgnet.com/2220-3141/full/v15/i2/114264.htm
- DOI: https://dx.doi.org/10.5492/wjccm.v15.i2.114264