Copyright
©The Author(s) 2025.
World J Crit Care Med. Sep 9, 2025; 14(3): 101864
Published online Sep 9, 2025. doi: 10.5492/wjccm.v14.i3.101864
Published online Sep 9, 2025. doi: 10.5492/wjccm.v14.i3.101864
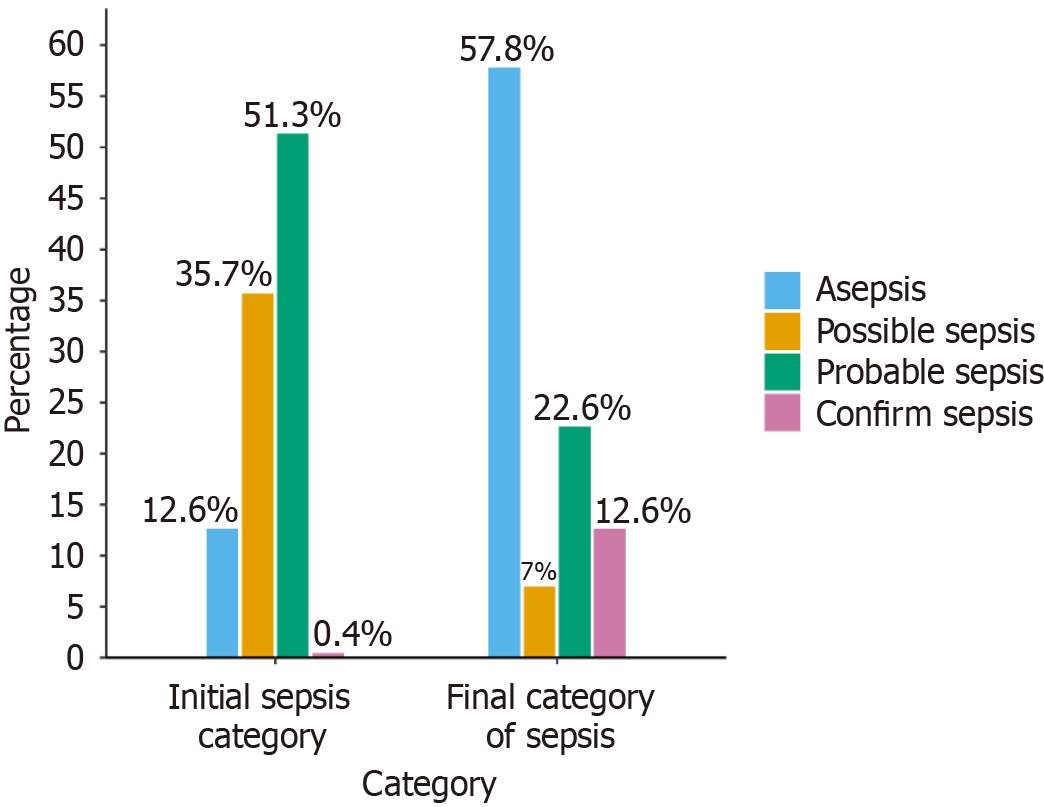
Figure 1
Graph showing the percentage of patients in the initial and final sepsis category during hospitalization.
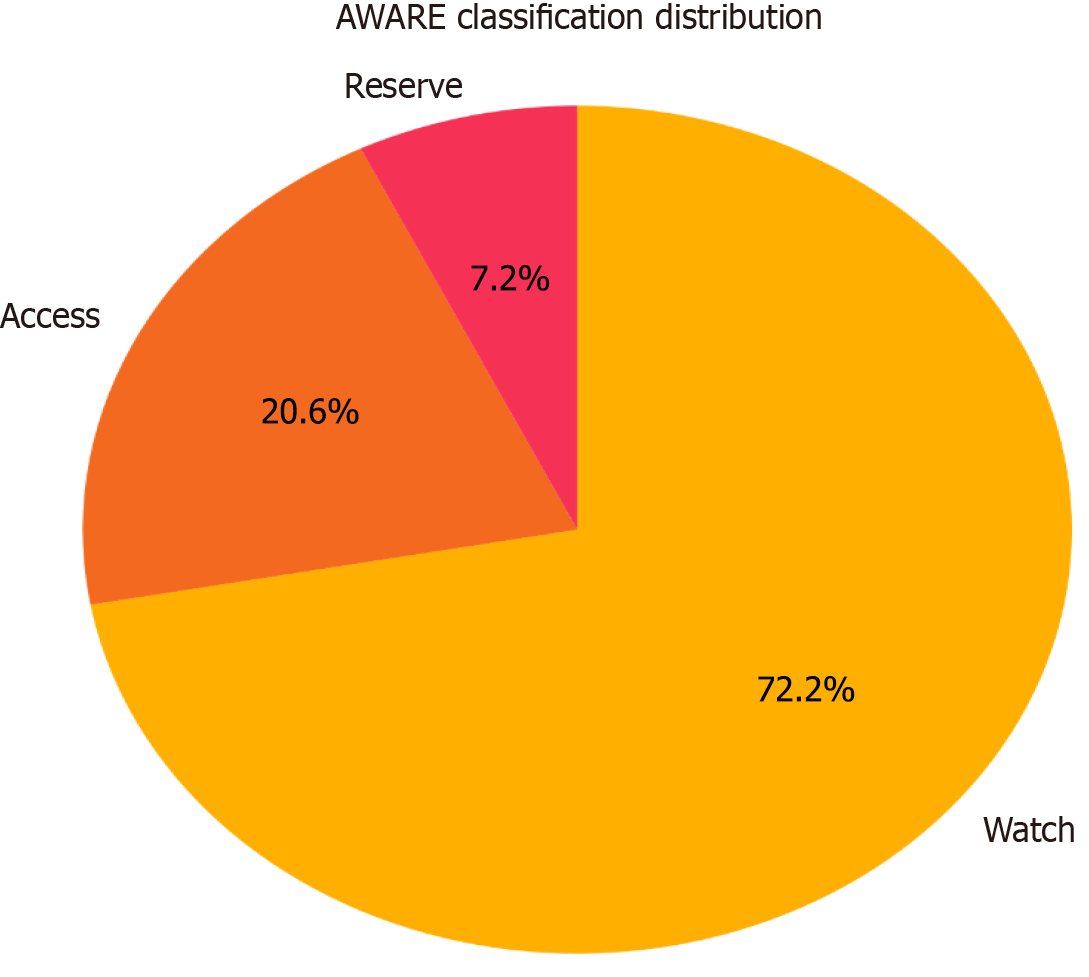
Figure 2
Pie chart showing the distribution of antibiotics as per the AWaRe classification.
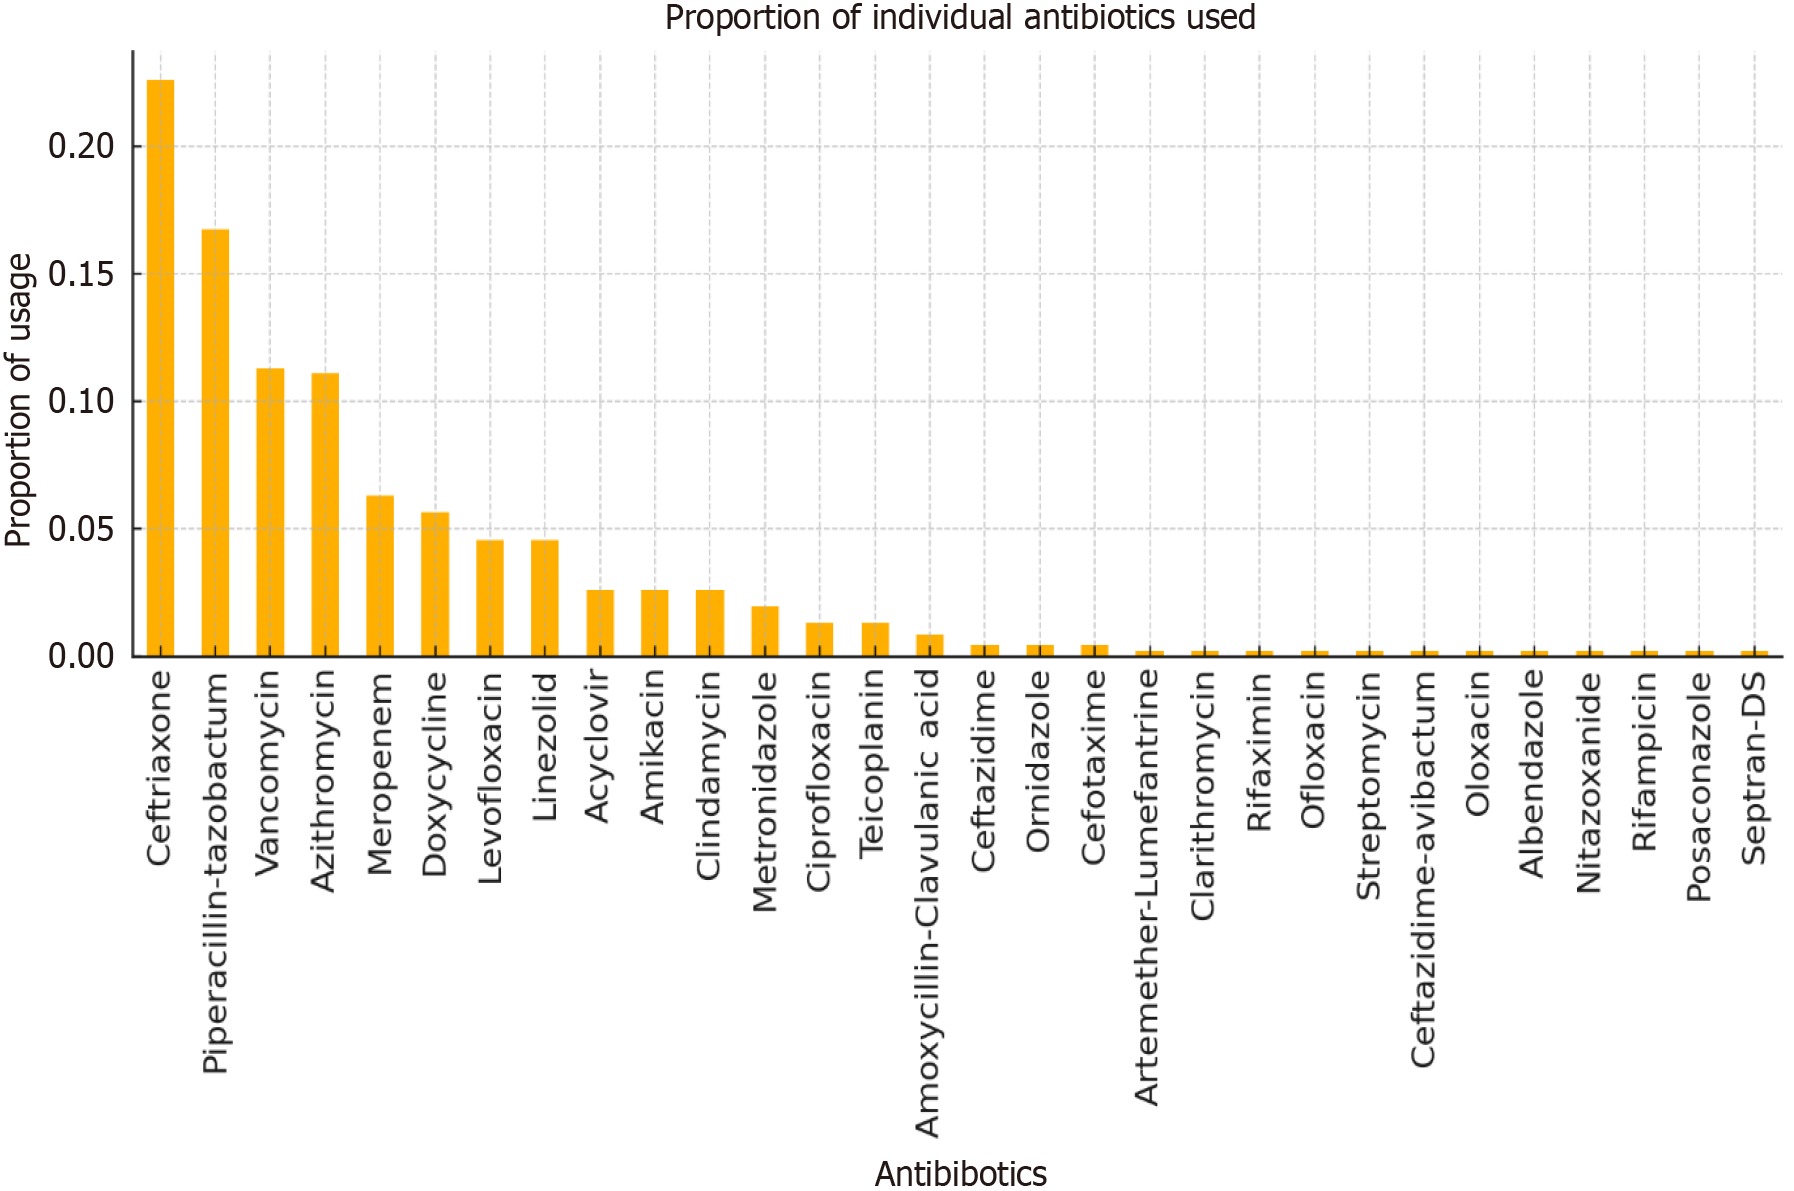
Figure 3
Graph showing the proportion of various antibiotics used.
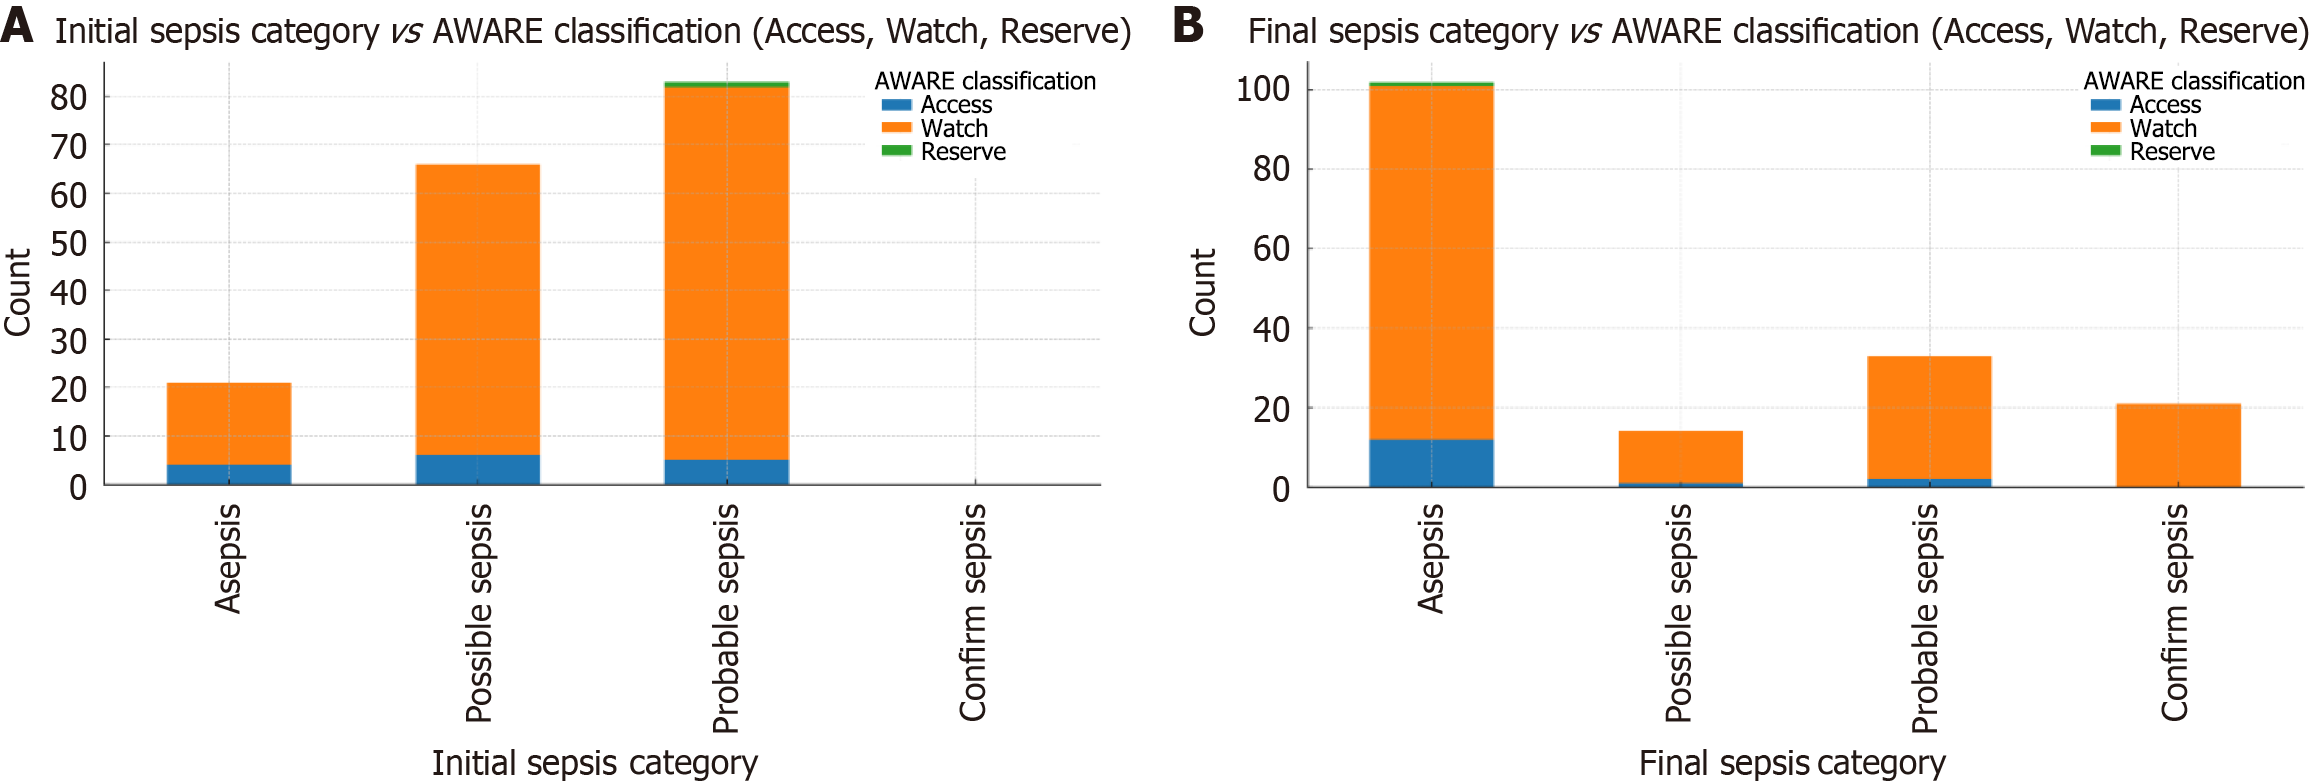
Figure 4 Graphs showing usage of AWaRe antibiotics in different sepsis categories.
A: During initial time period; B: During final hospitalization time period.
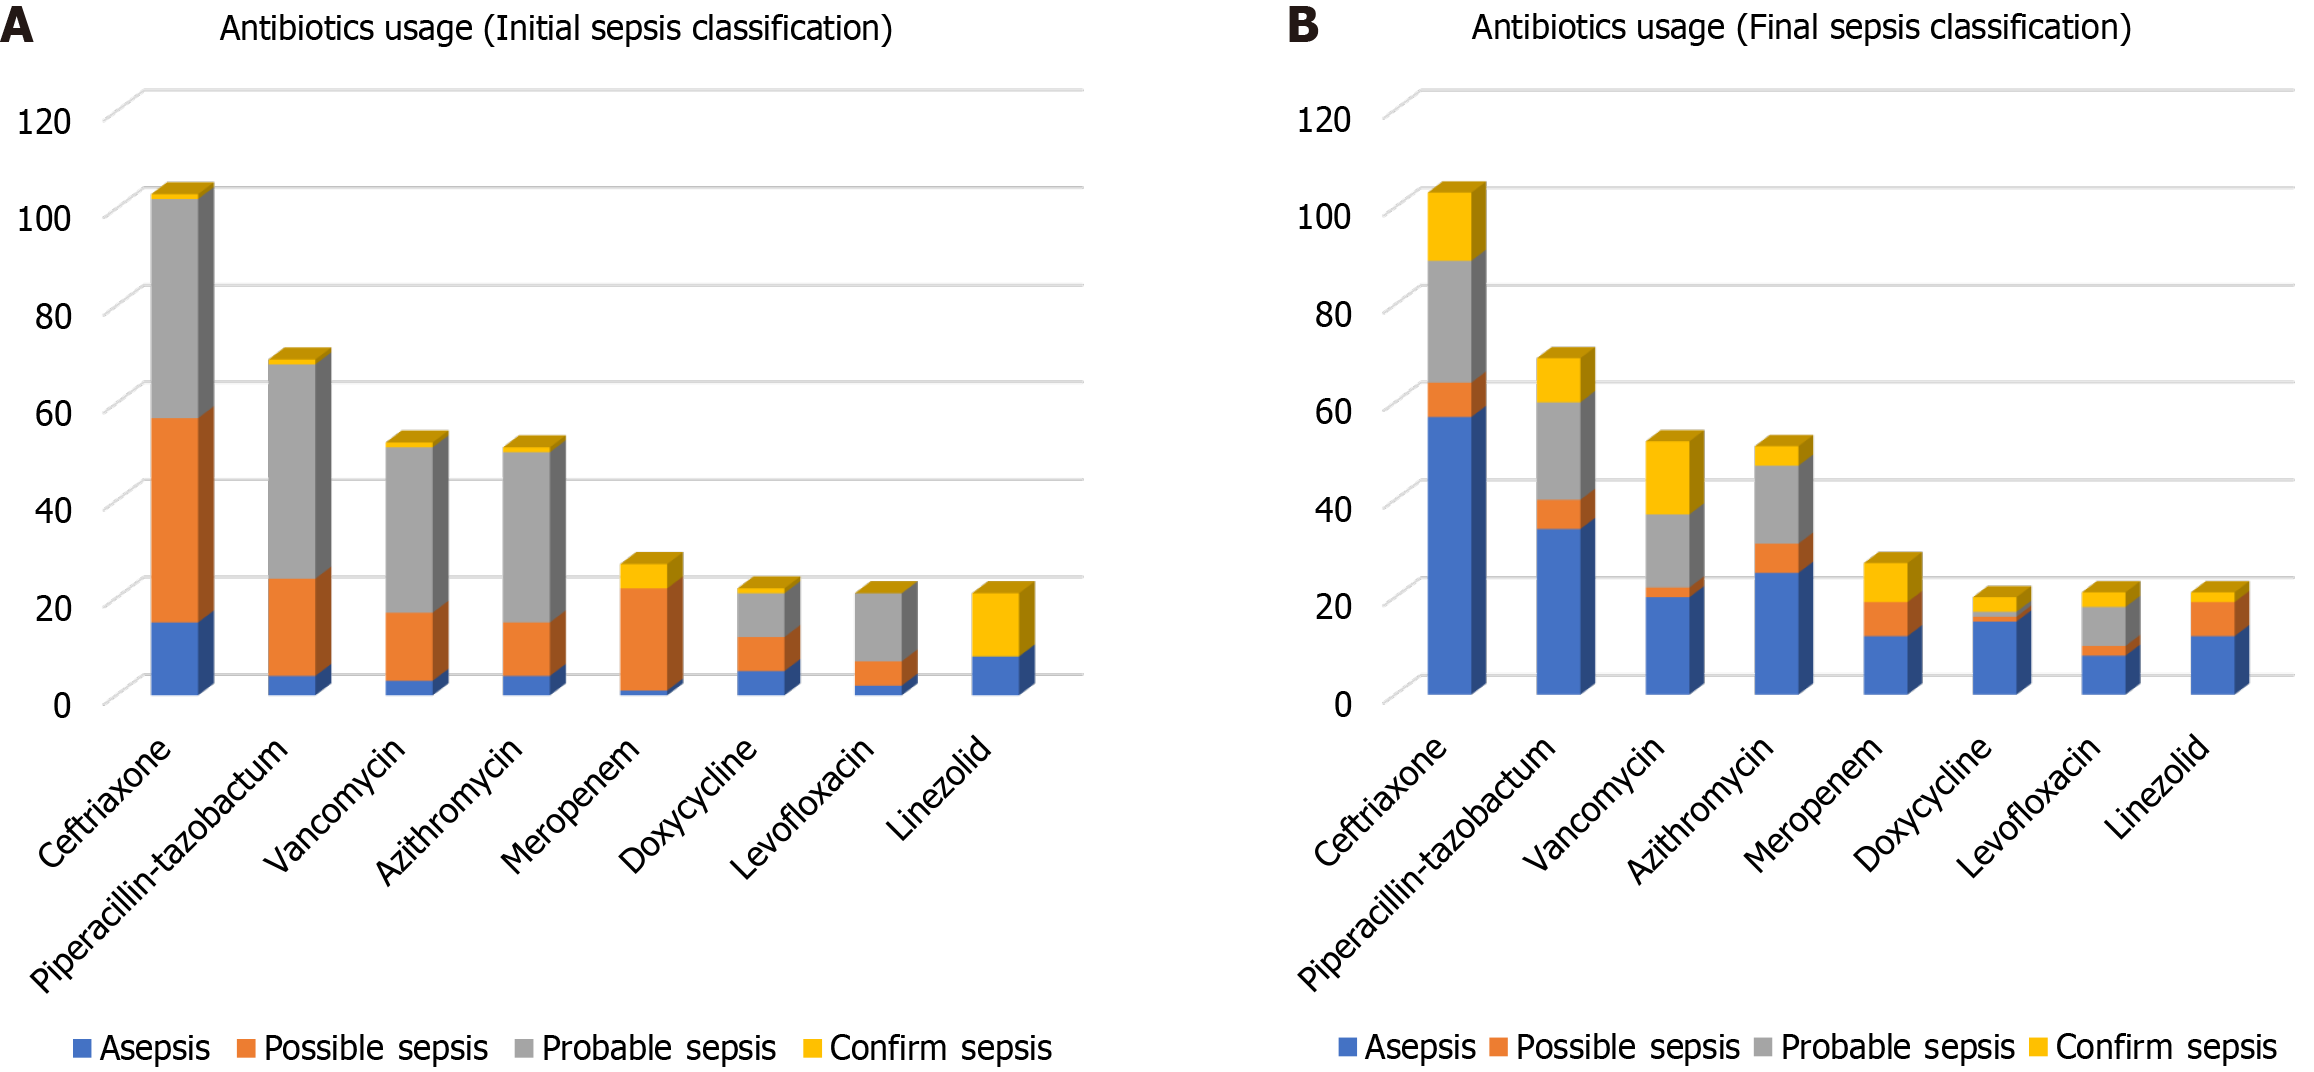
Figure 5 Graphs showing common antibiotics used in different sepsis categories.
A: During initial time period; B: During final hospitalization time period.
- Citation: Pilania J, Panda PK, Chauhan U, Kant R. Correct sepsis classification–A must for antimicrobial stewardship: A longitudinal observational study. World J Crit Care Med 2025; 14(3): 101864
- URL: https://www.wjgnet.com/2220-3141/full/v14/i3/101864.htm
- DOI: https://dx.doi.org/10.5492/wjccm.v14.i3.101864


