Copyright
©The Author(s) 2024.
World J Crit Care Med. Sep 9, 2024; 13(3): 92531
Published online Sep 9, 2024. doi: 10.5492/wjccm.v13.i3.92531
Published online Sep 9, 2024. doi: 10.5492/wjccm.v13.i3.92531
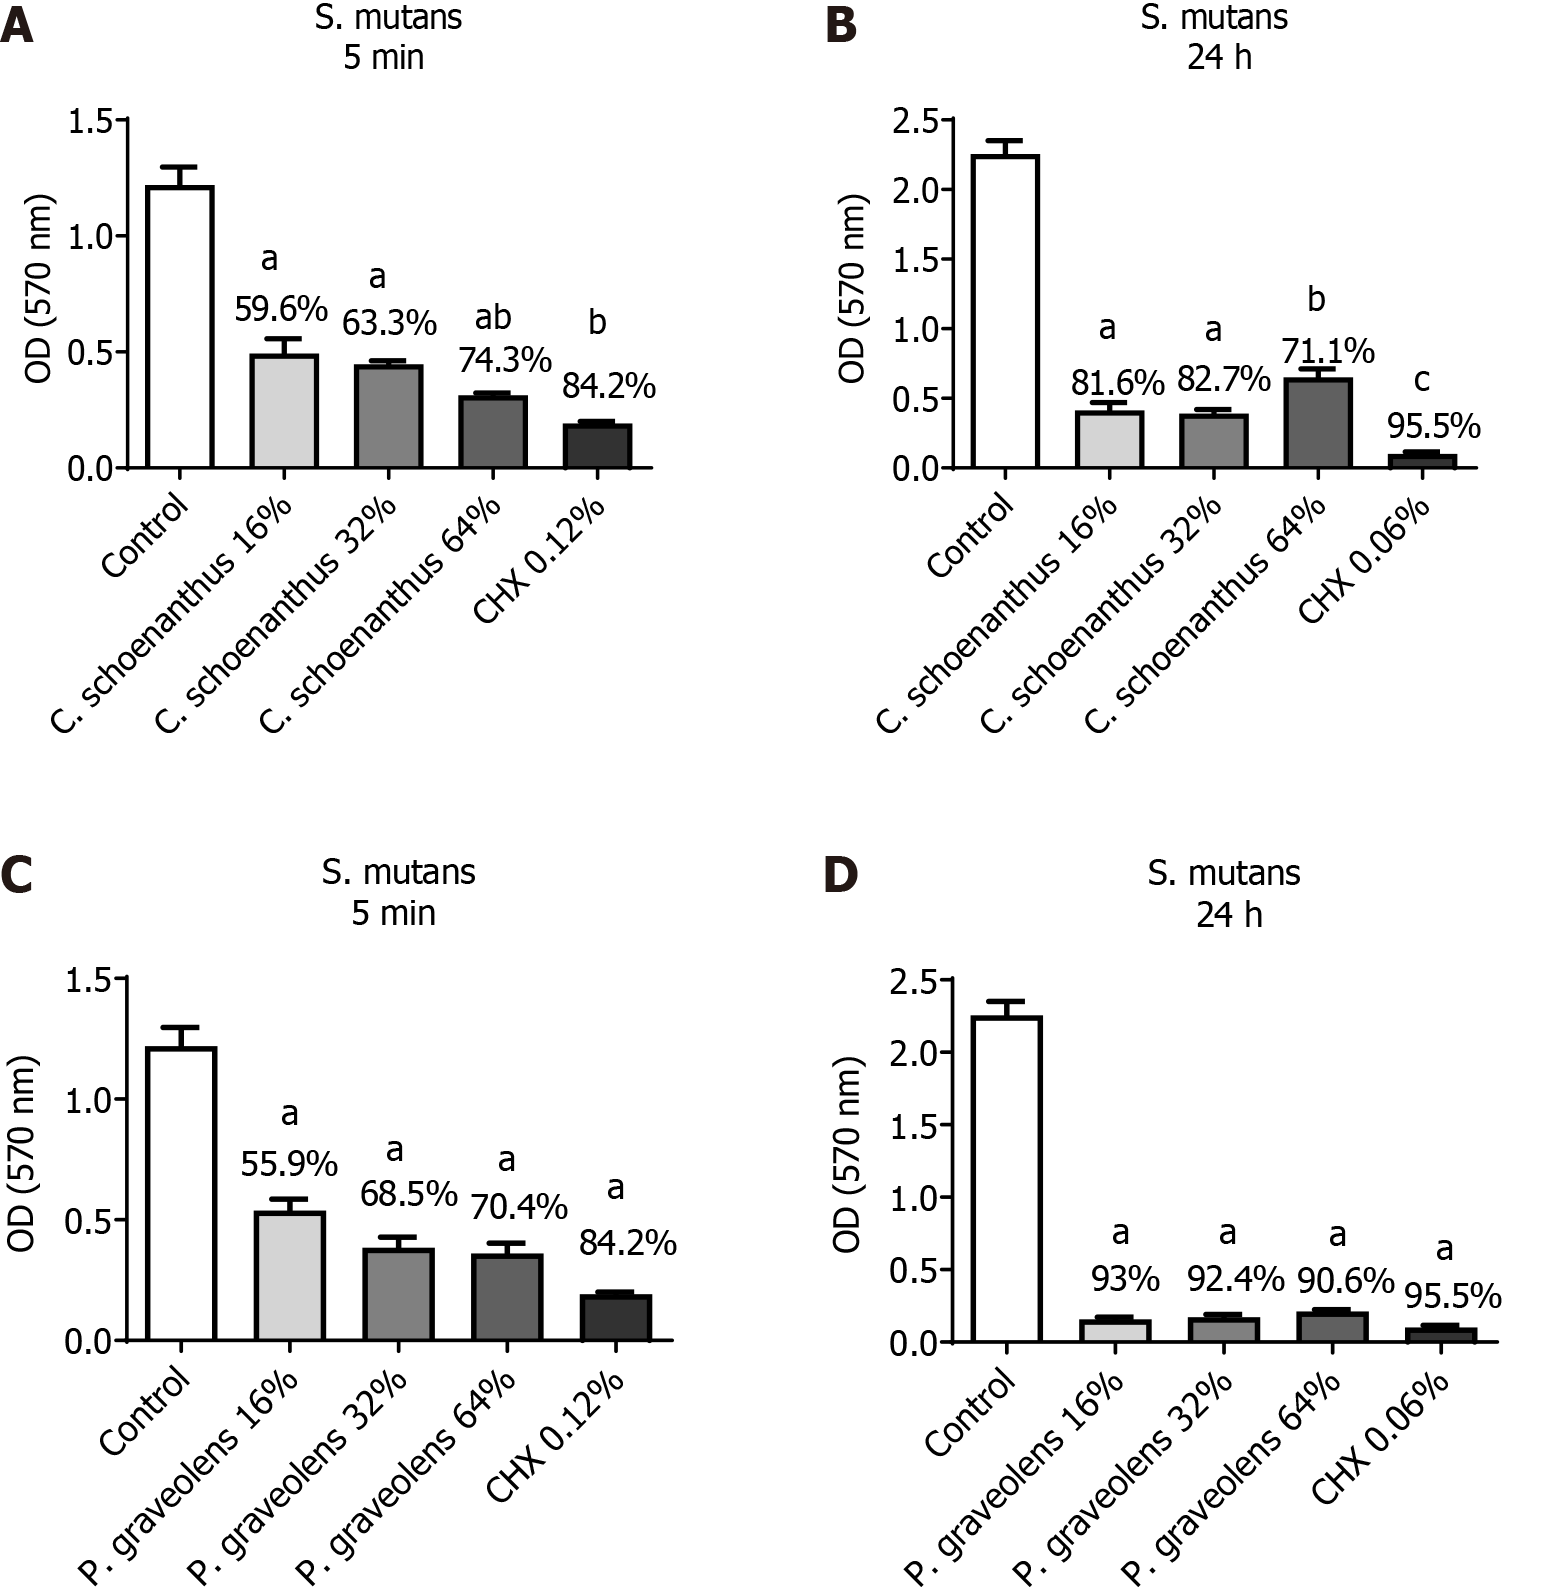
Figure 1 Reduction of Streptococcus mutans monotipic biofilm (in %) calculated using the MTT test after treatment with experimental groups.
Data are presented as the mean ± standard deviation. Statistical analysis was performed using one-way analysis of variance with Tukey’s post-hoc test (n = 10, α = 0.05). Statistical significance is indicated as follows: aP ≤ 0.0001 vs the control group, bP < 0.0025 vs Cymbopogon schoenanthus 32%, and cP < 0.0001 vs C. schoenanthus 64%. A: Streptococcus mutans biofilm treated for 5 min with C. schoenanthus at various concentrations; B: S. mutans biofilm treated for 24 h with C. schoenanthus at various concentrations; C: S. mutans biofilm treated for 5 min with Pelargonium graveolens at various concentrations; D: S. mutans biofilm treated for 24 h with P. graveolens at various concentrations.
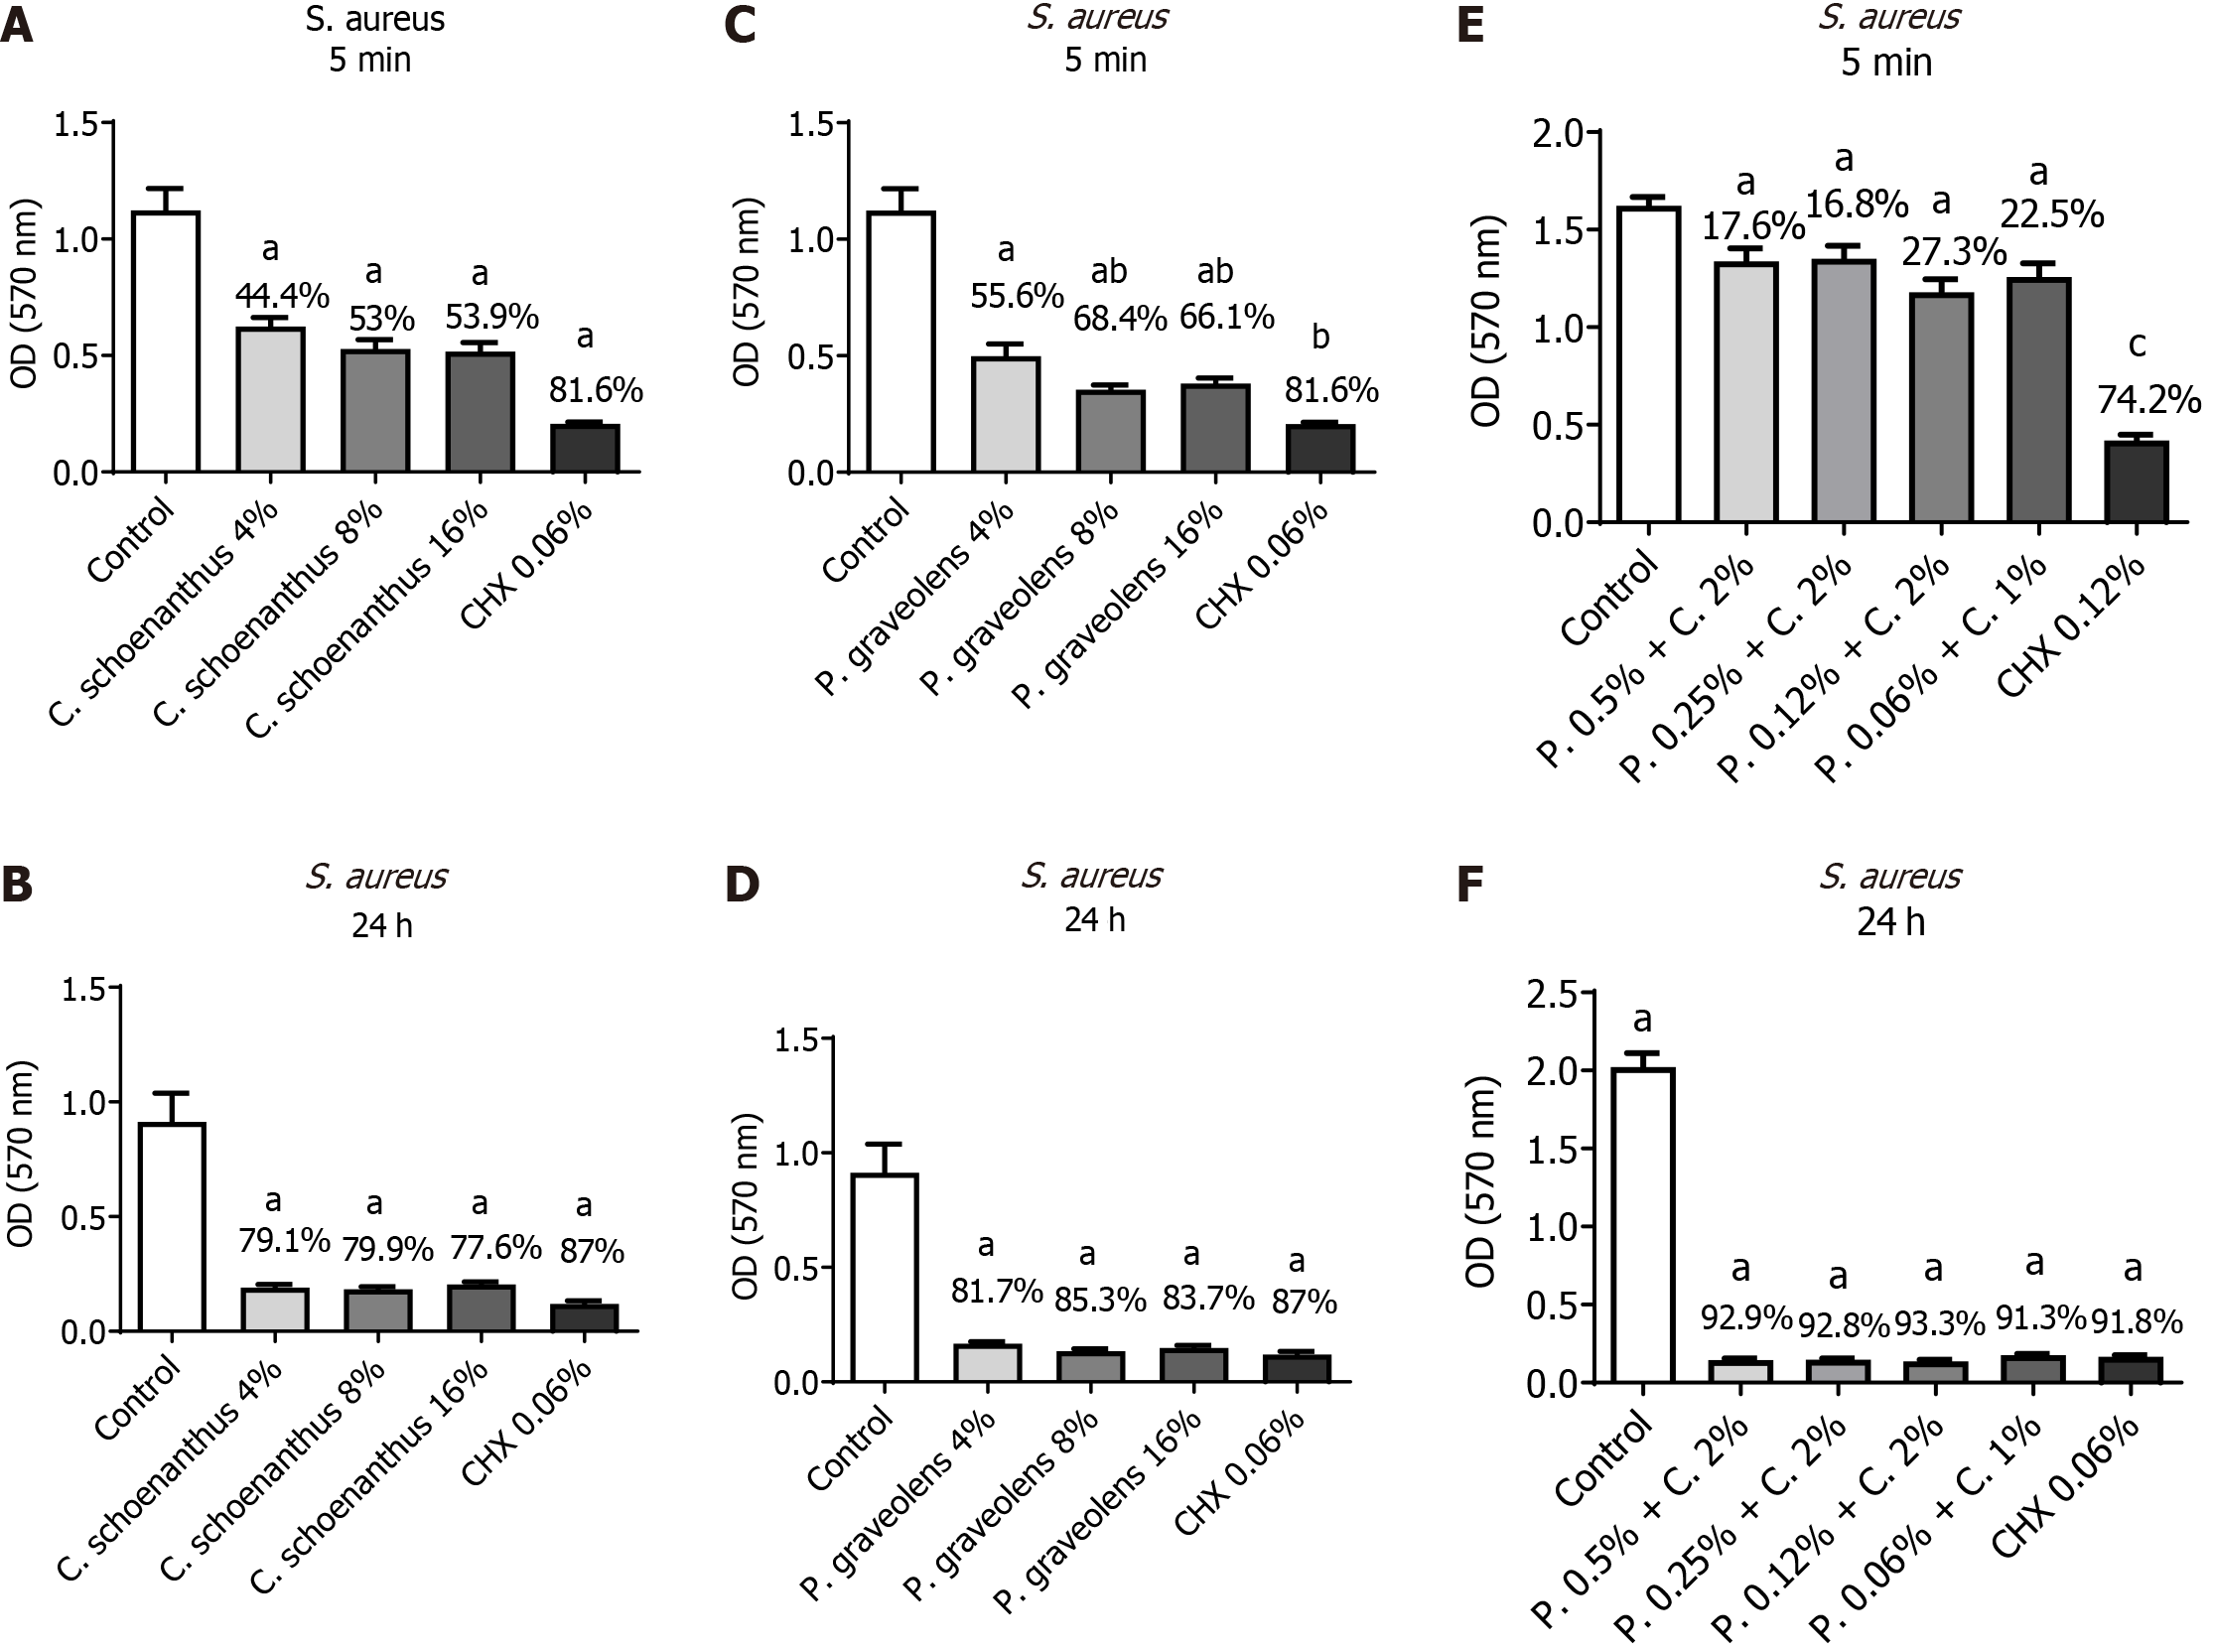
Figure 2 Reduction of Staphylococcus aureus monotipic biofilm (in %) calculated using the MTT test after treatment with experimental groups.
Data are presented as the mean ± standard deviation. Statistical analysis was performed using one-way analysis of variance with Tukey’s post-hoc test (n = 10, α = 0.05). Statistical significance is indicated as follows: aP ≤ 0.0001 vs the control group, bP < 0.0025 vs Pelargonium graveolens 4%, and cP < 0.0001 vs all synergistic groups. A: Staphylococcus aureus biofilm treated for 5 min with Cymbopogon schoenanthus at various concentrations; B: S. aureus biofilm treated for 24 h with C. schoenanthus at various concentrations; C: S. aureus biofilm treated for 5 min with P. graveolens at various concentrations; D: S. aureus biofilm treated for 24 h with P. graveolens at various concentrations; E: S. aureus biofilm treated for 5 min with C. schoenanthus (C) and P. graveolens (P), combined, at various concentrations; F: S. aureus biofilm treated for 24 h with C. schoenanthus (C) and P. graveolens (P) combined, at various concentrations.
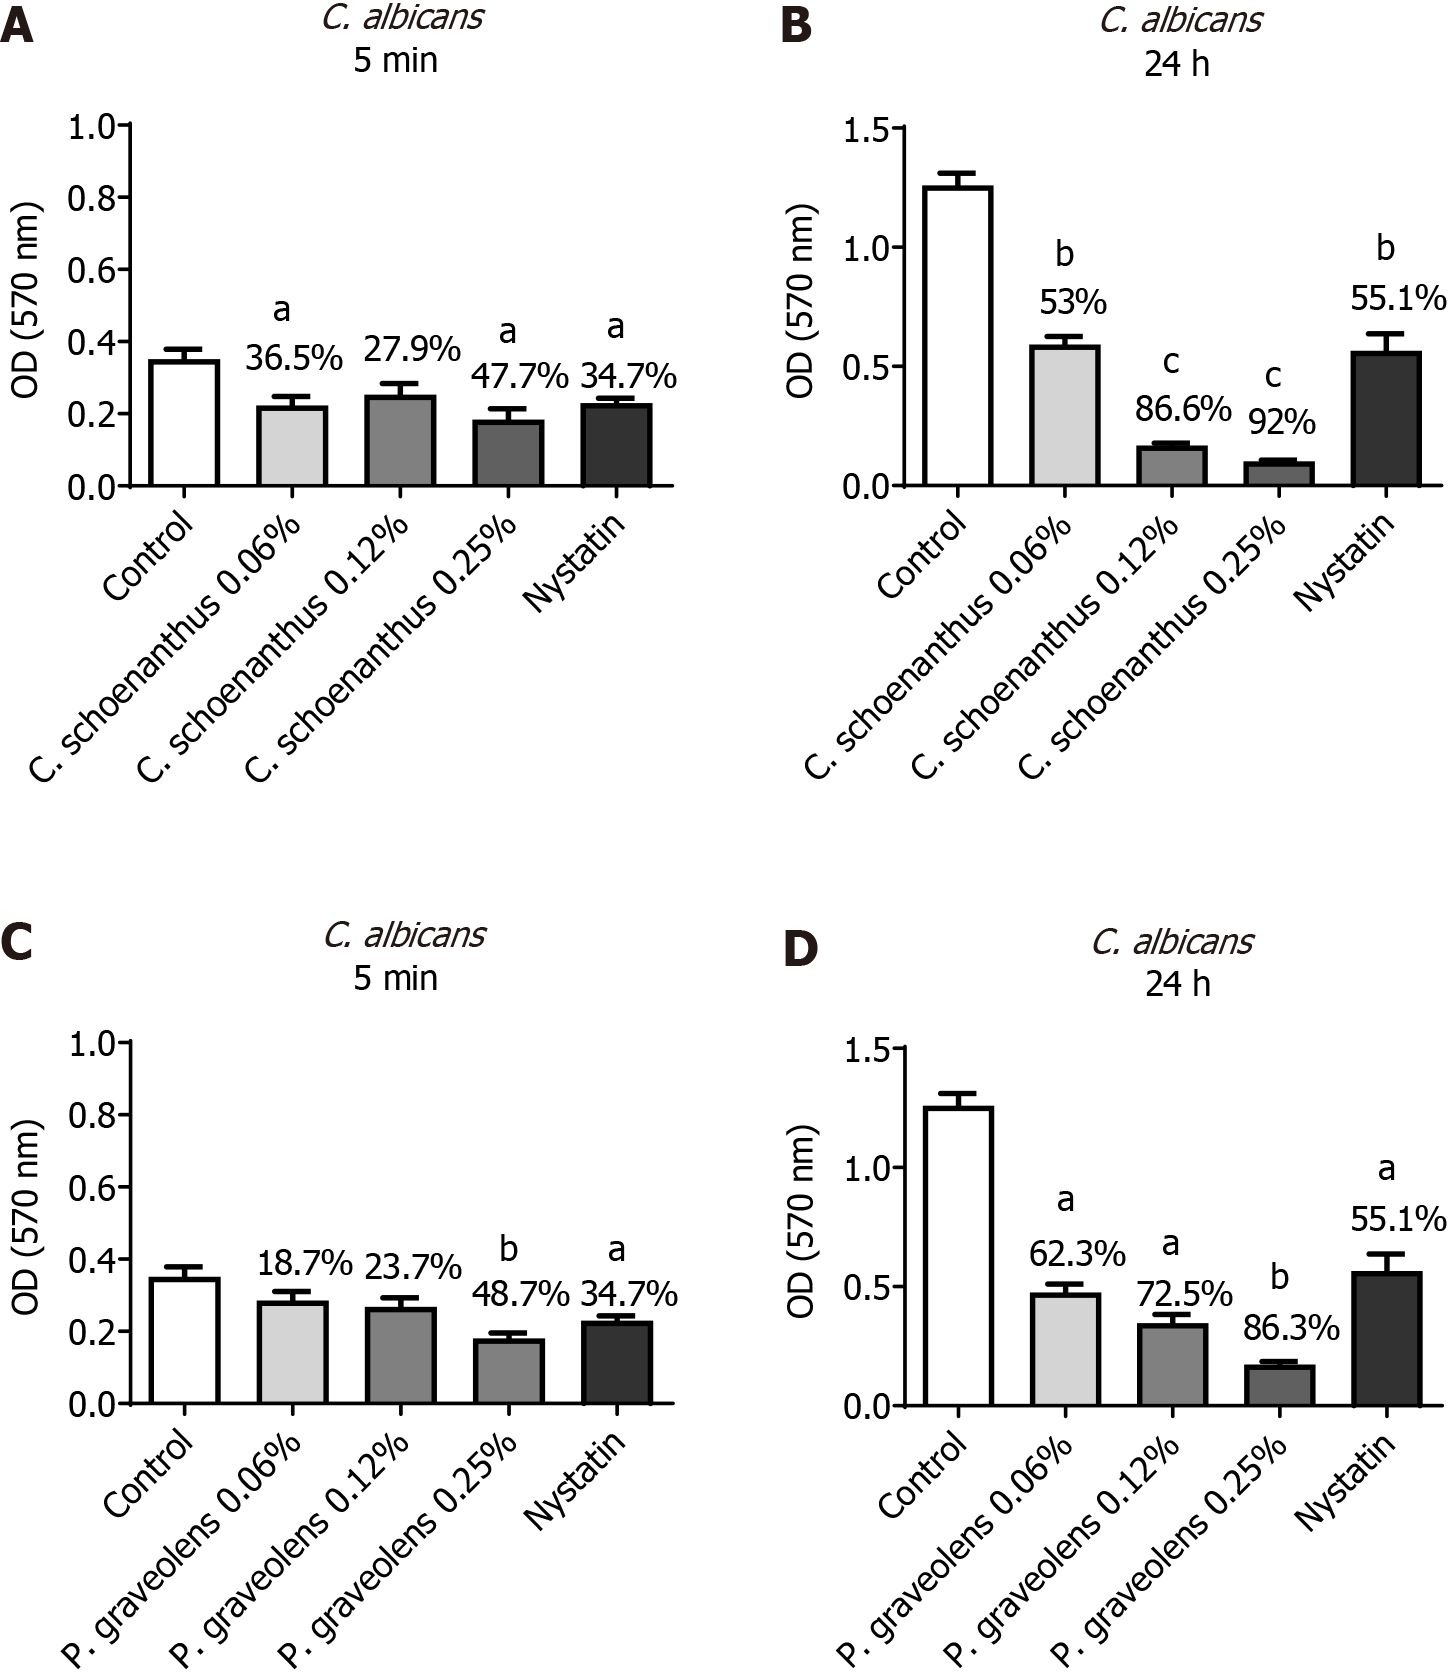
Figure 3 Reduction of Candida albicans monotipic biofilm (in %) calculated using the MTT test after treatment with experimental groups.
Data are presented as the mean ± standard deviation. Statistical analysis was performed using one-way analysis of variance with Tukey’s post-hoc test (n = 10, α = 0.05). Statistical significance is indicated as follows: aP ≤ 0.0004 vs the control group, bP ≤ 0.0001 vs the control group and cP ≤ 0.0001 vs nystatin. A: Candida albicans biofilm treated for 5 min with Cymbopogon schoenanthus at various concentrations; B: C. albicans biofilm treated for 24 h with Cy. schoenanthus at various concentrations; C: C. albicans biofilm treated for 5 min with Pelargonium graveolens at various concentrations; D: C. albicans biofilm treated for 24 h with P. graveolens at various concentrations.
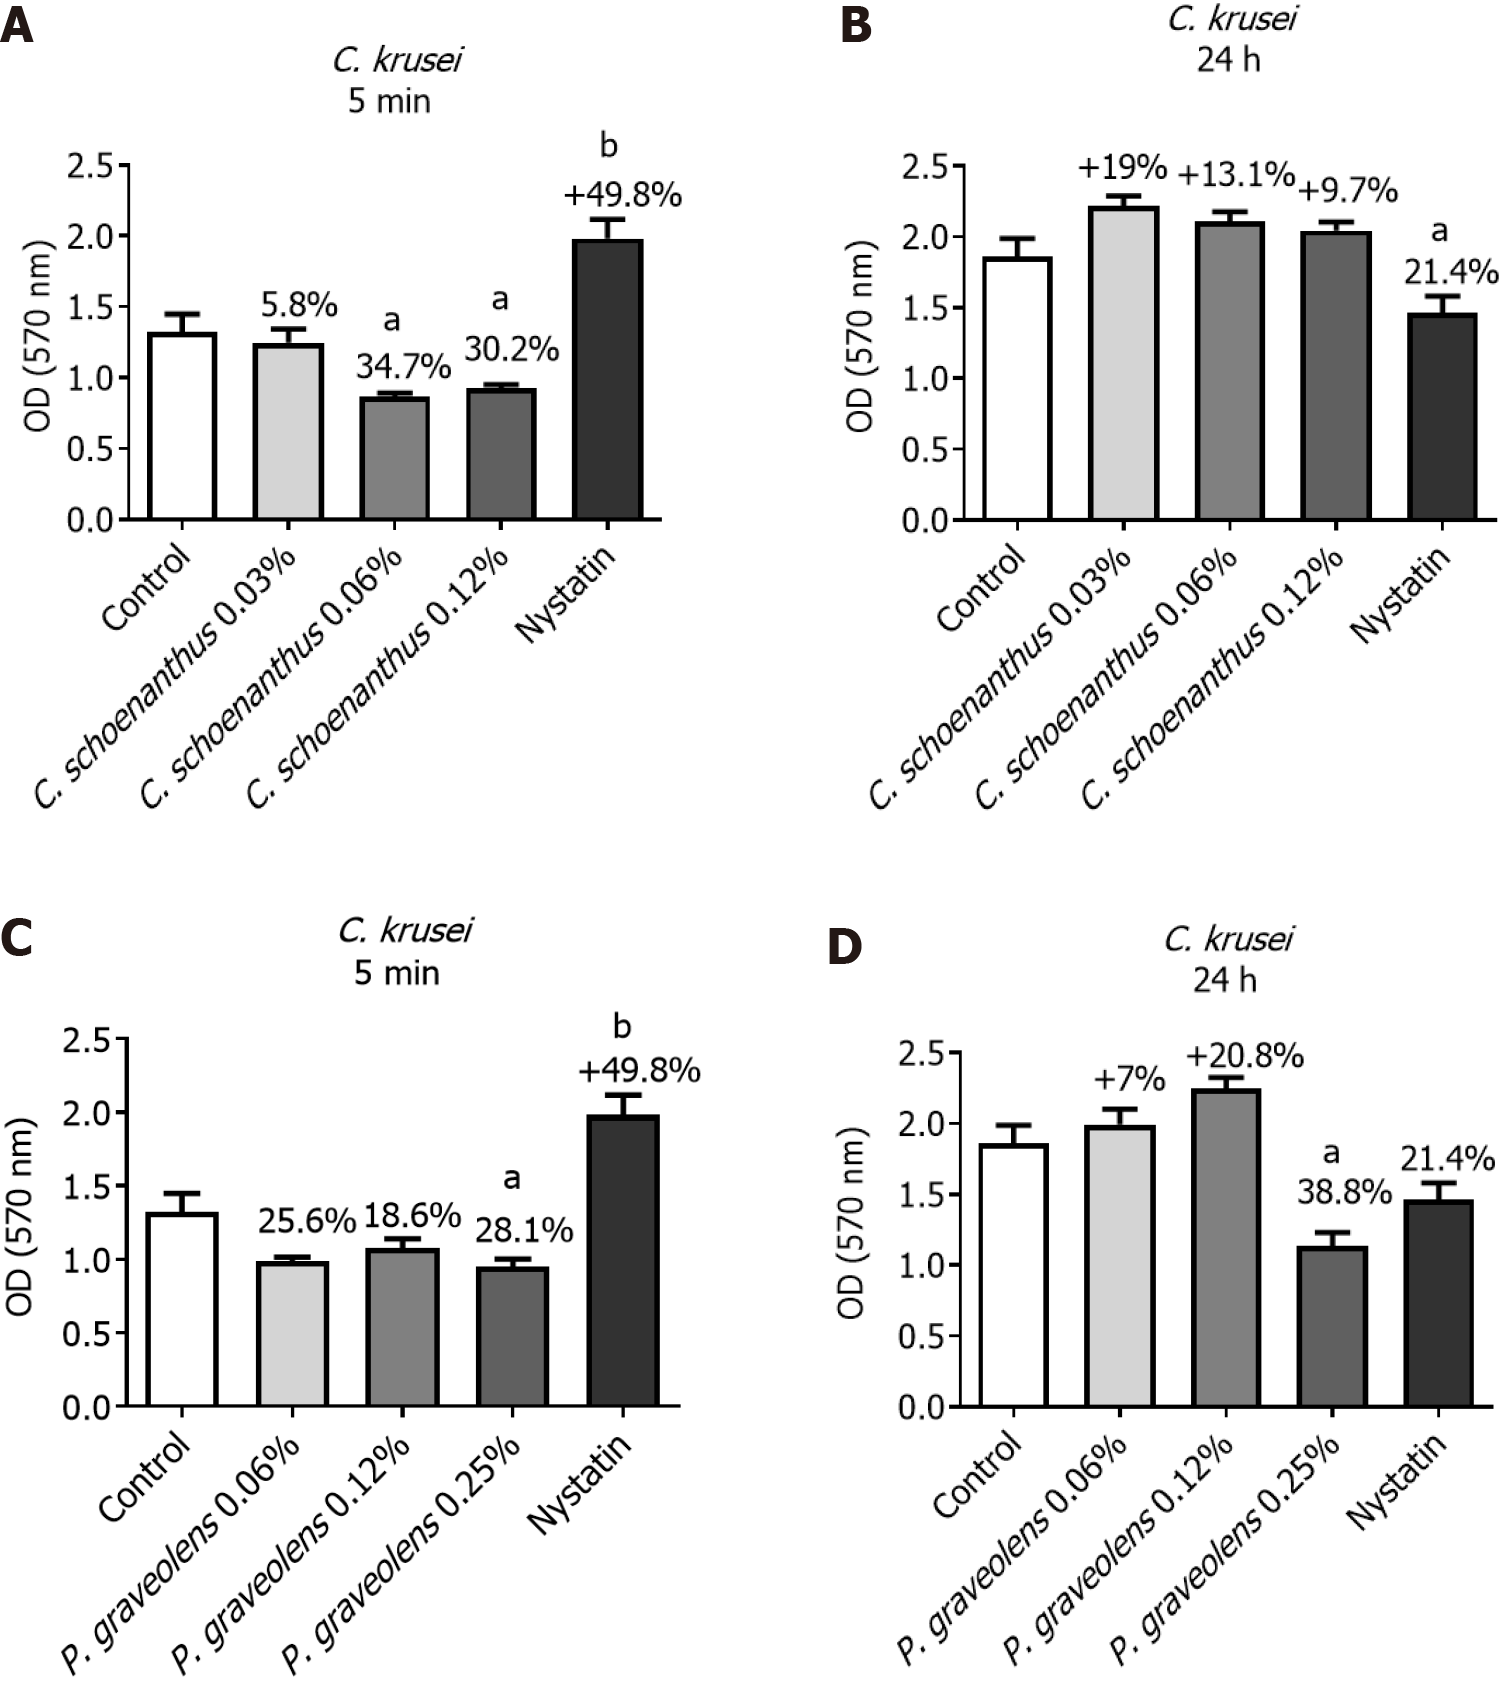
Figure 4 Reduction of Candida krusei monotipic biofilm (in %) calculated using the MTT test after treatment with experimental groups.
Data are presented as the mean ± standard deviation. Statistical analysis was performed using one-way analysis of variance with Tukey’s post-hoc test (n = 10, α = 0.05). Statistical significance is indicated as follows: aP ≤ 0.04 vs the control group and bP ≤ 0.0001 vs the control group. A: Candida krusei biofilm treated for 5 min with Cymbopogon schoenanthus at various concentrations; B: C. krusei biofilm treated for 24 h with Cy. schoenanthus at various concentrations; C: C. krusei biofilm treated for 5 min with Pelargonium graveolens at various concentrations; D: C. krusei biofilm treated for 24 h with P. graveolens at various concentrations.
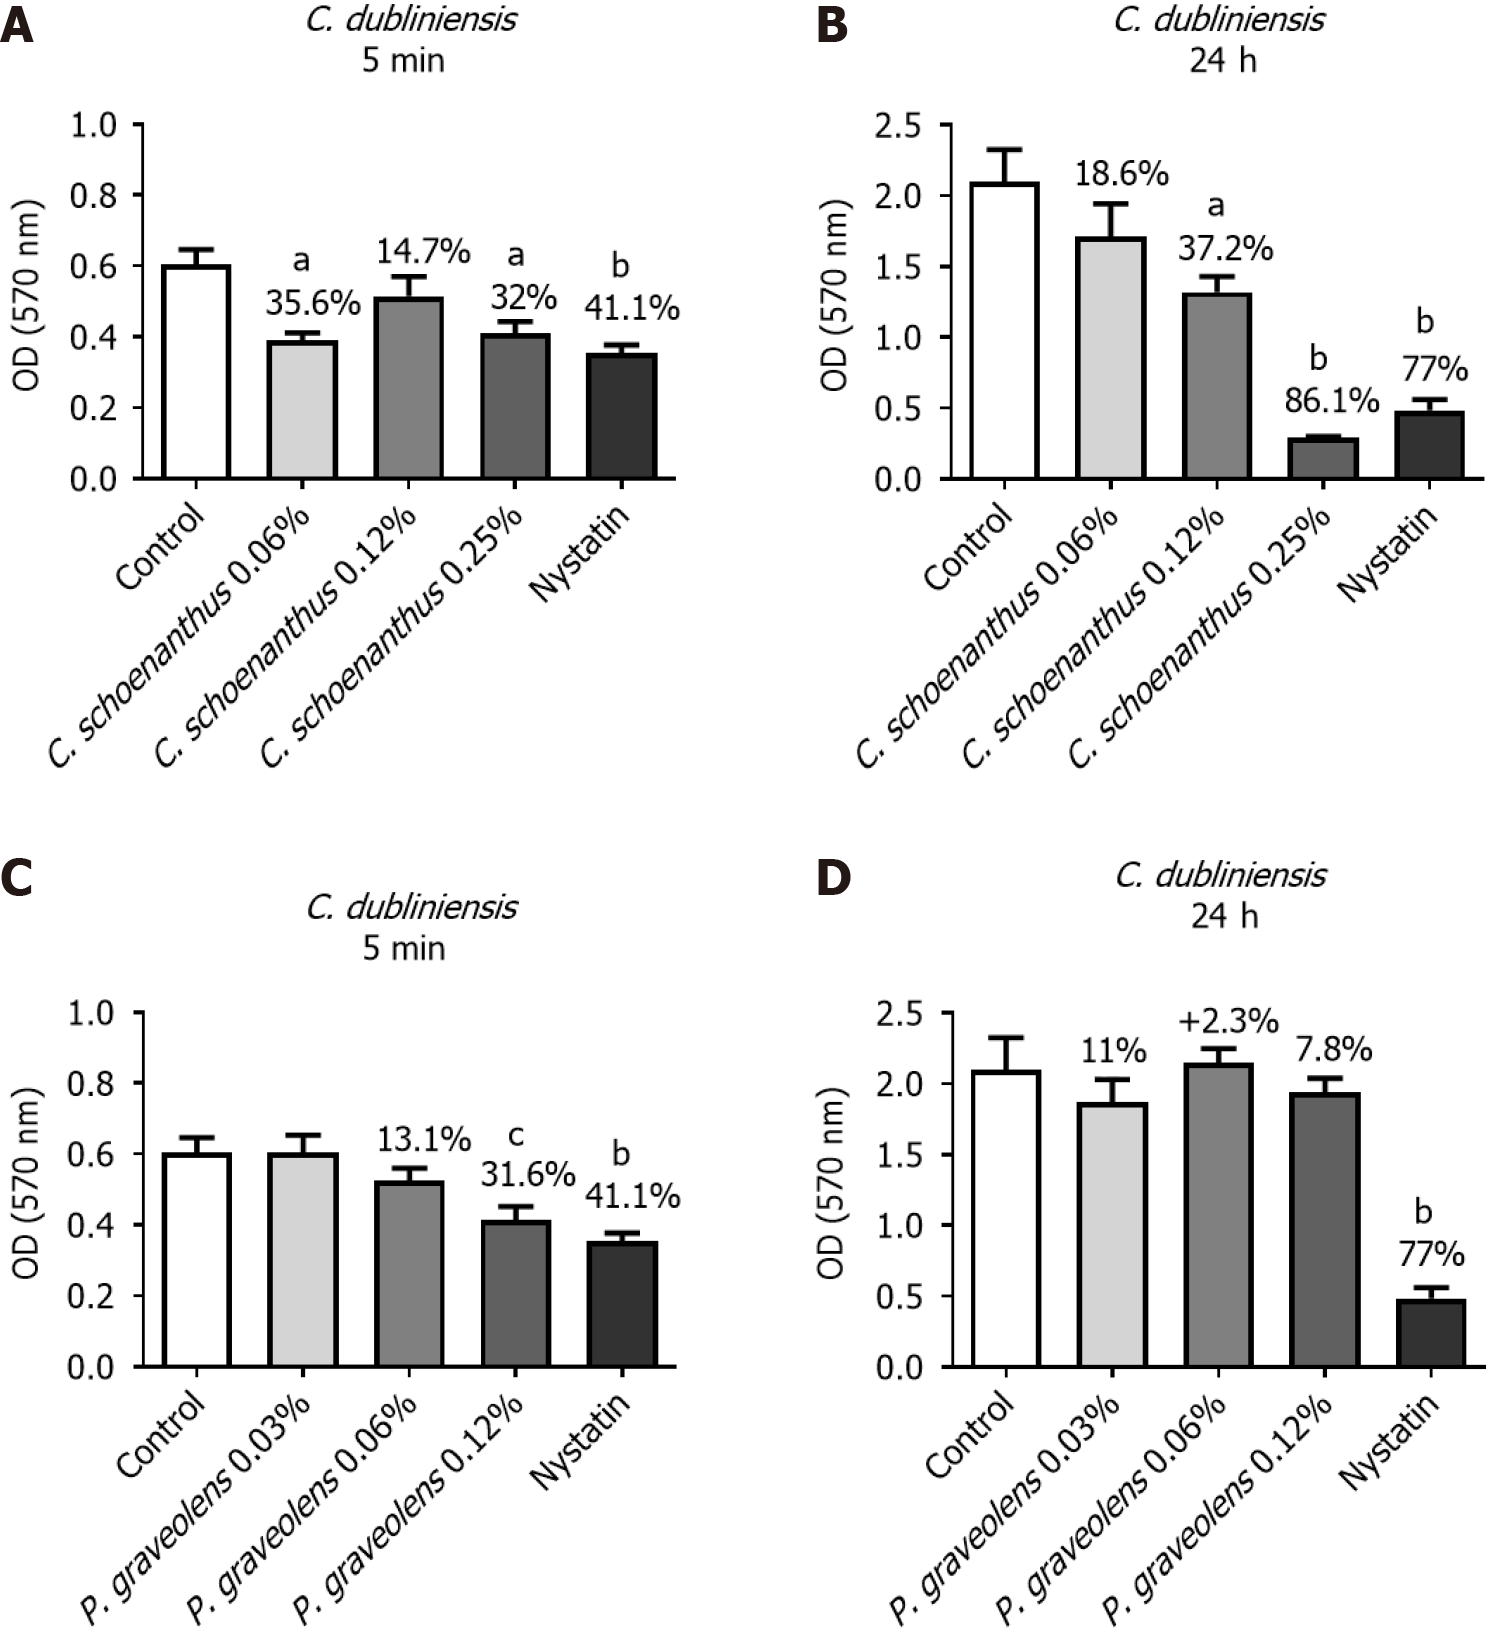
Figure 5 Reduction of Candida dubliniensis monotipic biofilm (in %) calculated using the MTT test after treatment with experimental groups.
Data are presented as the mean ± standard deviation. Statistical analysis was performed using one-way analysis of variance with Tukey’s post-hoc test (n = 10, α = 0.05). Statistical significance is indicated as follows: aP ≤ 0.007 vs the control group, bP ≤ 0.0005 vs the control group, and cP ≤ 0.01 vs the control group. A: Candida dubliniensis biofilm treated for 5 min with Cymbopogon schoenanthus at various concentrations; B: C. dubliniensis biofilm treated for 24 h with Cy. schoenanthus at various concentrations; C: C. dubliniensis biofilm treated for 5 min with Pelargonium graveolens at various concentrations; D: C. dubliniensis biofilm treated for 24 h with P. graveolens at various concentrations.
- Citation: de Lima PMN, Pereira TC, de Carvalho LS, dos Santos LF, Oliveira CER, Ramos LP, Marcucci MC, Abu Hasna A, de Oliveira LD. Antimicrobial and synergistic effects of lemongrass and geranium essential oils against Streptococcus mutans, Staphylococcus aureus, and Candida spp.. World J Crit Care Med 2024; 13(3): 92531
- URL: https://www.wjgnet.com/2220-3141/full/v13/i3/92531.htm
- DOI: https://dx.doi.org/10.5492/wjccm.v13.i3.92531


