Copyright
©The Author(s) 2021.
World J Crit Care Med. May 9, 2021; 10(3): 47-57
Published online May 9, 2021. doi: 10.5492/wjccm.v10.i3.47
Published online May 9, 2021. doi: 10.5492/wjccm.v10.i3.47
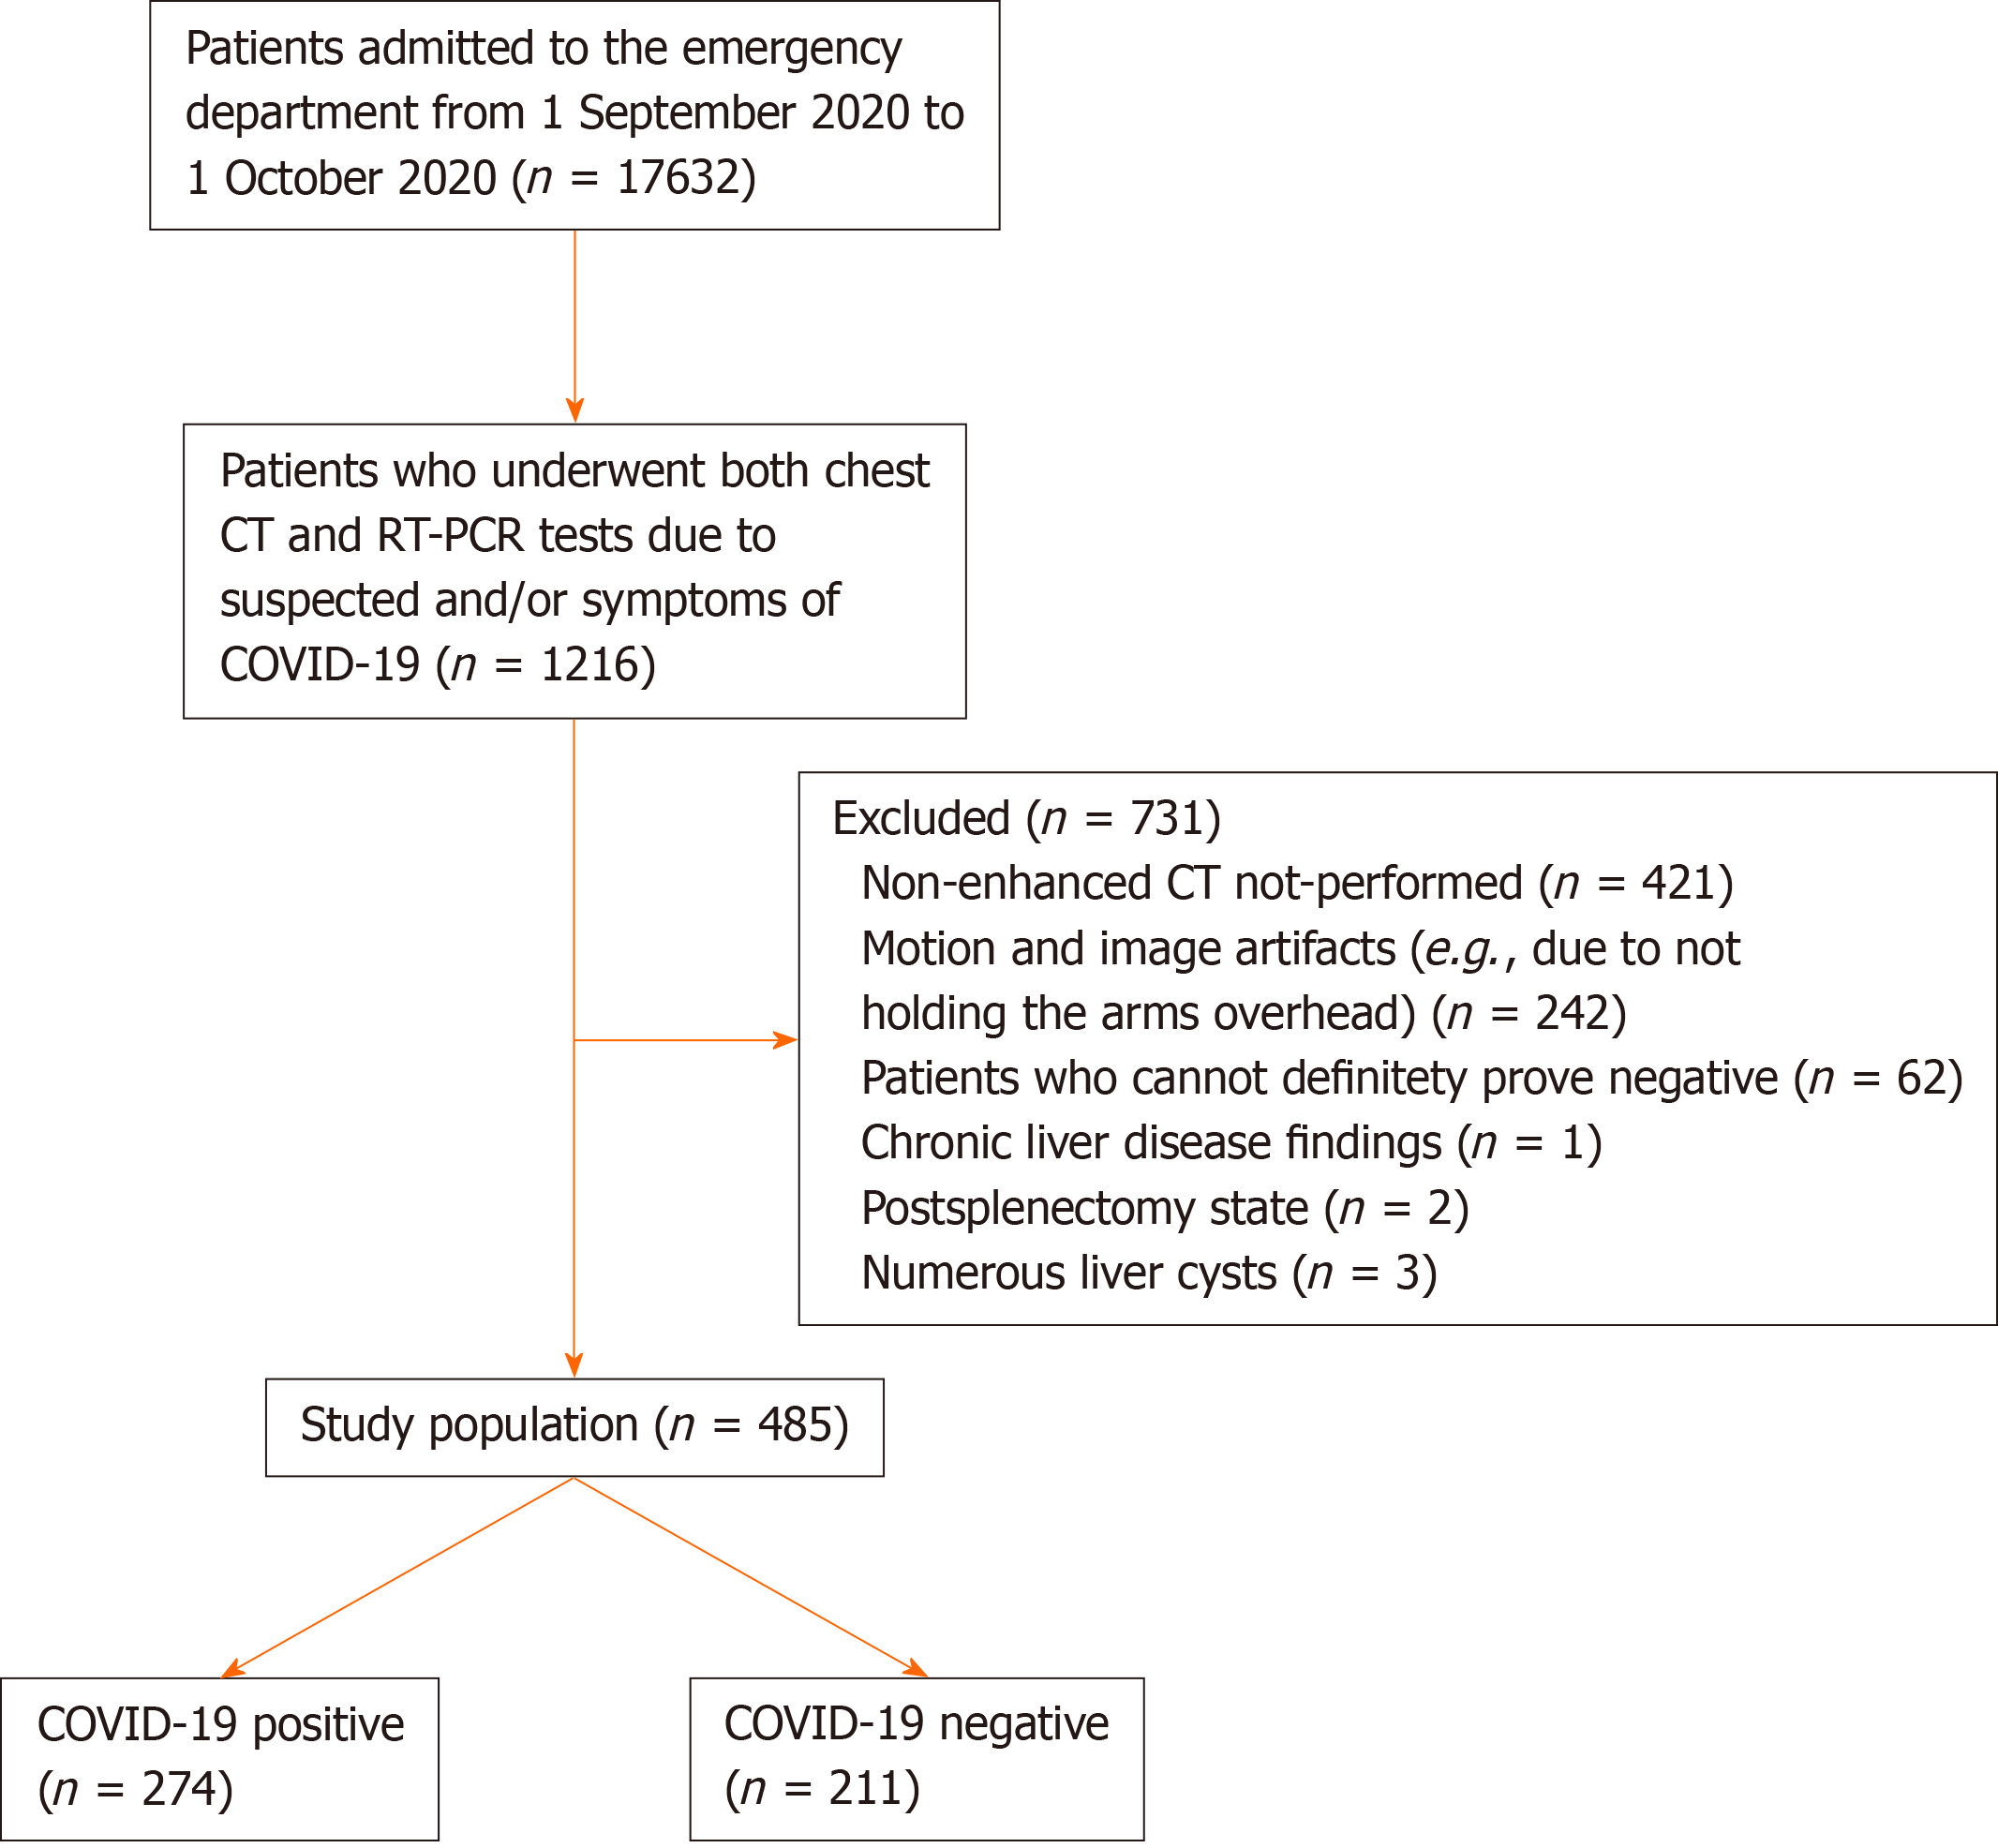
Figure 1 Flow diagram of the study population.
COVID-19: Coronavirus disease; 2019; CT: Computed tomography; RT-PCR: Reverse transcription-polymerase chain reaction.
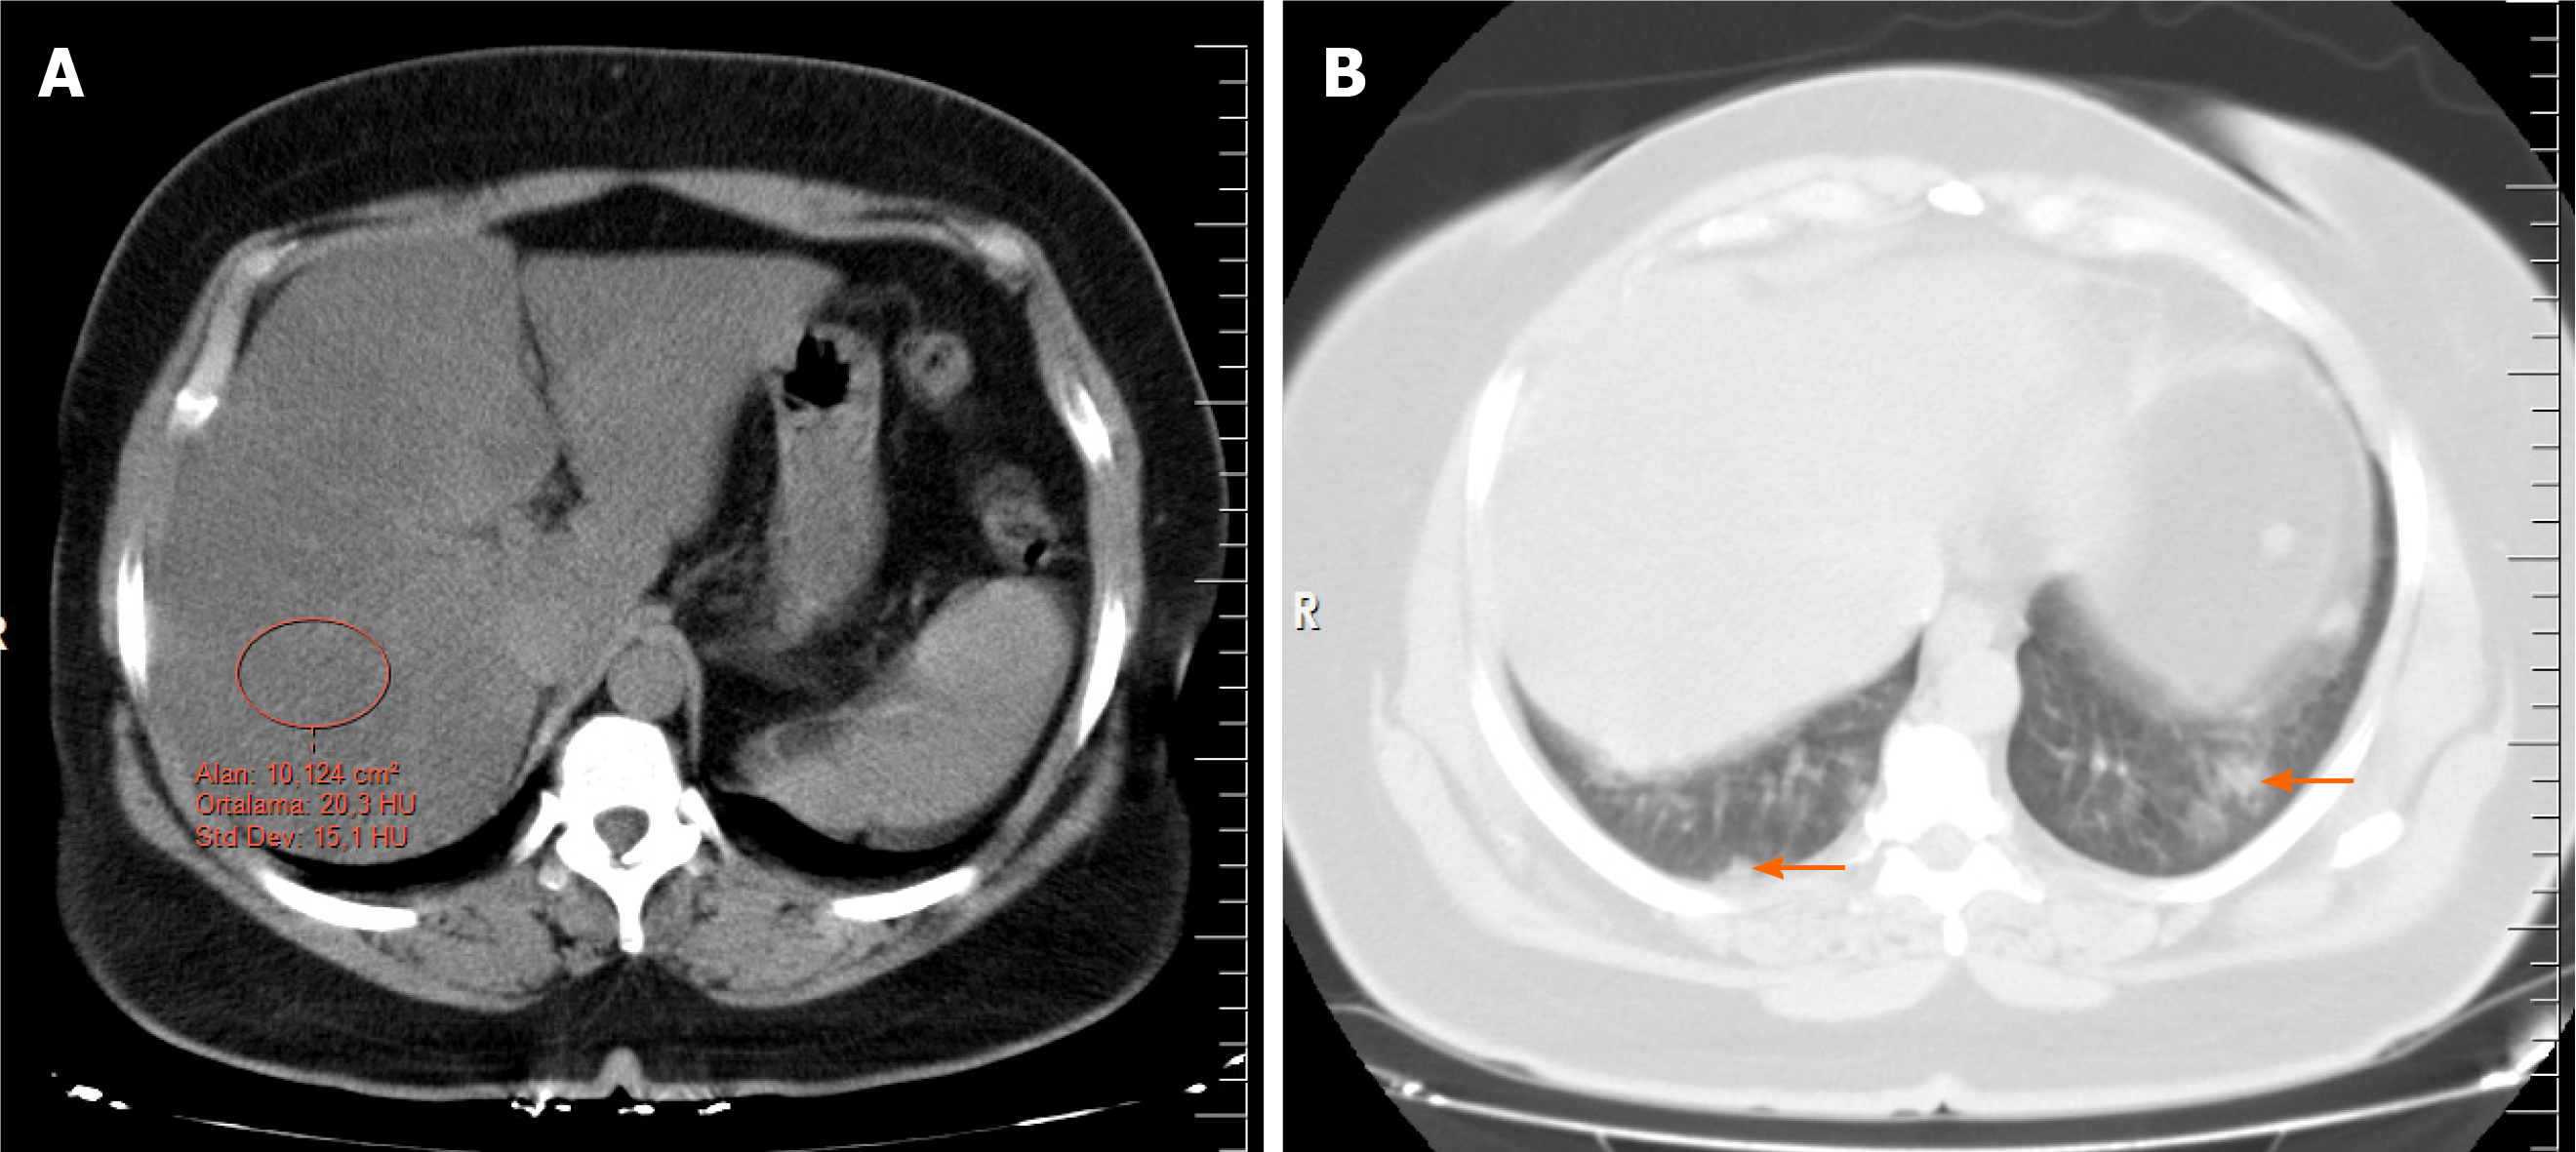
Figure 2 Noncontrast computed tomography of a patient with coronavirus disease 2019 accompanied by hepatic steatosis.
A: The abdominal window shows the determination of the attenuation value with the measurement of a single region of interest (an area of approximately 10 cm2) from the right liver lobe (segment 7); B: Lung window demonstrating lesions (orange arrows) compatible with coronavirus disease 2019.
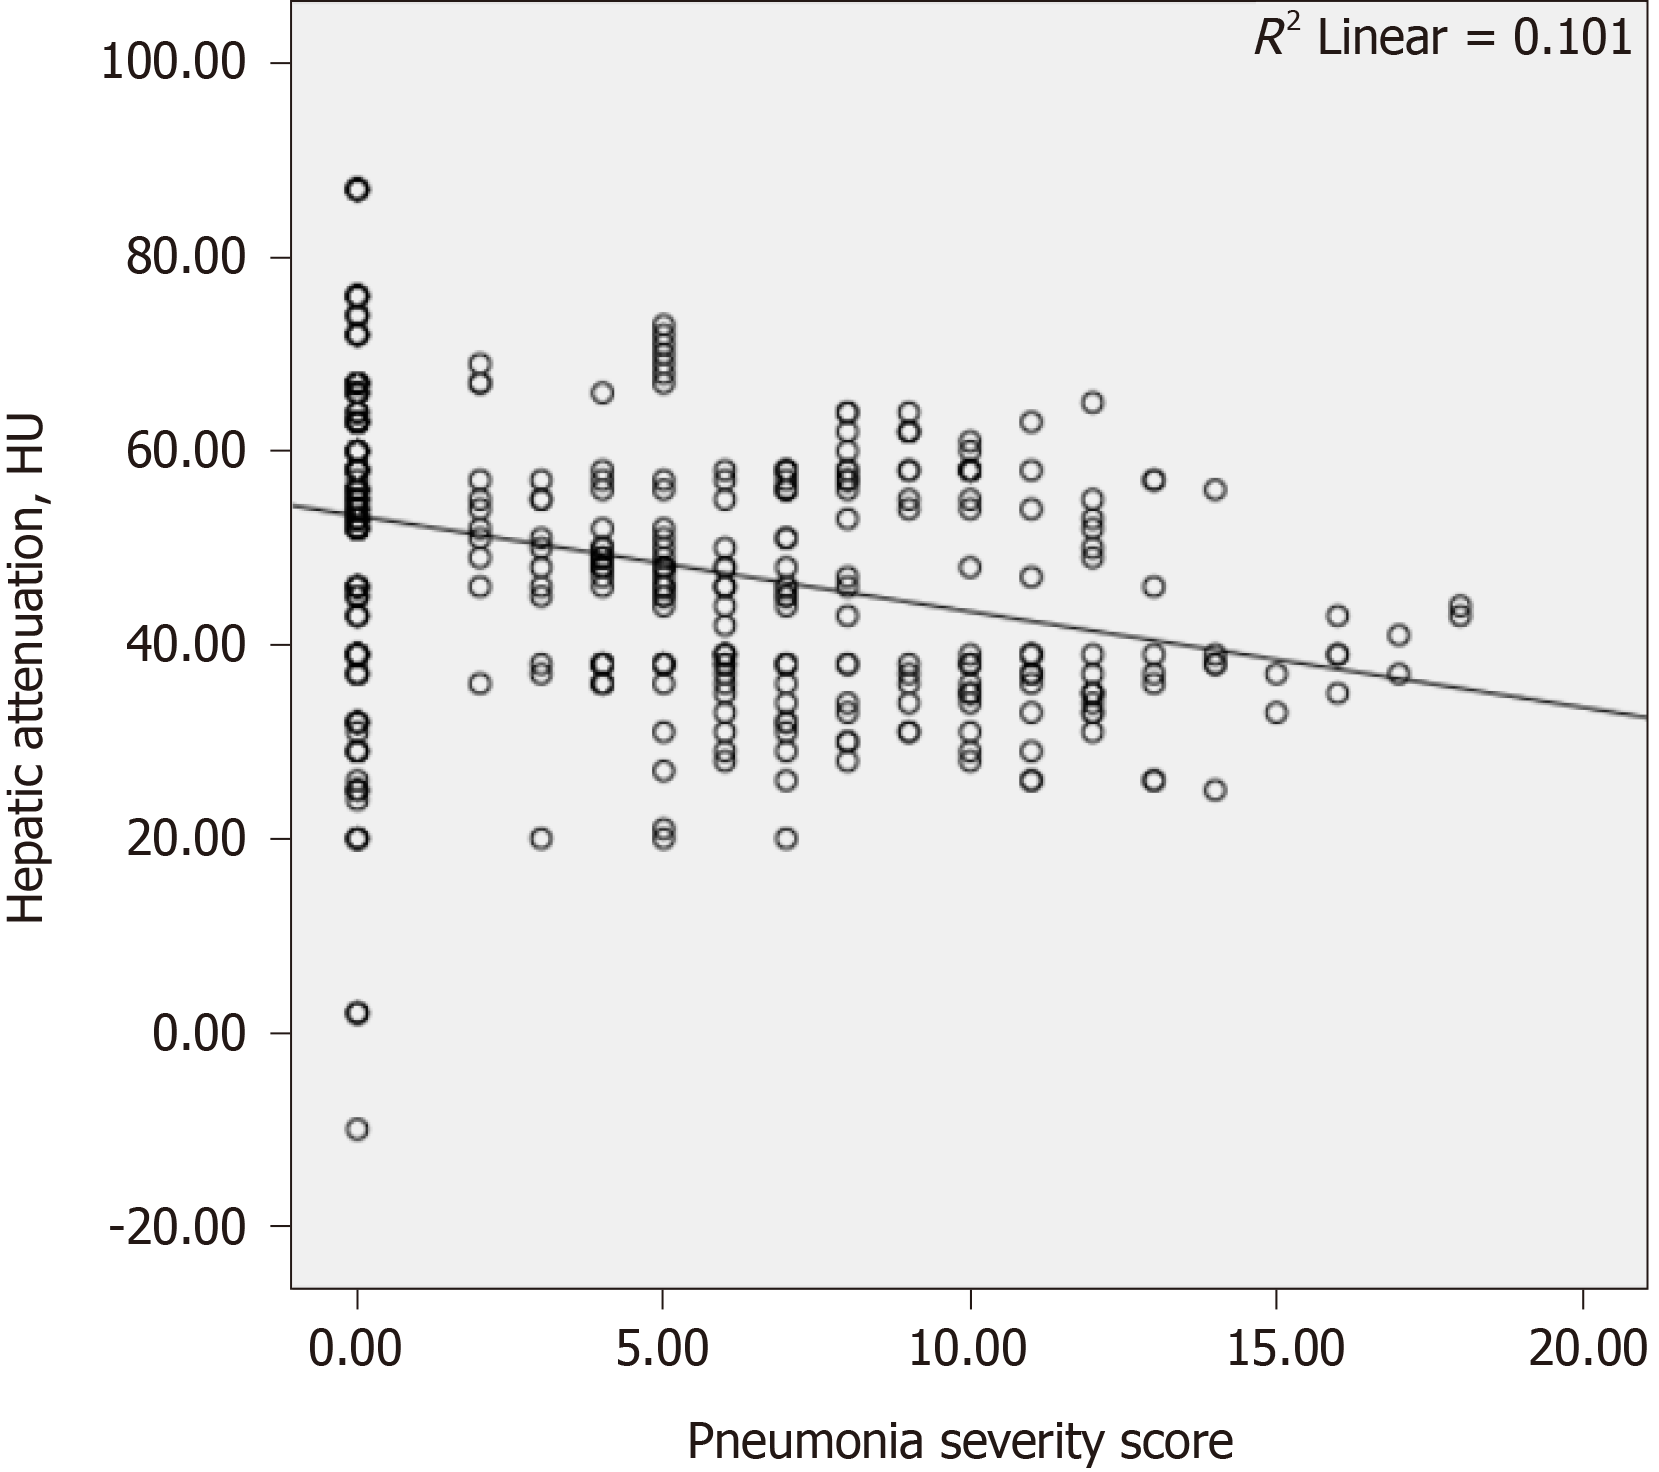
Figure 3 Scatter graph showing a negative correlation between the hepatic attenuation value and pneumonia severity score measured on computed tomography (Spearman's correlation coefficient, r = −0.
357 and P < 0.001). The mean pneumonia severity score of the coronavirus disease 2019-positive group was 7.6 (4.2-11; minimum 2, maximum 18). HU: Hounsfield unit.
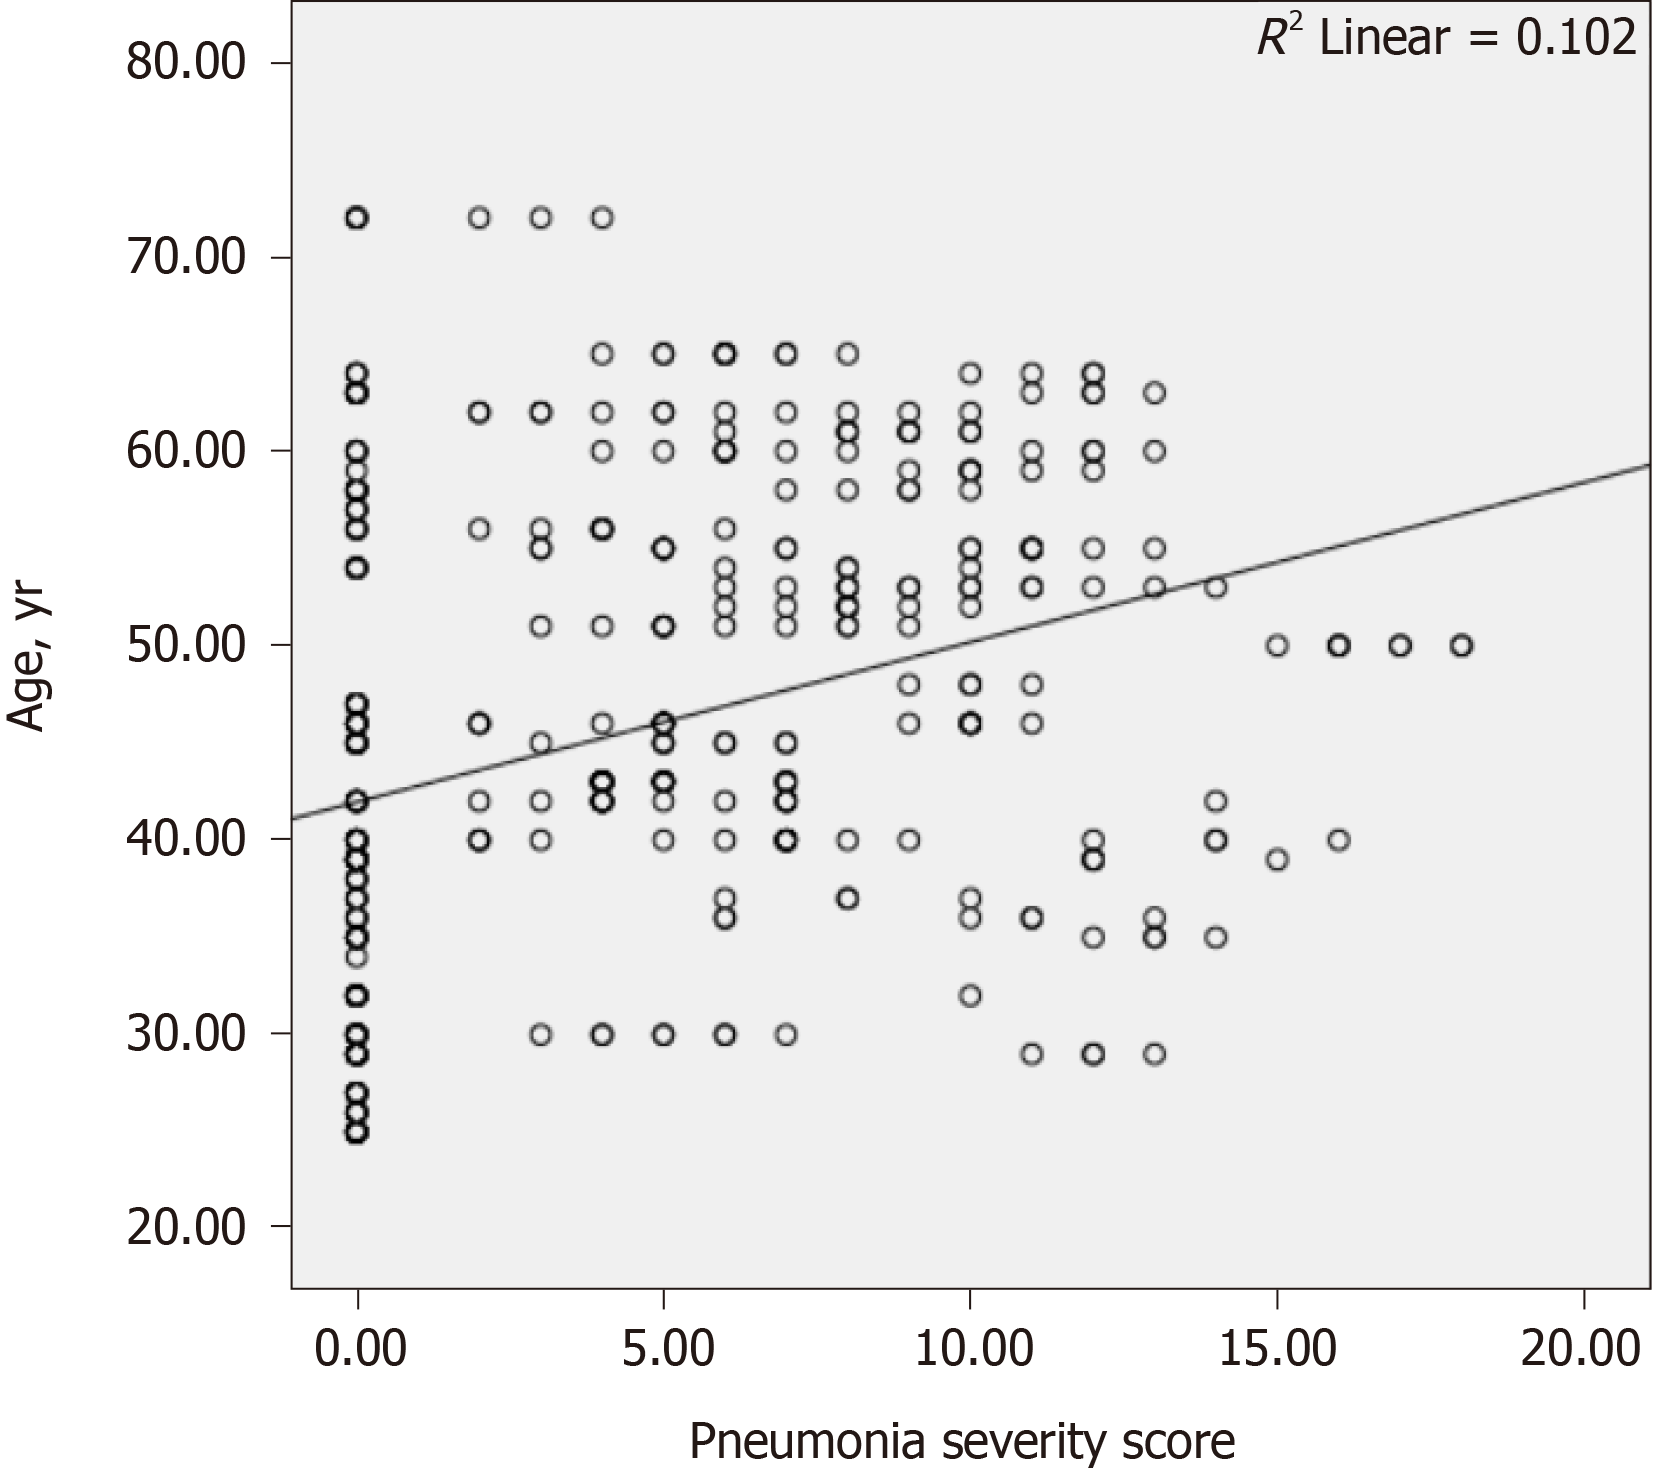
Figure 4 Scatter graph showing a positive correlation between age and the pneumonia severity score measured on computed tomography (Spearman's correlation coefficient, (r = 0.
371 and P < 0.001).
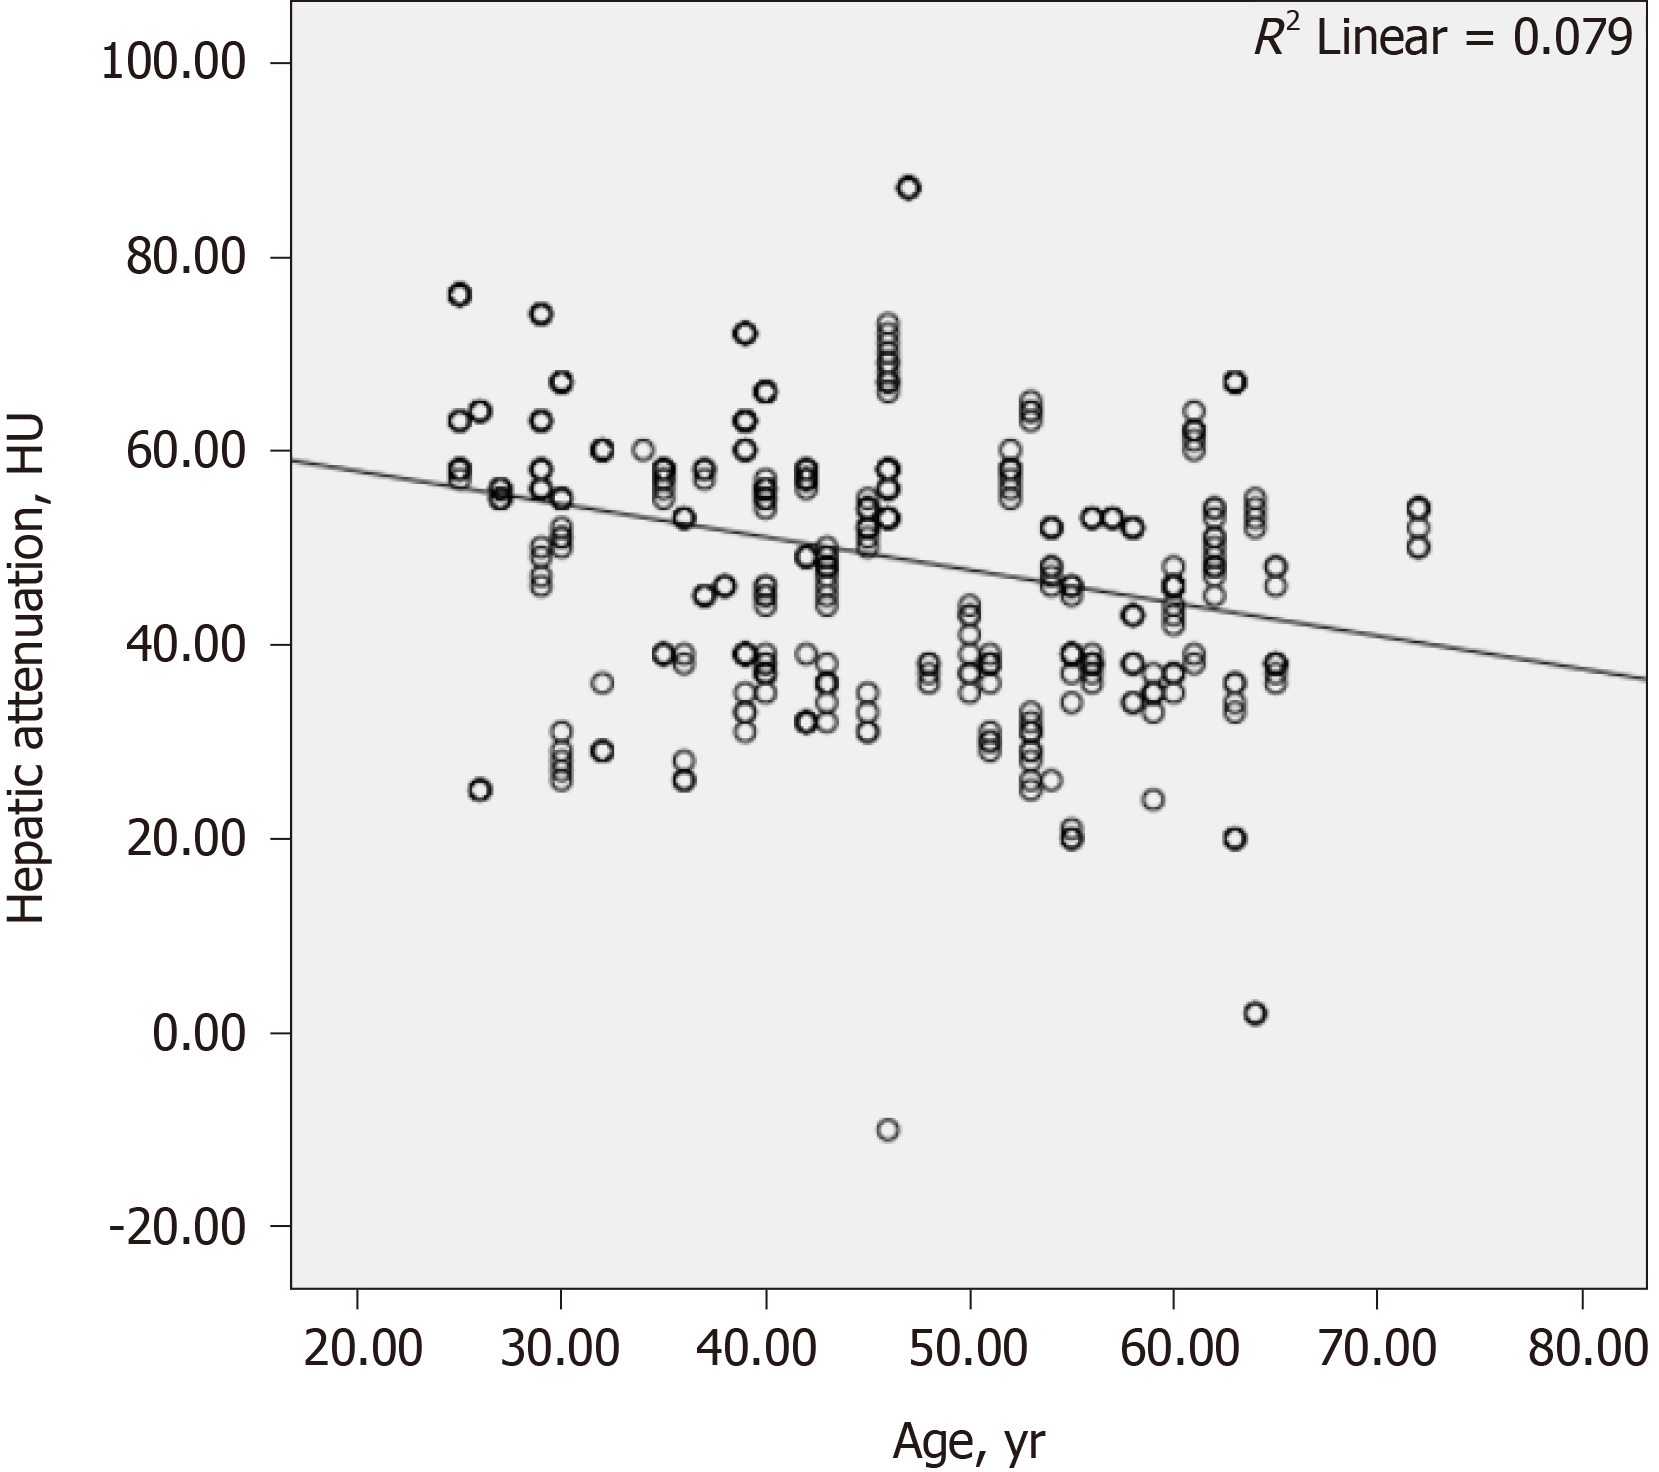
Figure 5 Scatter graph showing a negative correlation between the hepatic attenuation value and age (Spearman's correlation coefficient, r = −0.
303 and P < 0.001). HU: Hounsfield unit.
- Citation: Tahtabasi M, Hosbul T, Karaman E, Akin Y, Kilicaslan N, Gezer M, Sahiner F. Frequency of hepatic steatosis and its association with the pneumonia severity score on chest computed tomography in adult COVID-19 patients. World J Crit Care Med 2021; 10(3): 47-57
- URL: https://www.wjgnet.com/2220-3141/full/v10/i3/47.htm
- DOI: https://dx.doi.org/10.5492/wjccm.v10.i3.47


