Copyright
©The Author(s) 2016.
Figure 1 Growth of Mycobacterium marinum at 32 °C and 37 °C.
Optical density (A) and colony-forming units count (B) of Mycobacterium marinum in growth medium cultured at 32 °C and 37 °C. There is no difference between bacterial growths and viabilities at the two growth temperatures tested. The values are mean ± SEM of five independent experiments (A); two independent experiments (B), each in triplicate.
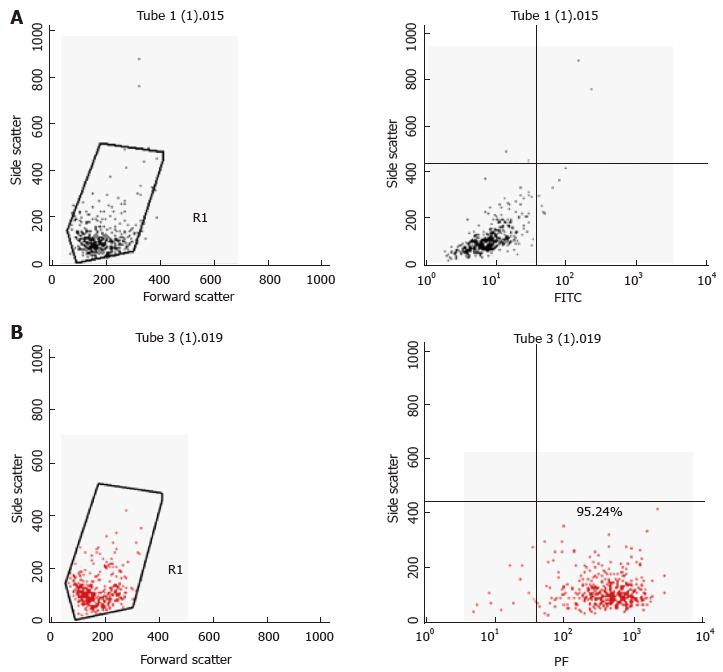
Figure 2 Characterisation of primary mast cells.
Bone marrow derived mast cells (BMDMCs) were isolated from C57Bl/6J mice and were differentiated with 100 ng/μL interleukin-3 over 5 wk. A: Isotype PE [Hamster immunoglobulin G (IgG] with isotype fluorescein isothiocyanate (FITC) (Rat IgG2b, κ) stained BMDMCs; B: Isotype FITC (Rat IgG2b, κ) with FcεRI (PE) antibody stained BMDMCs. Ninety-five percent of cells stained positively with FcεRI (PE) antibody.
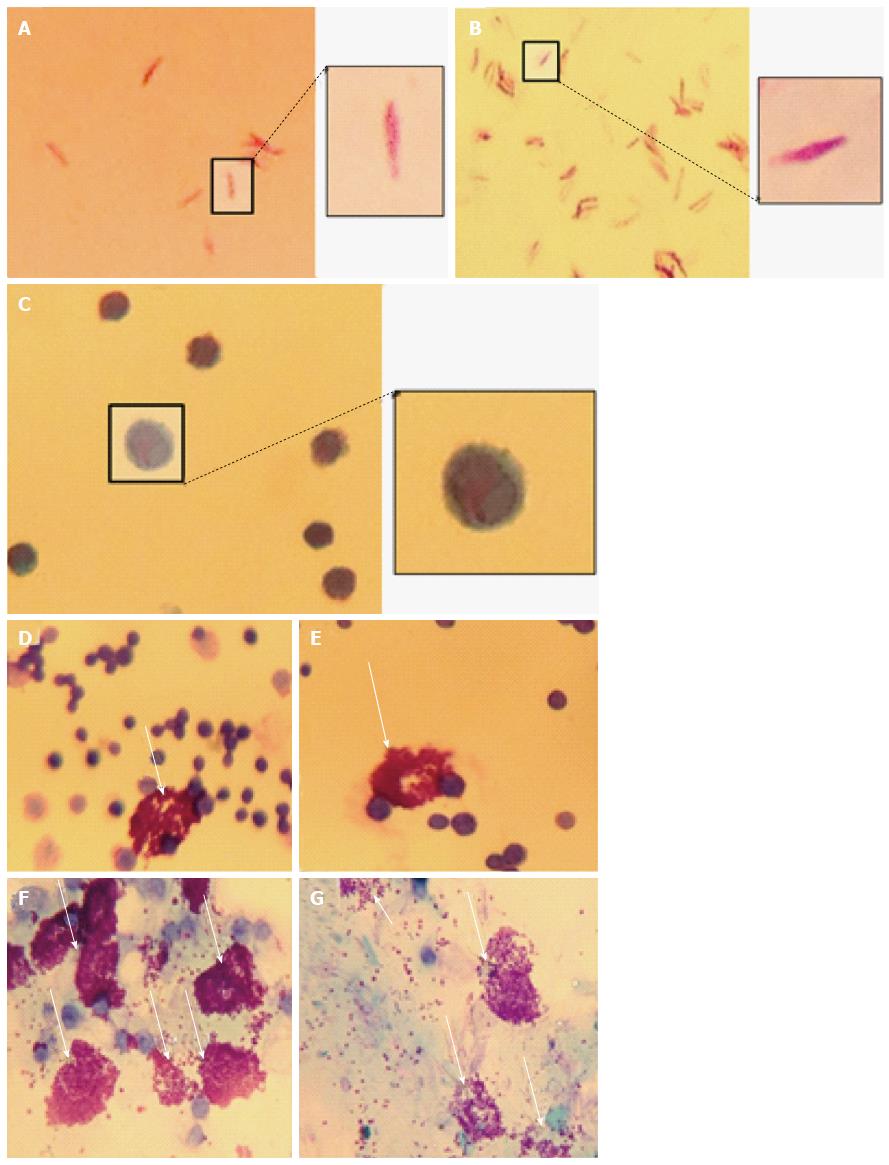
Figure 3 Peritoneal mast cells stimulated with Mycobacterium marinum degranulate.
Heat-killed (A) and untreated (B) Mycobacterium marinum (M. marinum) positive for Kinyoun’s acid fast stain, while peritoneal mast cells from mice injected with heat-killed M. marinum were negative (C). Metachromatic granules of peritoneal mast cells are stained with toluidine blue from unstimulated mice (D, E) and mice injected with heat-killed M. marinum (F, G). An exemplary image of each experimental mouse is shown (Olympus CH2, × 100 oil immersion, captured using iPhone 4S).
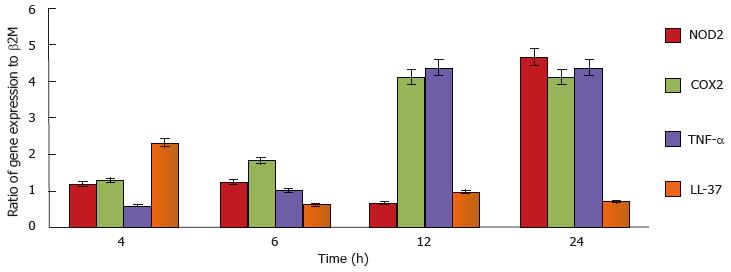
Figure 4 quantitative reverse transcriptase- polymerase chain reaction analysis of inflammatory genes from human mast cell line incubated with Mycobacterium marinum (MOI 10).
The target inflammatory genes were normalised to individual housekeeping gene (β2M), thereafter the target genes were calculated against control human mast cell line cells and expressed as fold change. The error bars show standard deviation of two-four independent experiments, each in either duplicate or triplicate. NOD2: Nucleotide-binding oligomerization domain-containing protein 2; COX2: Cyclooxygenase 2; TNF-α: Tumour necrosis factor-α.
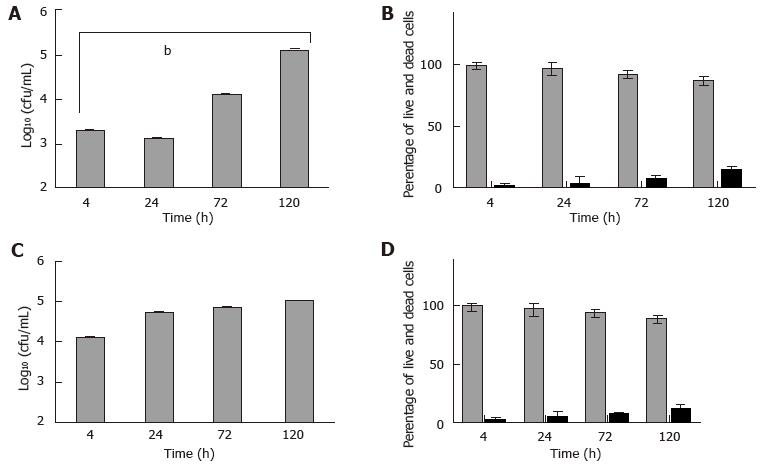
Figure 5 Mast cells infected in vitro with Mycobacterium marinum: Viable counts and cell viability.
Bone marrow derived mast cells (A, B) and human mast cell line (C, D) were infected with Mycobacterium marinum at MOI 0.5 for up to 120 h. After 4 h of infection, cells were rinsed and treated with 200 µg/mL amikacin for 2 h. At each time point intracellular bacteria were determined by enumerating colony forming units (CFU) (A, C). The values are mean ± SD of three to four independent experiments, each in triplicate. A: P < 0.0008. Viability was assessed for mast cells at these timepoints (B, D). After 4 h of infection, the cells were washed and treated with 200 μg/mL amikacin for 2 h. The values are mean ± SD of three independent experiments, each in triplicate. MOI: Multiplicity of infection.
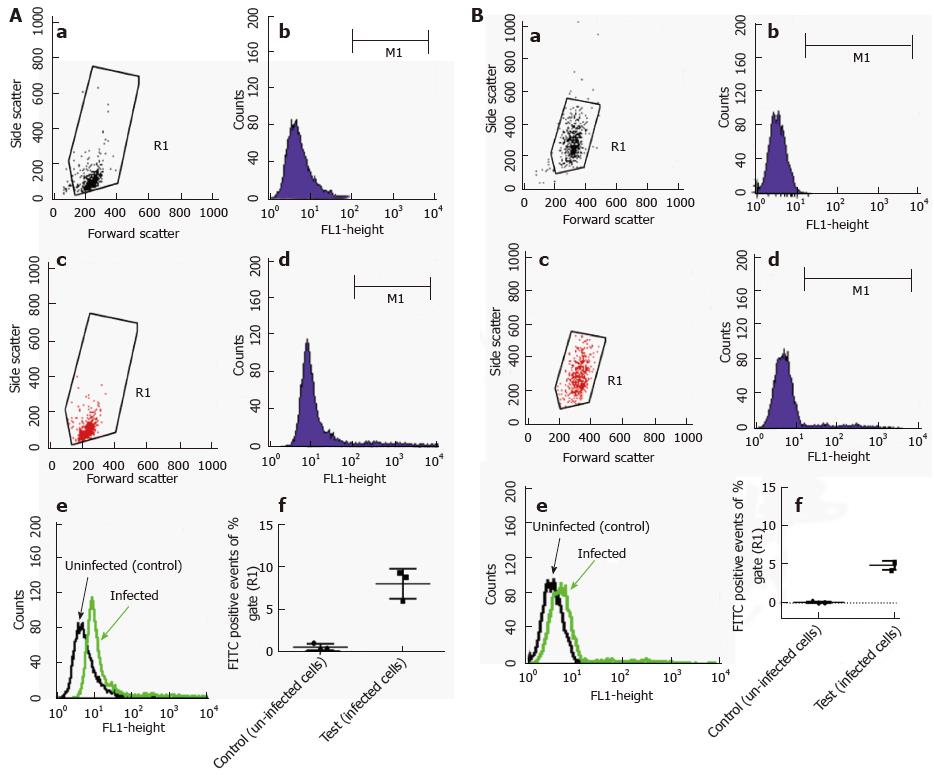
Figure 6 Flow cytometric detection of intracellular fluorescein isothiocyanate labelled Mycobacterium marinum (trypan blue quenching method).
A: bone marrow derived mast cells; B: Human mast cell line. Density plot and histogram to measure R1 gate of uninfected control cells (a, b) and of cells infected with Mycobacterium marinum at MOI 10 for 24 h (c, d); e: Overlay of b and d; f: Portion of fluorescent signal of R1 gate (fluorescein isothiocyanate labelled bacteria), expressed in percentage. This data is a collection of three independent experiments, each performed in duplicate; error bars represent standard deviations. MOI: Multiplicity of infection.
Figure 7 Representative image of human mast cell line cell infected with green fluorescent protein expressing Mycobacterium marinum.
A: Green fluorescent protein expressing Mycobacterium marinum; B: Human mast cell line in phase contrast; C: Overlay image of A and B.
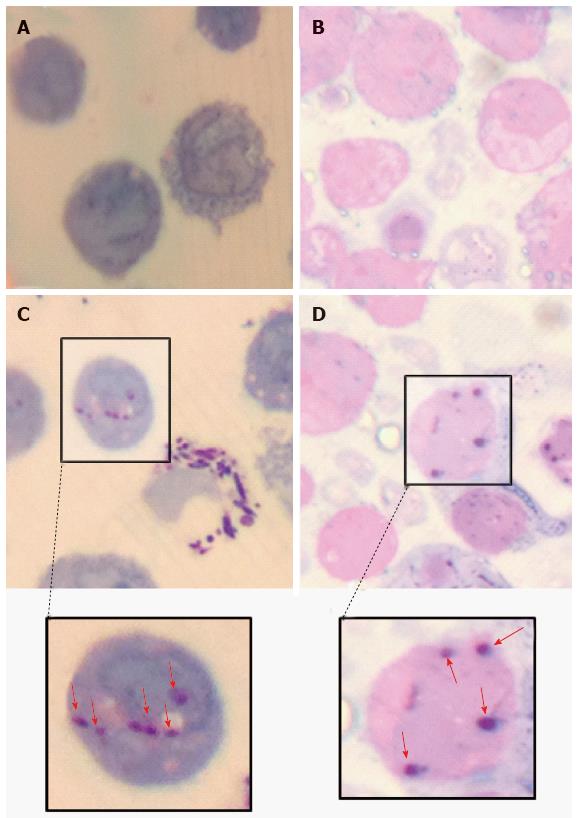
Figure 8 Light microscopic evidence of the intracellular presence of Mycobacterium marinum in human mast cell line.
Gram-Twort stained, 0.5 µm thin cross sections of Mono Mac 6 cells [A: uninfected; C: infected with Mycobacterium marinum (M. marinum) at MOI 10 for 24 h] and human mast cell line (HMC-1) cells (B: Uninfected; D: Infected HMC-1 cells with M. marinum at MOI 10 for 24 h). The red arrows in insets C and D indicate internalised M. marinum (Olympus CH2, × 100 oil immersion, captured using iPhone 4).
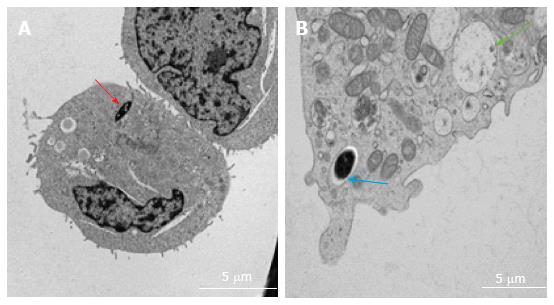
Figure 9 Transmission electron microscopy images of intracellular localisation of mycobacteria in human mast cell line (A) and bone marrow derived mast cells (B).
Cells infected with Mycobacterium marinum at MOI 10 for 24 h. A, red arrow: Cytoplasmic localisation; B, blue arrow: Vacuolar localisation; green arrow: Empty vacuole comparable to those described for degranulating mast cells[11]. MOI: Multiplicity of infection.
- Citation: Siad S, Byrne S, Mukamolova G, Stover C. Intracellular localisation of Mycobacterium marinum in mast cells. World J Immunol 2016; 6(1): 83-95
- URL: https://www.wjgnet.com/2219-2824/full/v6/i1/83.htm
- DOI: https://dx.doi.org/10.5411/wji.v6.i1.83


