Copyright
©2012 Baishideng Publishing Group Co.
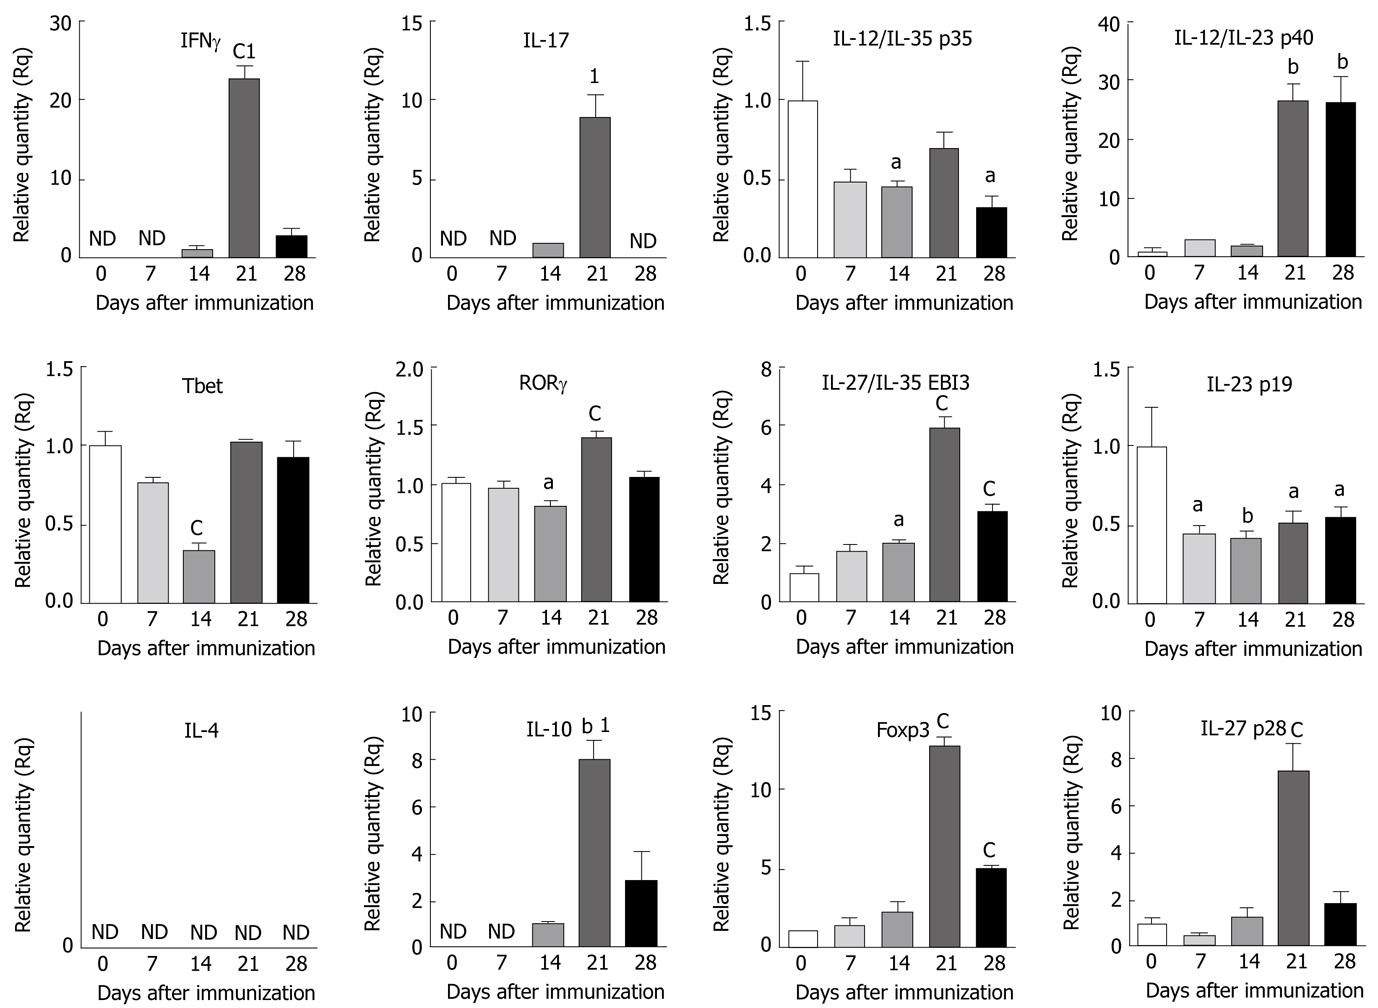
Figure 1 Expression of cytokines and transcription factors in the central nervous system of mice with experimental autoimmune encephalomyelitis.
Brain samples were isolated from C57BL/6 mice on different days as indicated following induction of experimental autoimmune encephalomyelitis (EAE). Total RNA was extracted from individual tissue samples and reverse transcribed into cDNA. Equal quantities of cDNA from two mice per group were combined and analyzed by quantitative reverse transcription polymerase chain reaction using 18S as the internal control. The fold changes in the expression of selected genes in the central nervous system of mice with EAE were calculated based on naïve as control. 1If naïve samples were undetectable, fold changes in the expression of cytokines in EAE mice were calculated based on day 14 samples as control. The data shown are the mean ± SE of quadruplicates and the statistical significance is shown as aP < 0.05, bP < 0.01, cP < 0.001, vs naïve or day 14. ND: Not detectable; IFNγ: Interferon gamma; IL: Interleukin; RORγ: Related orphan receptor gamma.
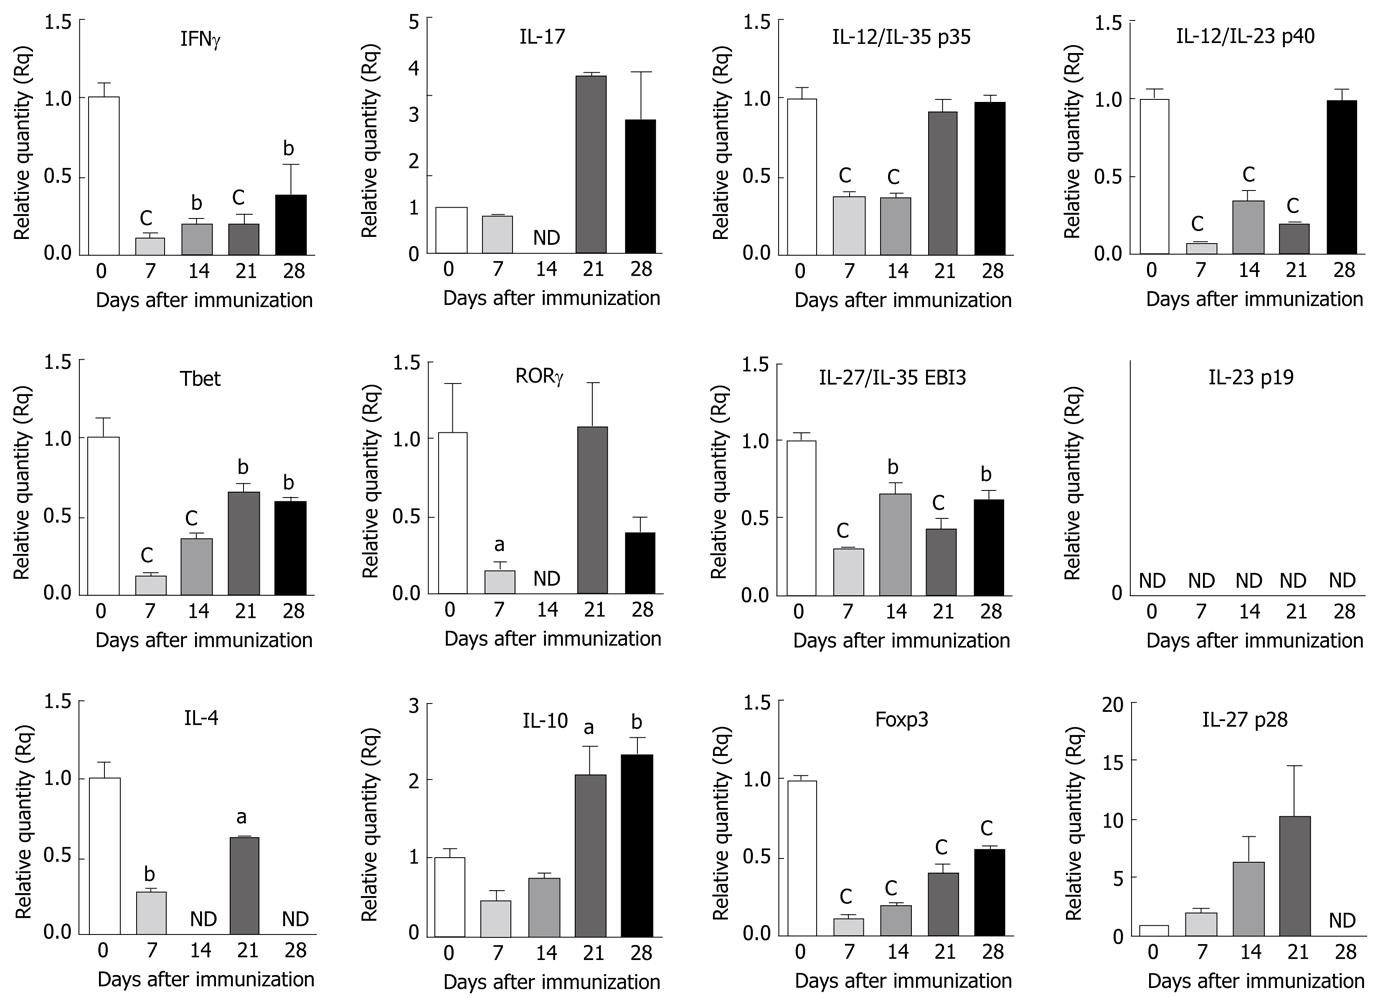
Figure 2 Expression of cytokines and transcription factors in the lymphoid organ of mice with experimental autoimmune encephalomyelitis.
Spleen samples were isolated from C57BL/6 mice on different days as indicated following induction of experimental autoimmune encephalomyelitis (EAE). Total RNA was extracted from individual tissue samples and cDNA was reverse transcribed. Equal quantities of cDNA from two mice per group were combined and analyzed by quantitative reverse transcription polymerase chain reaction using 18S as the internal control. The fold changes in the expression of selected genes in the spleen of mice with EAE were calculated based on naïve as control. The data shown are the mean ± SE of quadruplicates and the statistical significance is shown as aP < 0.05, bP < 0.01, cP < 0.001. ND: Not detectable.
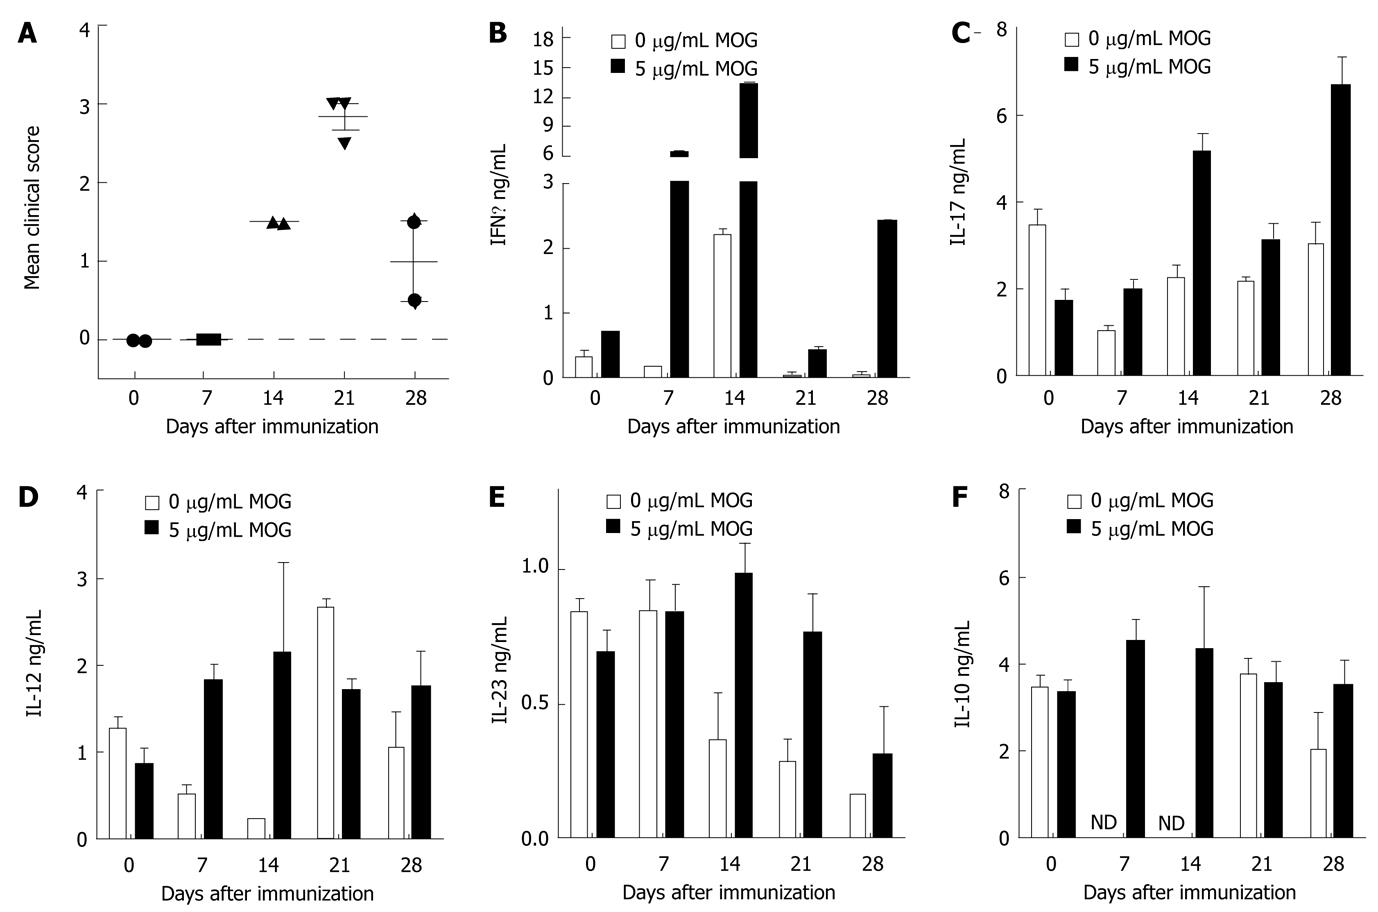
Figure 3 Secretion of cytokines from neural antigen sensitized spleen cells in culture.
C57BL/6 male mice were induced to develop experimental autoimmune encephalomyelitis (EAE) by immunization with MOGp35-55. A: The clinical signs were scored on the day of sacrifice and presented as the mean ± SE for each group. The data represent 2 separate experiments; B-F: Spleen cells were isolated on different days following induction of EAE and cultured in the presence of 0 or 5 μg/mL of MOGp35-55 for 48 h. Cytokine secretion was analyzed in the pooled culture supernatants from two mice per group by enzyme linked immunosorbant assay. The data shown are the mean ± SE of triplicates.
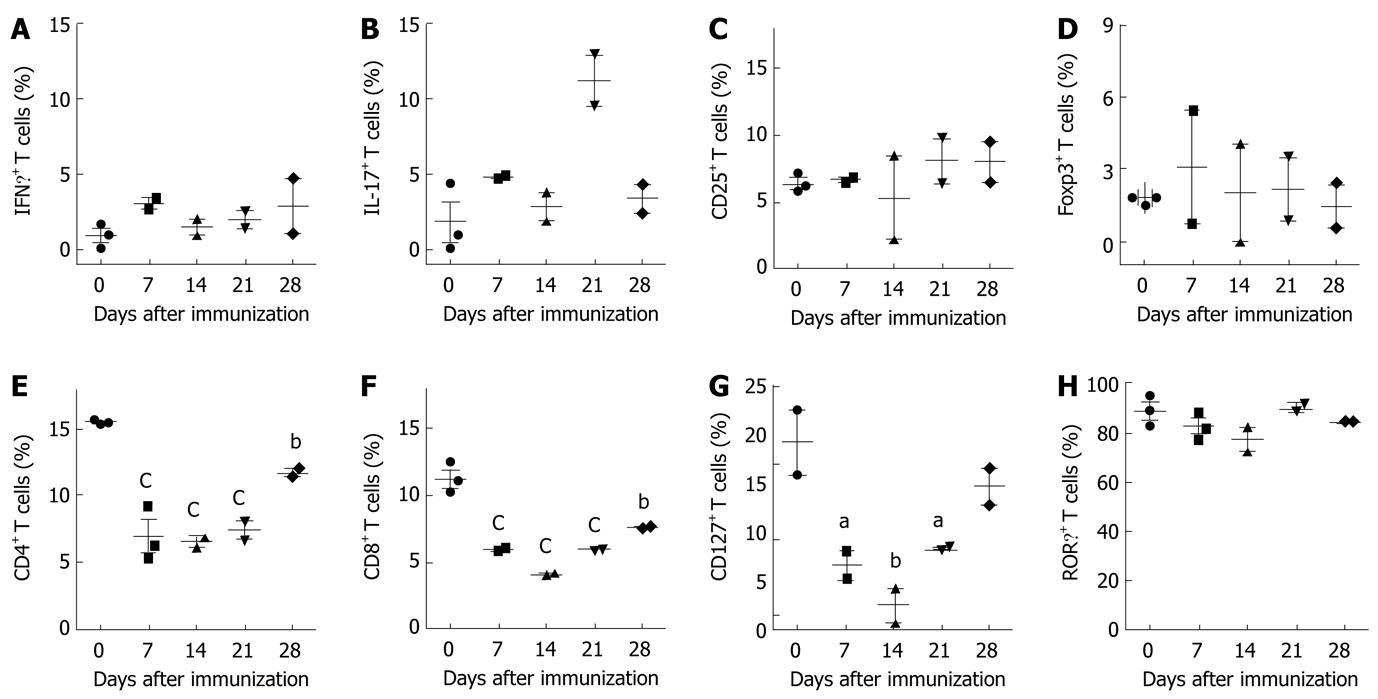
Figure 4 Analysis of T cell activation markers in mice with experimental autoimmune encephalomyelitis.
Spleen cells were isolated from C57BL/6 mice on different days following induction of experimental autoimmune encephalomyelitis. A-B: Cells were cultured with phorbol 12-myristate 13-acetate and ionomycin for 6 h. GolgiStop (monensin) was added for the last 5 h of culture, and intracellular interleukin (IL)-17 and interferon gamma (IFNγ) were analyzed by flow cytometry; C: Fresh spleen cells were analyzed for expression of CD25; D: Foxp3; E: CD4; F: CD8; G: CD127; H: Related orphan receptor gamma (RORγ) by flow cytometry. The graphs show positive cells for selected single stain at each time point and represent the mean ± SE from at least two independent experiments. aP < 0.05, bP < 0.01, cP < 0.001.
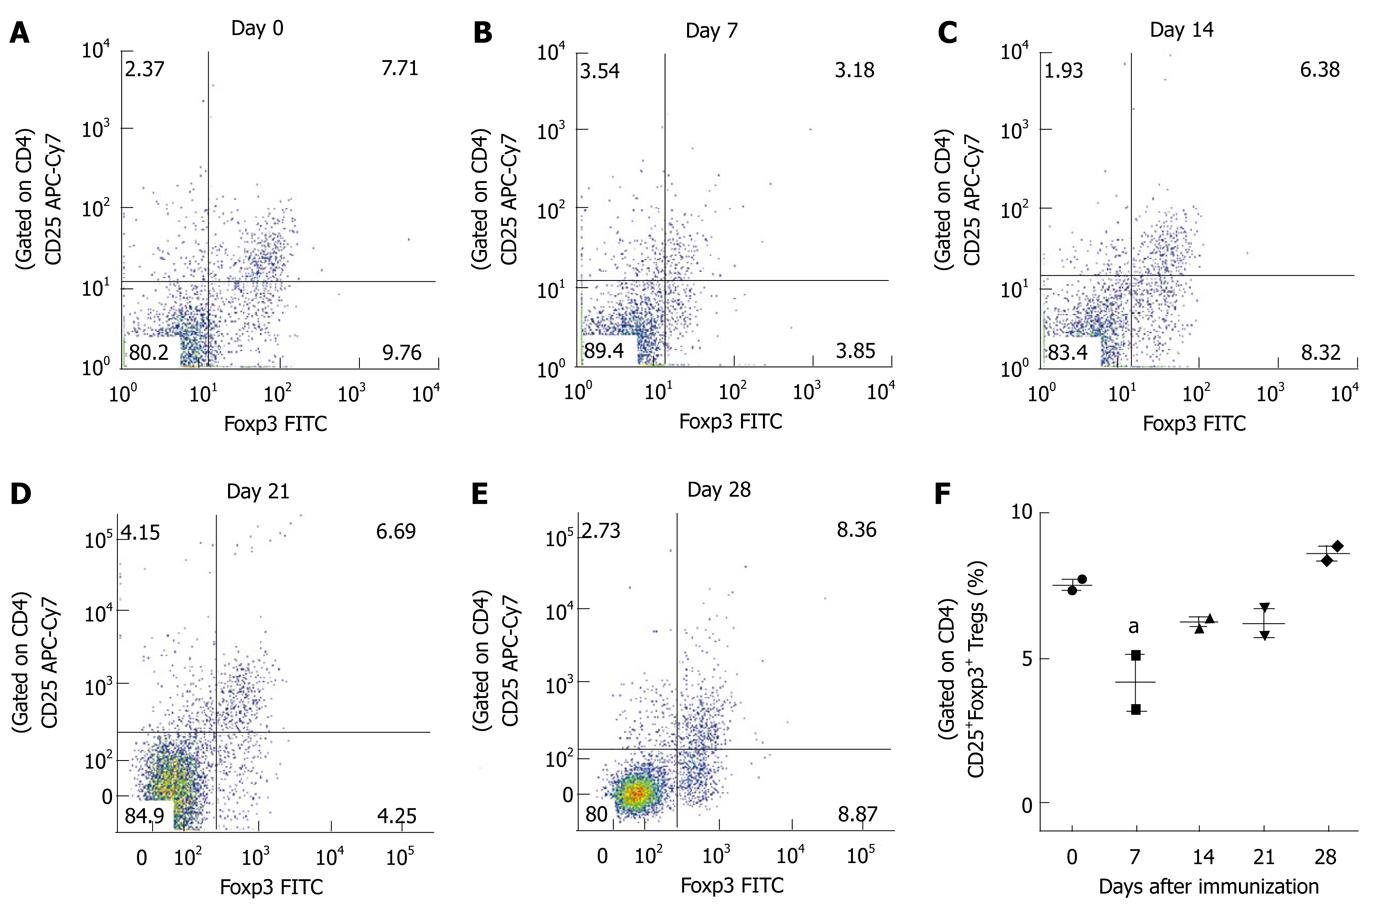
Figure 5 Analysis of regulatory T cells in mice with experimental autoimmune encephalomyelitis.
Spleen cells were isolated from C57BL/6 mice on different days following induction of experimental autoimmune encephalomyelitis. Fresh spleen cells were analyzed for surface antigens CD4 and CD25 and intracellular Foxp3 by flow cytometry. A-E: Representative dot plots show CD25 and Foxp3 expression in CD4+ T cells at different time points; F: The percentages of CD4+CD25+Foxp3+Tregs are shown for each time point and the graph represents the mean ± SE from two independent experiments. The statistical significance is shown as aP < 0.05.
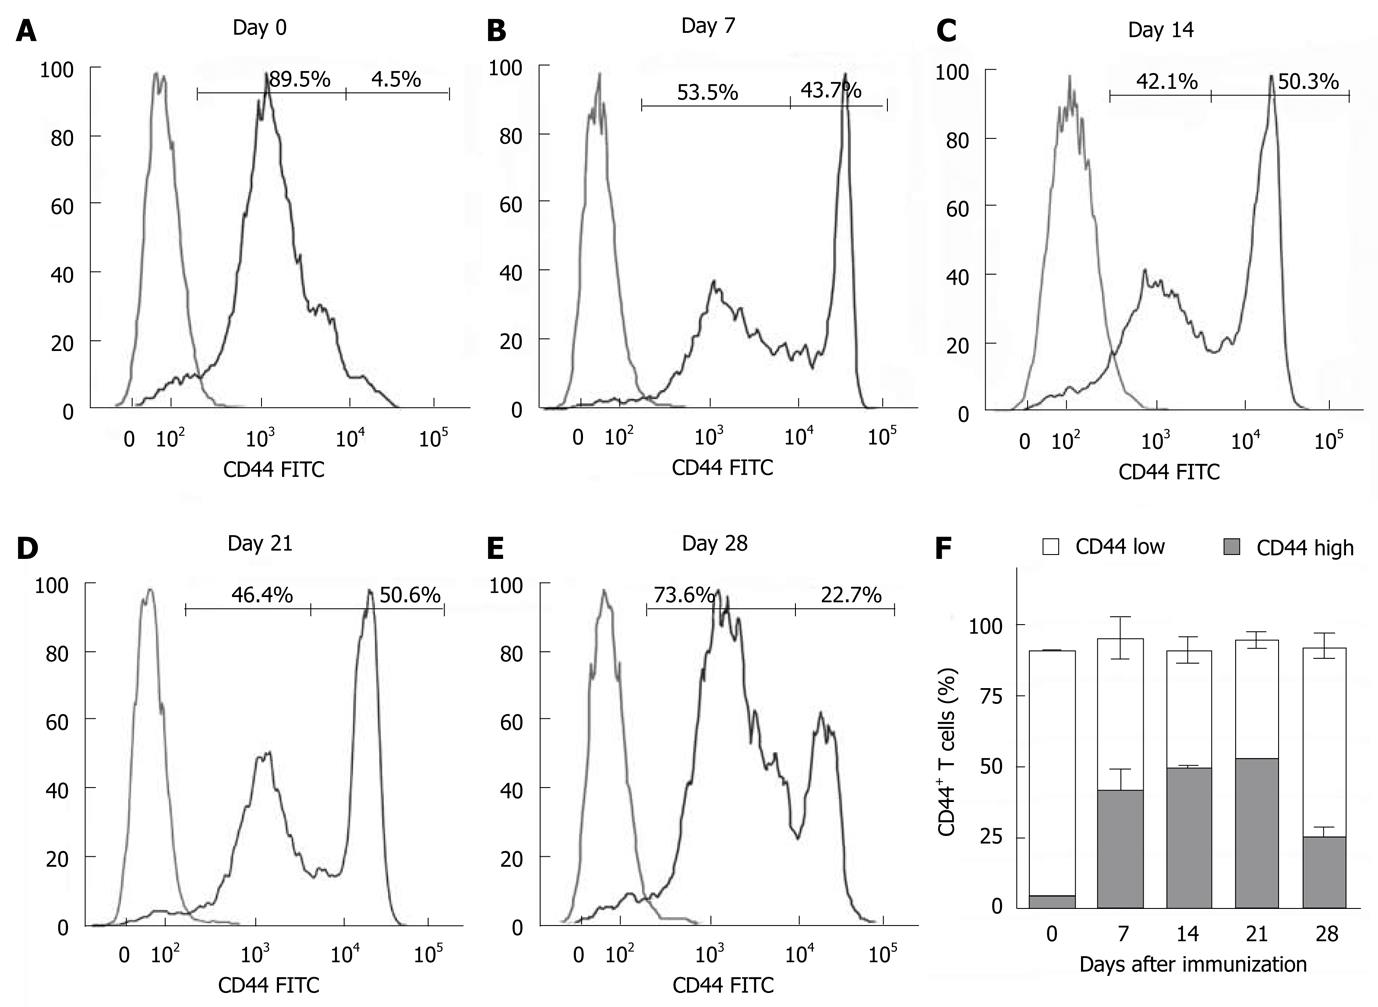
Figure 6 Analysis of memory T cells in mice with experimental autoimmune encephalomyelitis.
Spleen cells were isolated from C57BL/6 mice on different days following induction of experimental autoimmune encephalomyelitis. Fresh spleen cells were analyzed for the surface antigen CD44 by flow cytometry. A-E: Representative histograms of CD44low and CD44high expression for each time point are shown; F: The percentage of total CD44+ cells for each time point is shown as the combination of CD44low (white bar) and CD44low (gray bar). The graph represents the mean ± SE from two independent experiments.
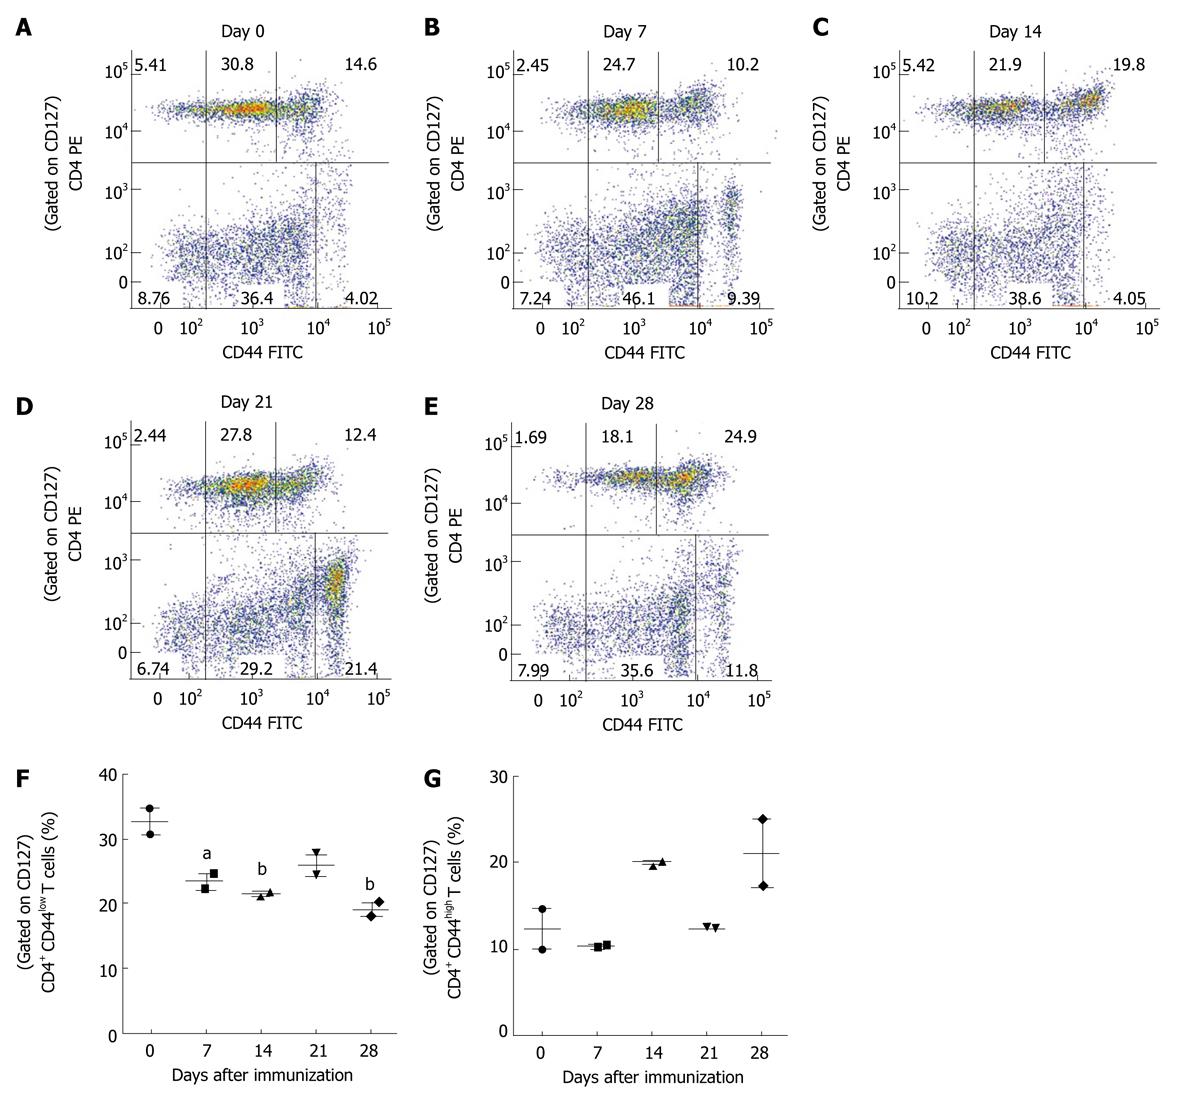
Figure 7 Analysis of effector and memory T cells in mice with experimental autoimmune encephalomyelitis.
Spleen cells were isolated from C57BL/6 mice on different days following induction of experimental autoimmune encephalomyelitis. Fresh spleen cells were analyzed for surface antigens CD4, CD44 and CD127 by flow cytometry. A-E: Representative dot plots show CD44 and CD4 expression in CD127+ T cells at different time points; F: The percentages of CD4+CD44lowCD127+ effector cells or G, CD4+CD44highCD127+ memory T cells are shown for each time point. The graphs represent the mean ± SE from two independent experiments and the statistical significance is shown as aP < 0.05, bP < 0.01 vs naïve.
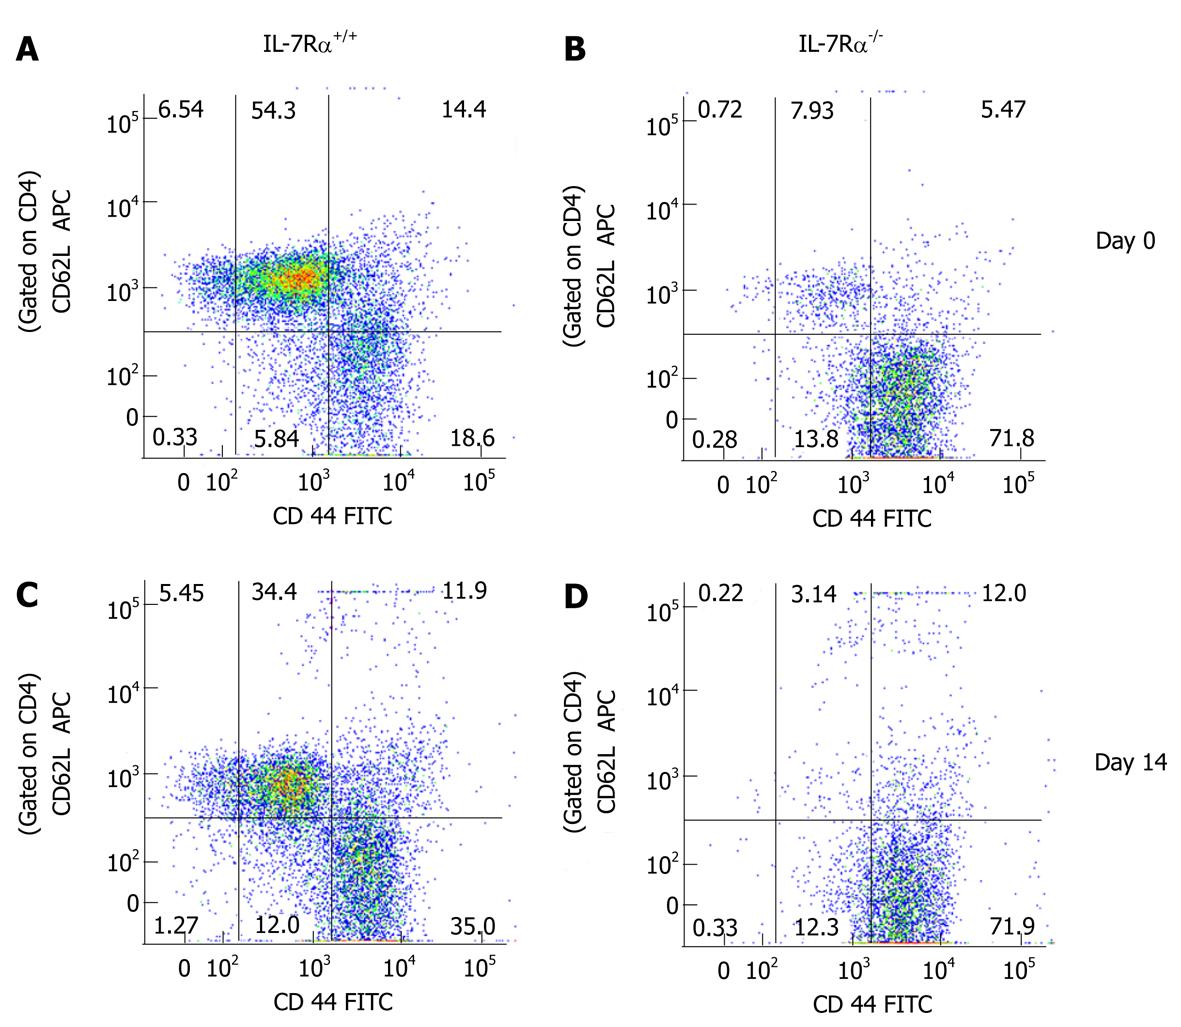
Figure 8 Analysis of central and effector memory T cells in mice induced to develop experimental autoimmune encephalomyelitis.
Spleen cells were isolated from C57BL/6 wild type and interleukin (IL)-7R-/- naïve mice or on day 14 following immunization with MOGp35-55. Fresh spleen cells were analyzed for surface antigens CD4, CD44 and CD62L by flow cytometry. Representative dot plots for CD62L and CD44 expression in CD4+ spleen cells from wild-type or IL-7R-/- mice are shown. The figure is representative of two independent experiments.
- Citation: Walline CC, Kanakasabai S, Bright JJ. Dynamic interplay of T helpercell subsets in experimental autoimmune encephalomyelitis. World J Immunol 2012; 2(1): 1-13
- URL: https://www.wjgnet.com/2219-2824/full/v2/i1/1.htm
- DOI: https://dx.doi.org/10.5411/wji.v2.i1.1


