Published online Sep 9, 2024. doi: 10.5409/wjcp.v13.i3.96018
Revised: May 18, 2024
Accepted: June 5, 2024
Published online: September 9, 2024
Processing time: 127 Days and 16.2 Hours
The neonatal intensive care unit (NICU) is vital for preterm infants but is often plagued by harmful noise levels. Excessive noise, ranging from medical equip
To measure the sound levels in a NICU and reduce ambient sound levels by at least 10% from baseline.
A quasi-experimental quality improvement project was conducted over 4 mo in a 20-bed level 3 NICU in a tertiary care medical college. Baseline noise levels were recorded continuously using a sound level meter. The interventions included targeted education, environmental modifications, and organizational changes, and were implemented through three rapid Plan-Do-Study-Act (PDSA) cycles. Weekly feedback and monitoring were conducted, and statistical process control charts were used for analysis. The mean noise values were compared using the paired t-test.
The baseline mean ambient noise level in the NICU was 67.8 dB, which decreased to 50.5 dB after the first cycle, and further decreased to 47.4 dB and 51.2 dB after subsequent cycles. The reduction in noise levels was 21% during the day and 28% at night, with an overall decrease of 25% from baseline. The most significant reduction occurred after the first PDSA cycle (mean difference of −17.3 dB, P < 0.01). Peak noise levels decreased from 110 dB to 88.24 dB after the intervention.
A multifaceted intervention strategy reduced noise in the NICU by 25% over 4 months. The success of this initiative emphasizes the significance of comprehensive interventions for noise reduction.
Core Tip: In our neonatal intensive care unit study, we addressed the problem of high noise levels that can negatively affect the health and development of neonates. We implemented a multifaceted approach of targeted education, environmental modifications, and organizational changes. As a result, we reduced the noise levels by up to 25% over 4 mo. Although we did not assess clinical outcomes, our study provides a foundation for future research and emphasizes the need to maintain optimal noise levels for the well-being of neonates.
- Citation: Rangaswamy DR, Kamble N, Veeramachaneni A. Quieting the neonatal intensive care unit: A quality improvement initiative. World J Clin Pediatr 2024; 13(3): 96018
- URL: https://www.wjgnet.com/2219-2808/full/v13/i3/96018.htm
- DOI: https://dx.doi.org/10.5409/wjcp.v13.i3.96018
The neonatal intensive care unit (NICU) is a critical care environment for preterm infants who require specialized medical attention. However, the NICU is also a noisy environment that harms neonate health. Noise refers to any unwanted sound that hampers performance and triggers a stressful physiological and psychological response[1]. Some noise sources are continuous sounds from monitors, ventilators, alarms, infusion pumps, incubators, and conversations between doctors, staff and family[2]. Studies show that the average noise levels in NICUs range from 7 to 120 dB[3]. Exposure to loud noise has been implicated in both short- and long-term complications in neonates[3]. The American Academy of Pediatrics (AAP) recommends a sound limit below 45 dB in NICU[4]. The AAP also stated that the sound level should not exceed 50 dB for 10% of the measurement period, and the maximum sound level should not exceed 65 dB[5]. Hearing loss may result from high-intensity sounds damaging the cochlear cilia. Neonates are passive consumers of harmful noise which makes them more susceptible to its damaging effects[2]. Preterms are more vulnerable because of central nervous system immaturity and decreased autonomic and self-regulatory abilities, and exposure to loud sounds has been attributed to poor neurodevelopment and growth[2,3]. Hearing impairment is diagnosed in 2% to 10% of preterm infants, compared to 0.1% in the general pediatric population[3]. Although neonates benefit from noise reduction, it is not clear how to effectively lower the noise level in NICUs. A study by Mackenzie and Galbrun[6] in 2007 on noise reduction in hospitals estimated that up to 60% of the noises could be avoidable. Recent evidence shows that educational training, environmental modifications, and the implementation of quiet hours significantly impact noise reduction[1,7,8]. High-level sound exposure was shown to increase blood pressure, hypoxic episodes, apnea, bradycardia, disturbed sleep, muscle tone, and intracranial pressure. It also influenced the neuroendocrine and immune systems[1,5,8]. Increased oxygen need and caloric consumption are also more pronounced in preterms[2]. Infants cannot self-stabilize, which can have a lasting impact on neurological development that results in attention deficit, hearing disorders, speech and language disorders, and delays[8]. Thus, we conducted this study with the objectives of measuring the sound levels in our NICU and reducing ambient sound levels by at least 10% from baseline.
The study was conducted at the NICU, Department of Pediatrics at Subbaiah Institute of Medical Sciences (SUIMS), Shimoga, India. It is a 20-bed level 3 NICU with an open bay system. The patient care team consists of two main consultants, four residents, two interns, and twelve nurses. The nurses and residents work in shifts, with shift changes at 8 am and 8 pm.
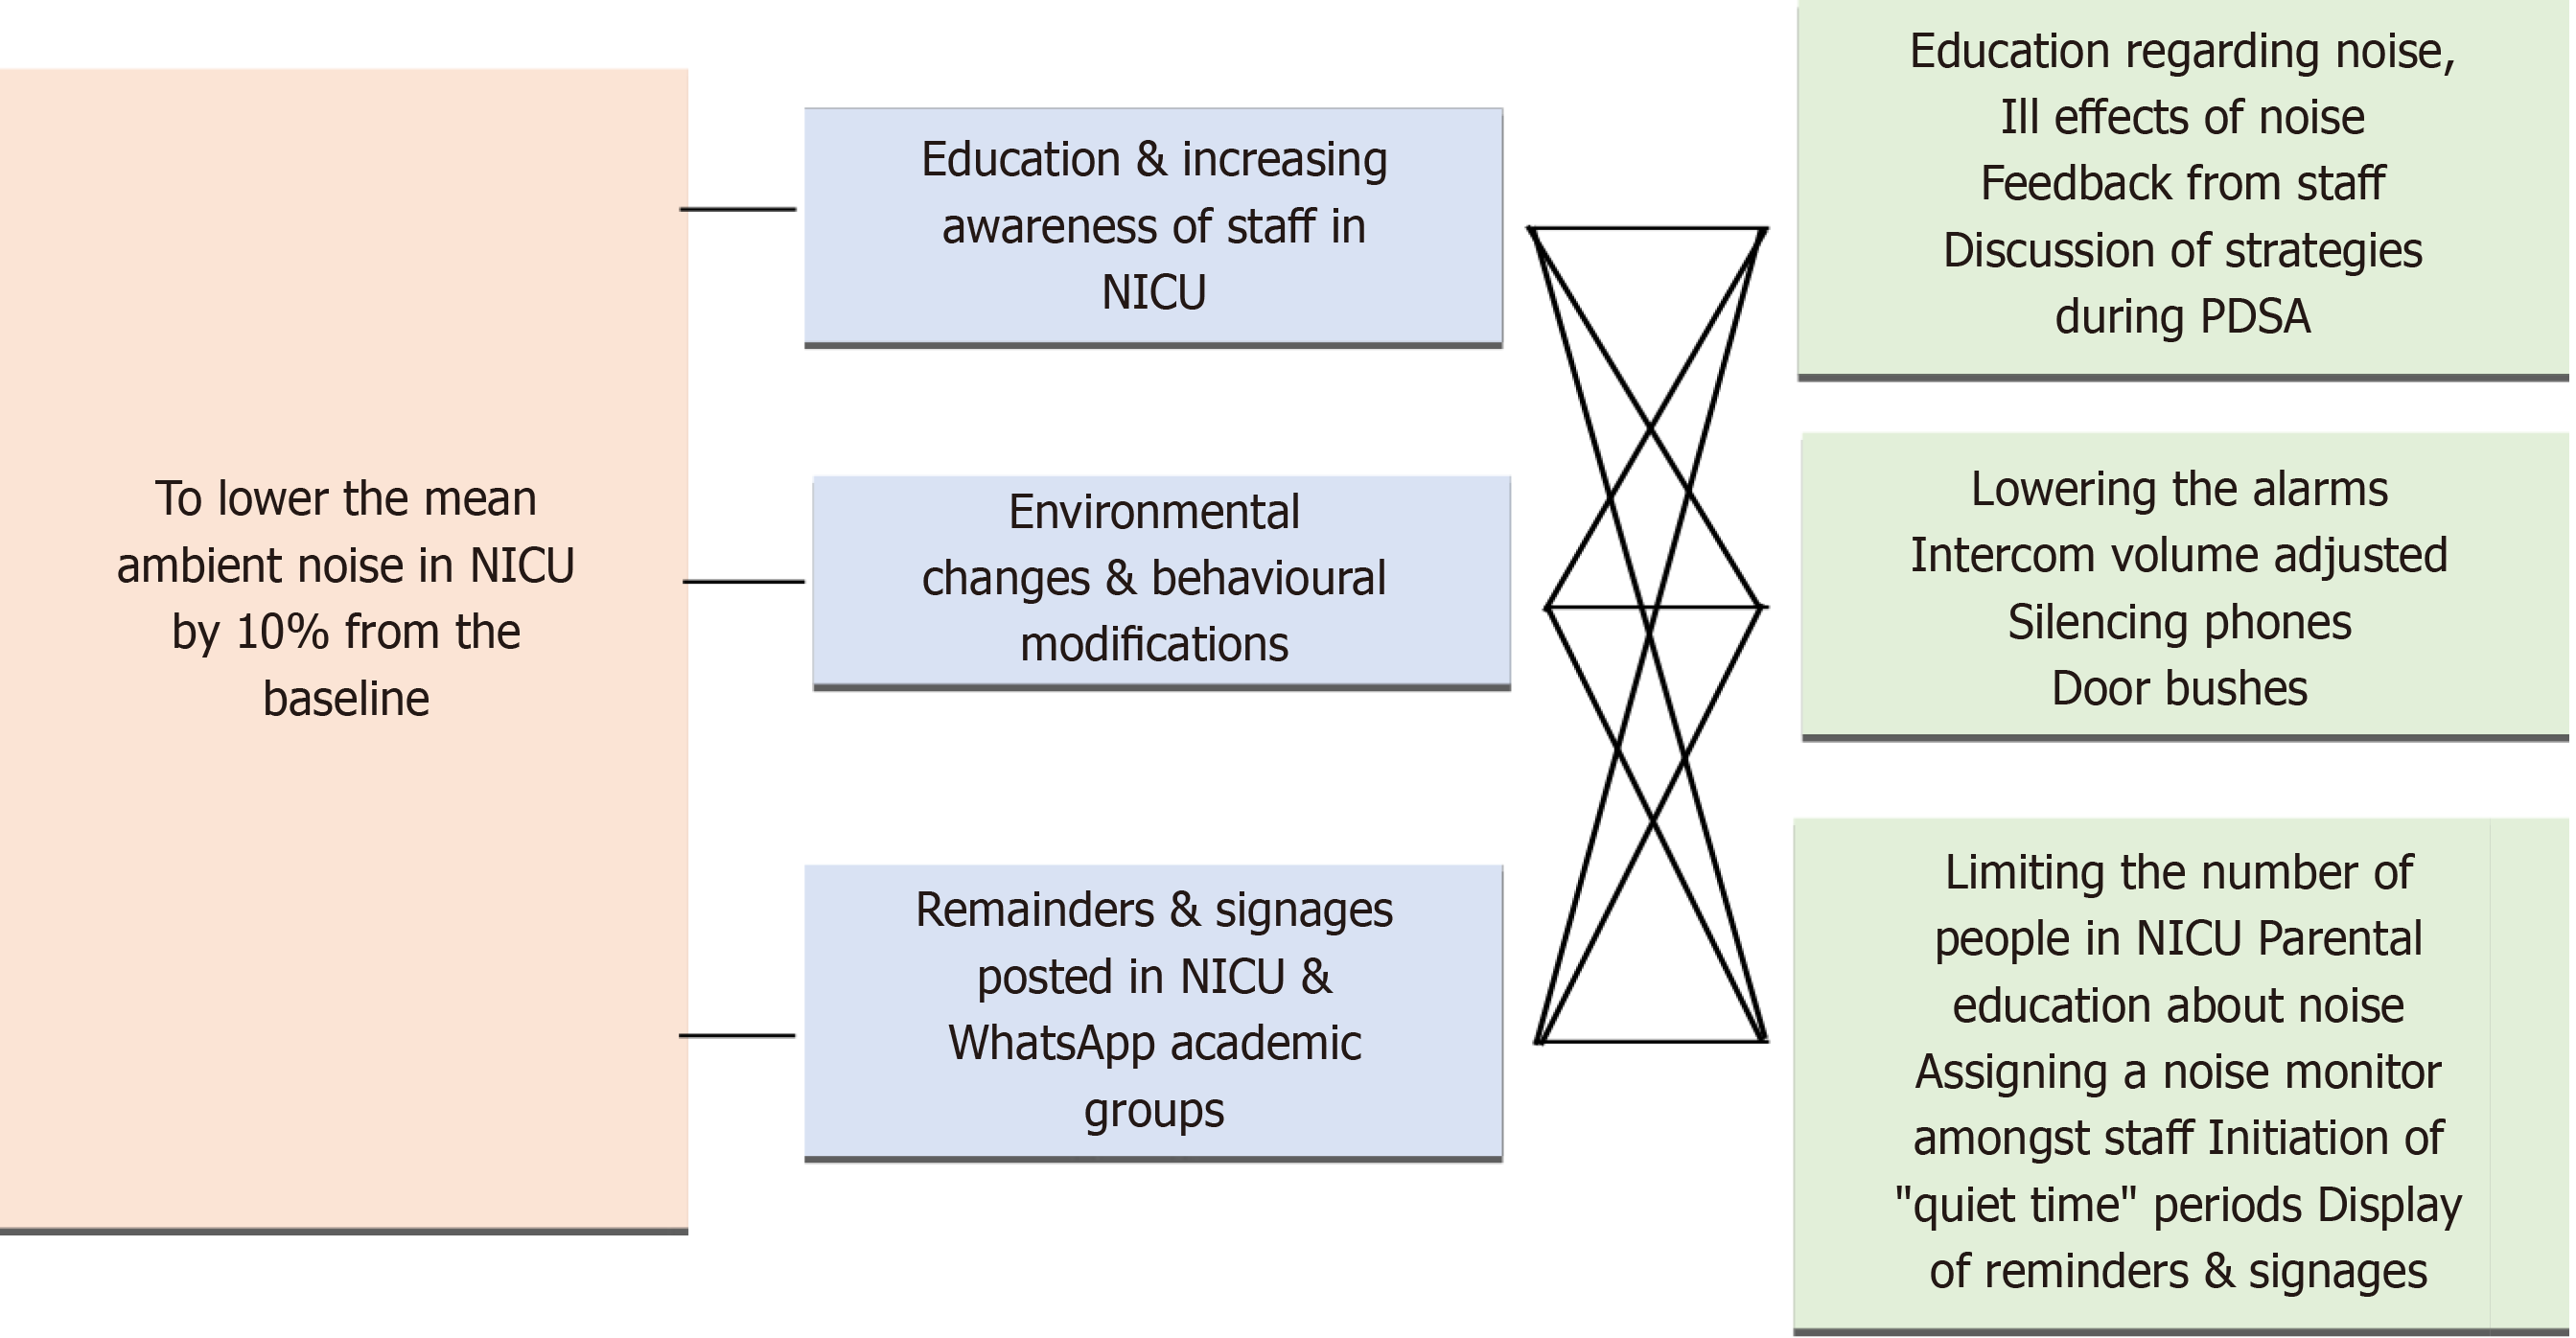
This quasi-experimental quality improvement initiative (QI) project was conducted over 4 mo, from December 9, 2023, to March 18, 2024, after obtaining ethical clearance from the Institutional Ethics Committee. We included all healthcare workers involved in caring for NICU babies, including SUIMS support staff working in the NICU, as well as caretakers of the neonates. Noise levels were recorded using a sound level meter (Mastech MS 6701 rs 232/data logger) with a range of 30-130 dB. Decibel readings were obtained continuously, with one reading recorded every 5 s from the NICU cubicle. The device was placed in the NICU, centrally located, and attached to a desktop. The device recorded data that was checked daily and saved in Excel format. NICU baseline mean noise level was obtained during morning and night shifts over 2 wk. The Institute for Healthcare Improvement model for improvement was used as the framework for this project, and interventions were tested using rapid Plan-Do-Study-Act (PDSA) cycles. A multifaceted intervention strategy was applied. The first PDSA cycle of 2 wk consisted of targeted education of the healthcare providers, including nursing staff, consultants, residents, interns, support staff and patient caretakers. The patient caretakers were briefed in the local language, Kannada. Multiple short sessions were conducted on what noise is, its sources, the ill effects of noise, and ways of reducing it. Following the first cycle, the sound was recorded for 1 wk. The second PDSA cycle of 2 wk consisted of environmental modifications like changing alarm settings, placing reminder signs to maintain silence and silencing the mobile, etc, both in English and Kannada, and implementation of a quiet period of one h per day between 8 am and 9 am. Following the second cycle, the sound was recorded for 1 wk. The third PDSA cycle of 2 wk included increasing the quiet period to 2 h per day, from 8 am to 9 am and 7 pm to 8 pm. A departmental policy was implemented to ensure that handovers and discussions during rounds were made away from the main cubicle. Additionally, a limit was placed on the number of people allowed inside the NICU at any time until 10. The security guard at the entrance was given a register to make a note of the 11th person entering the NICU, and we addressed them. One consultant, two residents and one nurse were chosen as spies to ensure adherence to regular feedback. During these cycles, weekly feedback on the mean noise level was provided to the healthcare team. A power point presentation was done in the classroom before starting each PDSA cycle to introduce the cycle and allow questions about doubts and to give feedback. The newborn caretakers were also addressed in a way that was appropriate to their understanding. The mean noise levels during the day and night shifts and peak noise levels were calculated during each PDSA cycle. The average noise levels were calculated for 2 wk after three PDSA cycles. Regular reminder messages using WhatsApp were sent to the healthcare team. The standards for quality improvement reporting excellence 2.0 guidelines for reporting were followed. The key drivers of our study are shown in Figure 1.
Descriptive statistics were used to summarize the weekly noise levels and peak noise measurements recorded throughout the study period. Weekly mean noise levels and peak noise levels were calculated for both day and night shifts, providing an overview of the ambient noise environment within the NICU.
Control chart analysis was employed to visually represent the mean noise level over time [1]. Control charts are essential for understanding and communicating data in healthcare improvement efforts. They are statistically rigorous and user-friendly, enabling researchers to make data-driven decisions in quality improvement studies[9]. Statistical process control charts, generated using QI Macros software (Know Ware International, Inc., Denver, CO, United States), were used to monitor changes in noise level and identify any significant shifts or trends. Control limits, including the upper control limit (UCL) and lower control limits (LCL), representing three standard deviations above and below the average, and the upper warning limit (UWL) and lower warning limit (LWL), representing two standard deviations above and below the average noise, respectively, were calculated to establish boundaries within which noise levels were expected to fluctuate under normal process conditions.
Comparison of baseline noise levels and those observed during and after the implementation of intervention cycles was conducted to assess the effectiveness of noise reduction strategies. The paired t-test was used to determine the significance of any observed changes in noise level after the PDSA cycles. A significance level of = 0.05 was adopted to evaluate statistical significance. All data were analyzed with SPSS, version 29.0 (IBM Corp., Armonk, NY, United States).
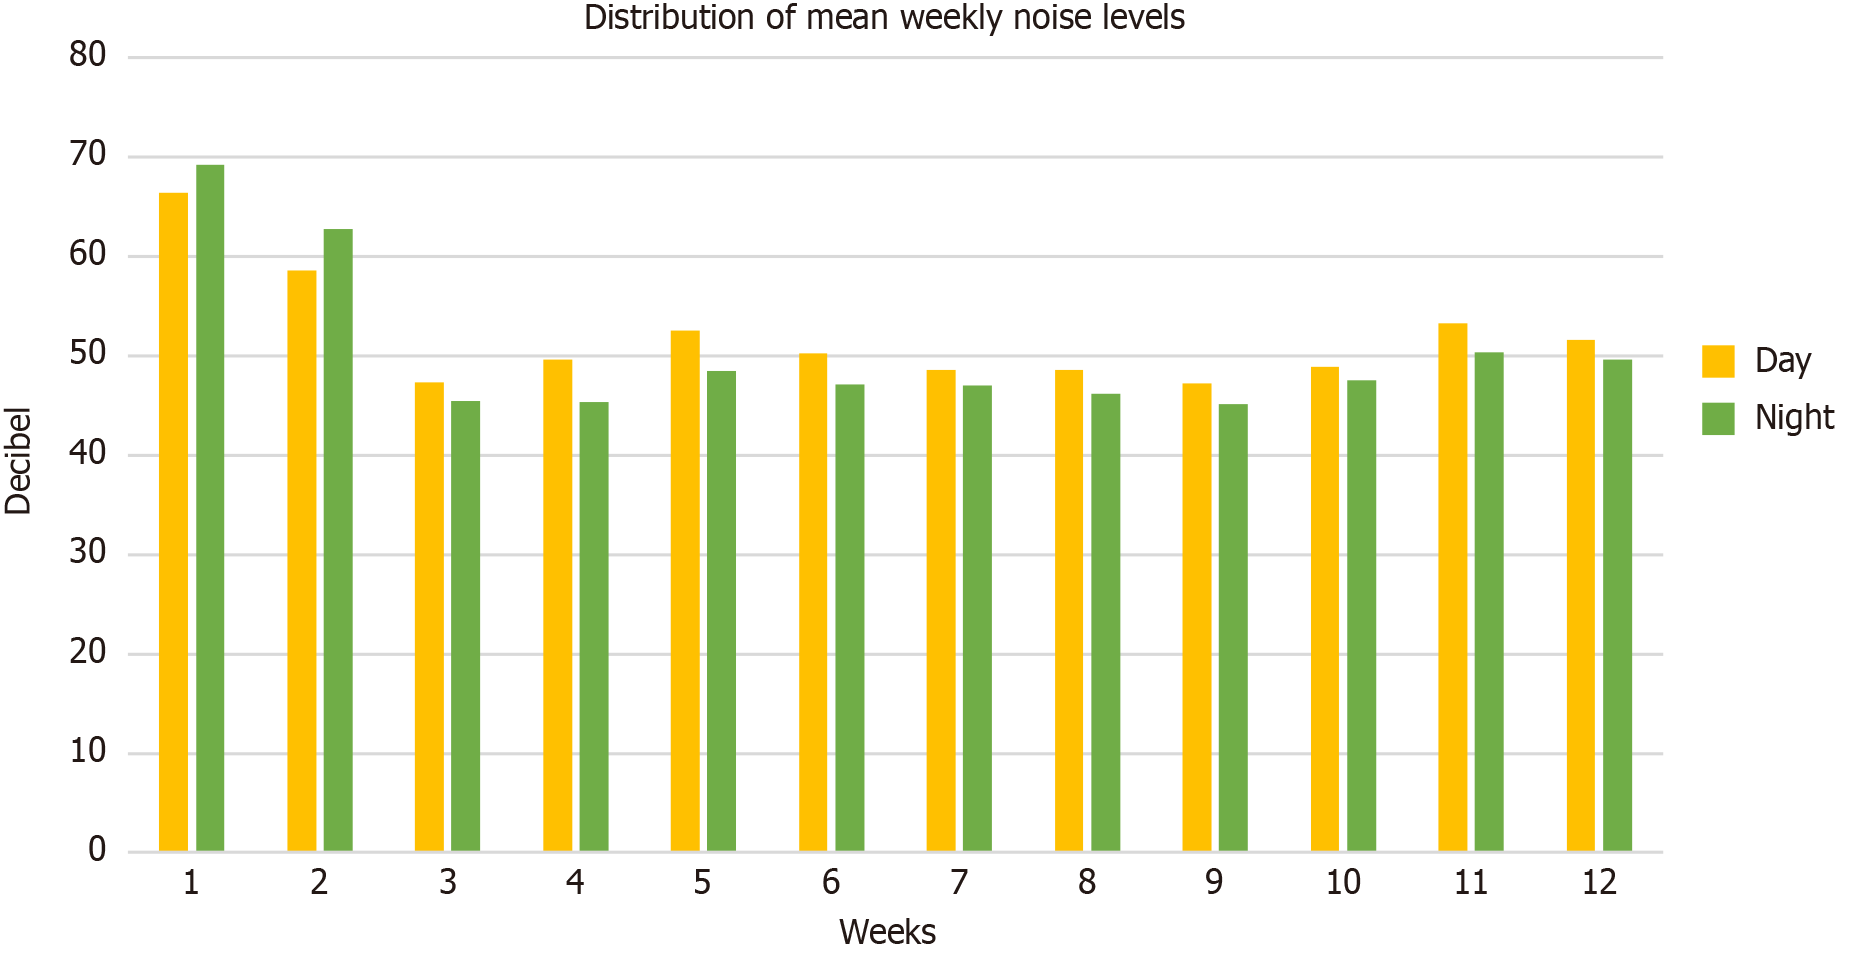
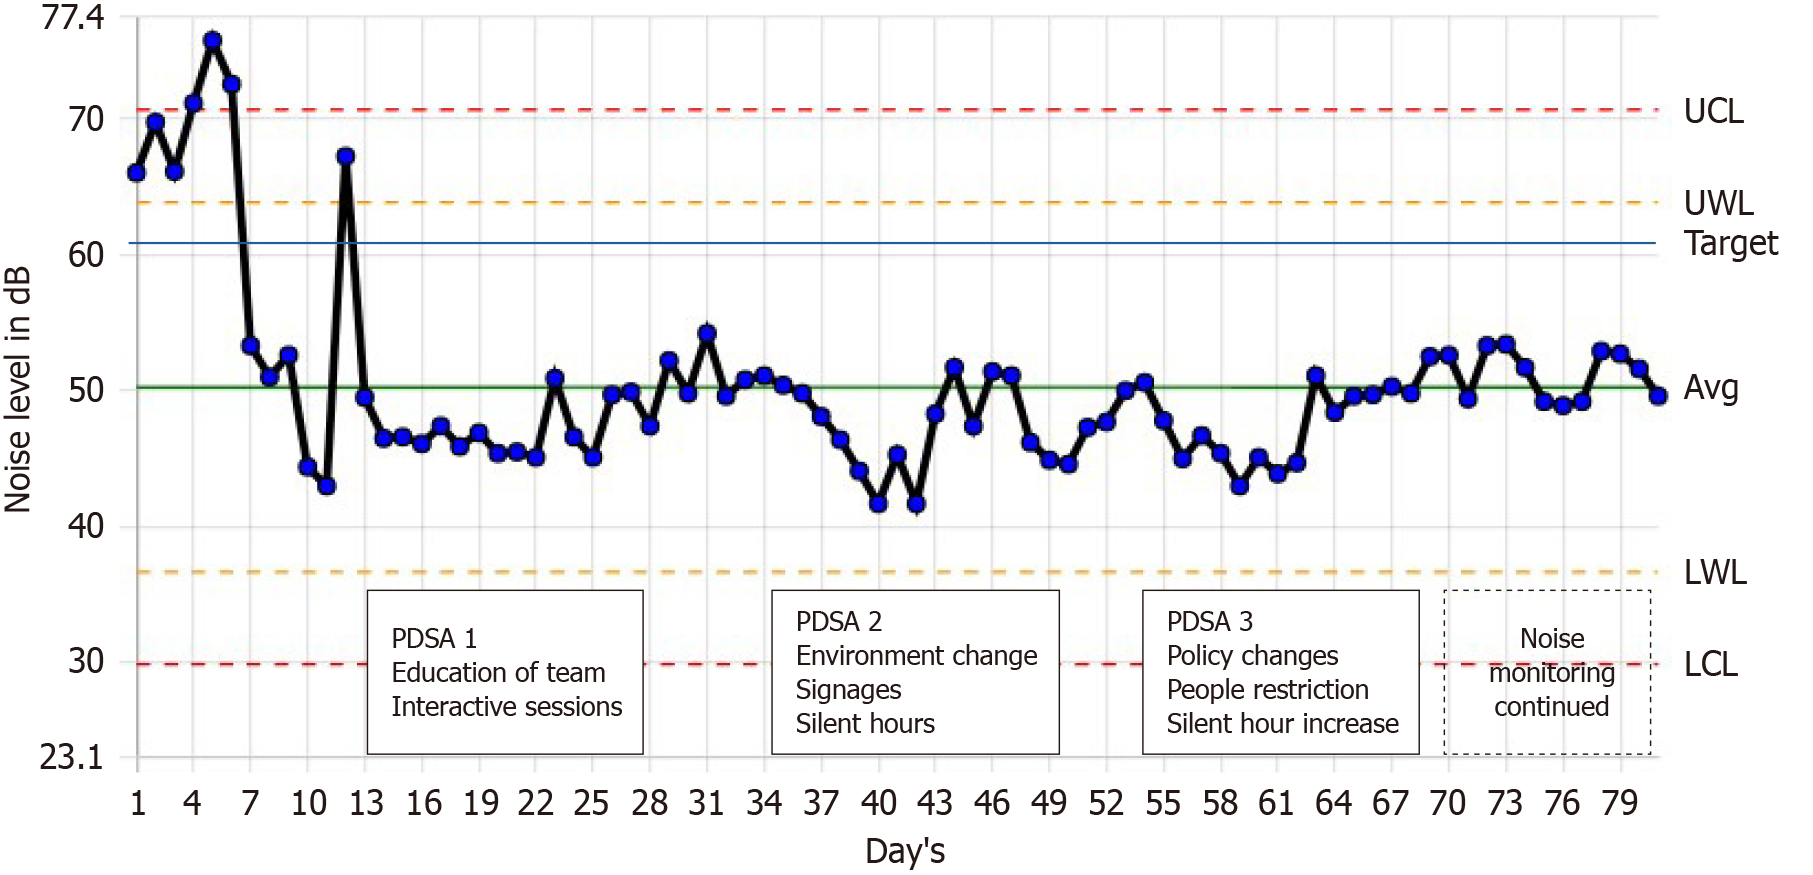
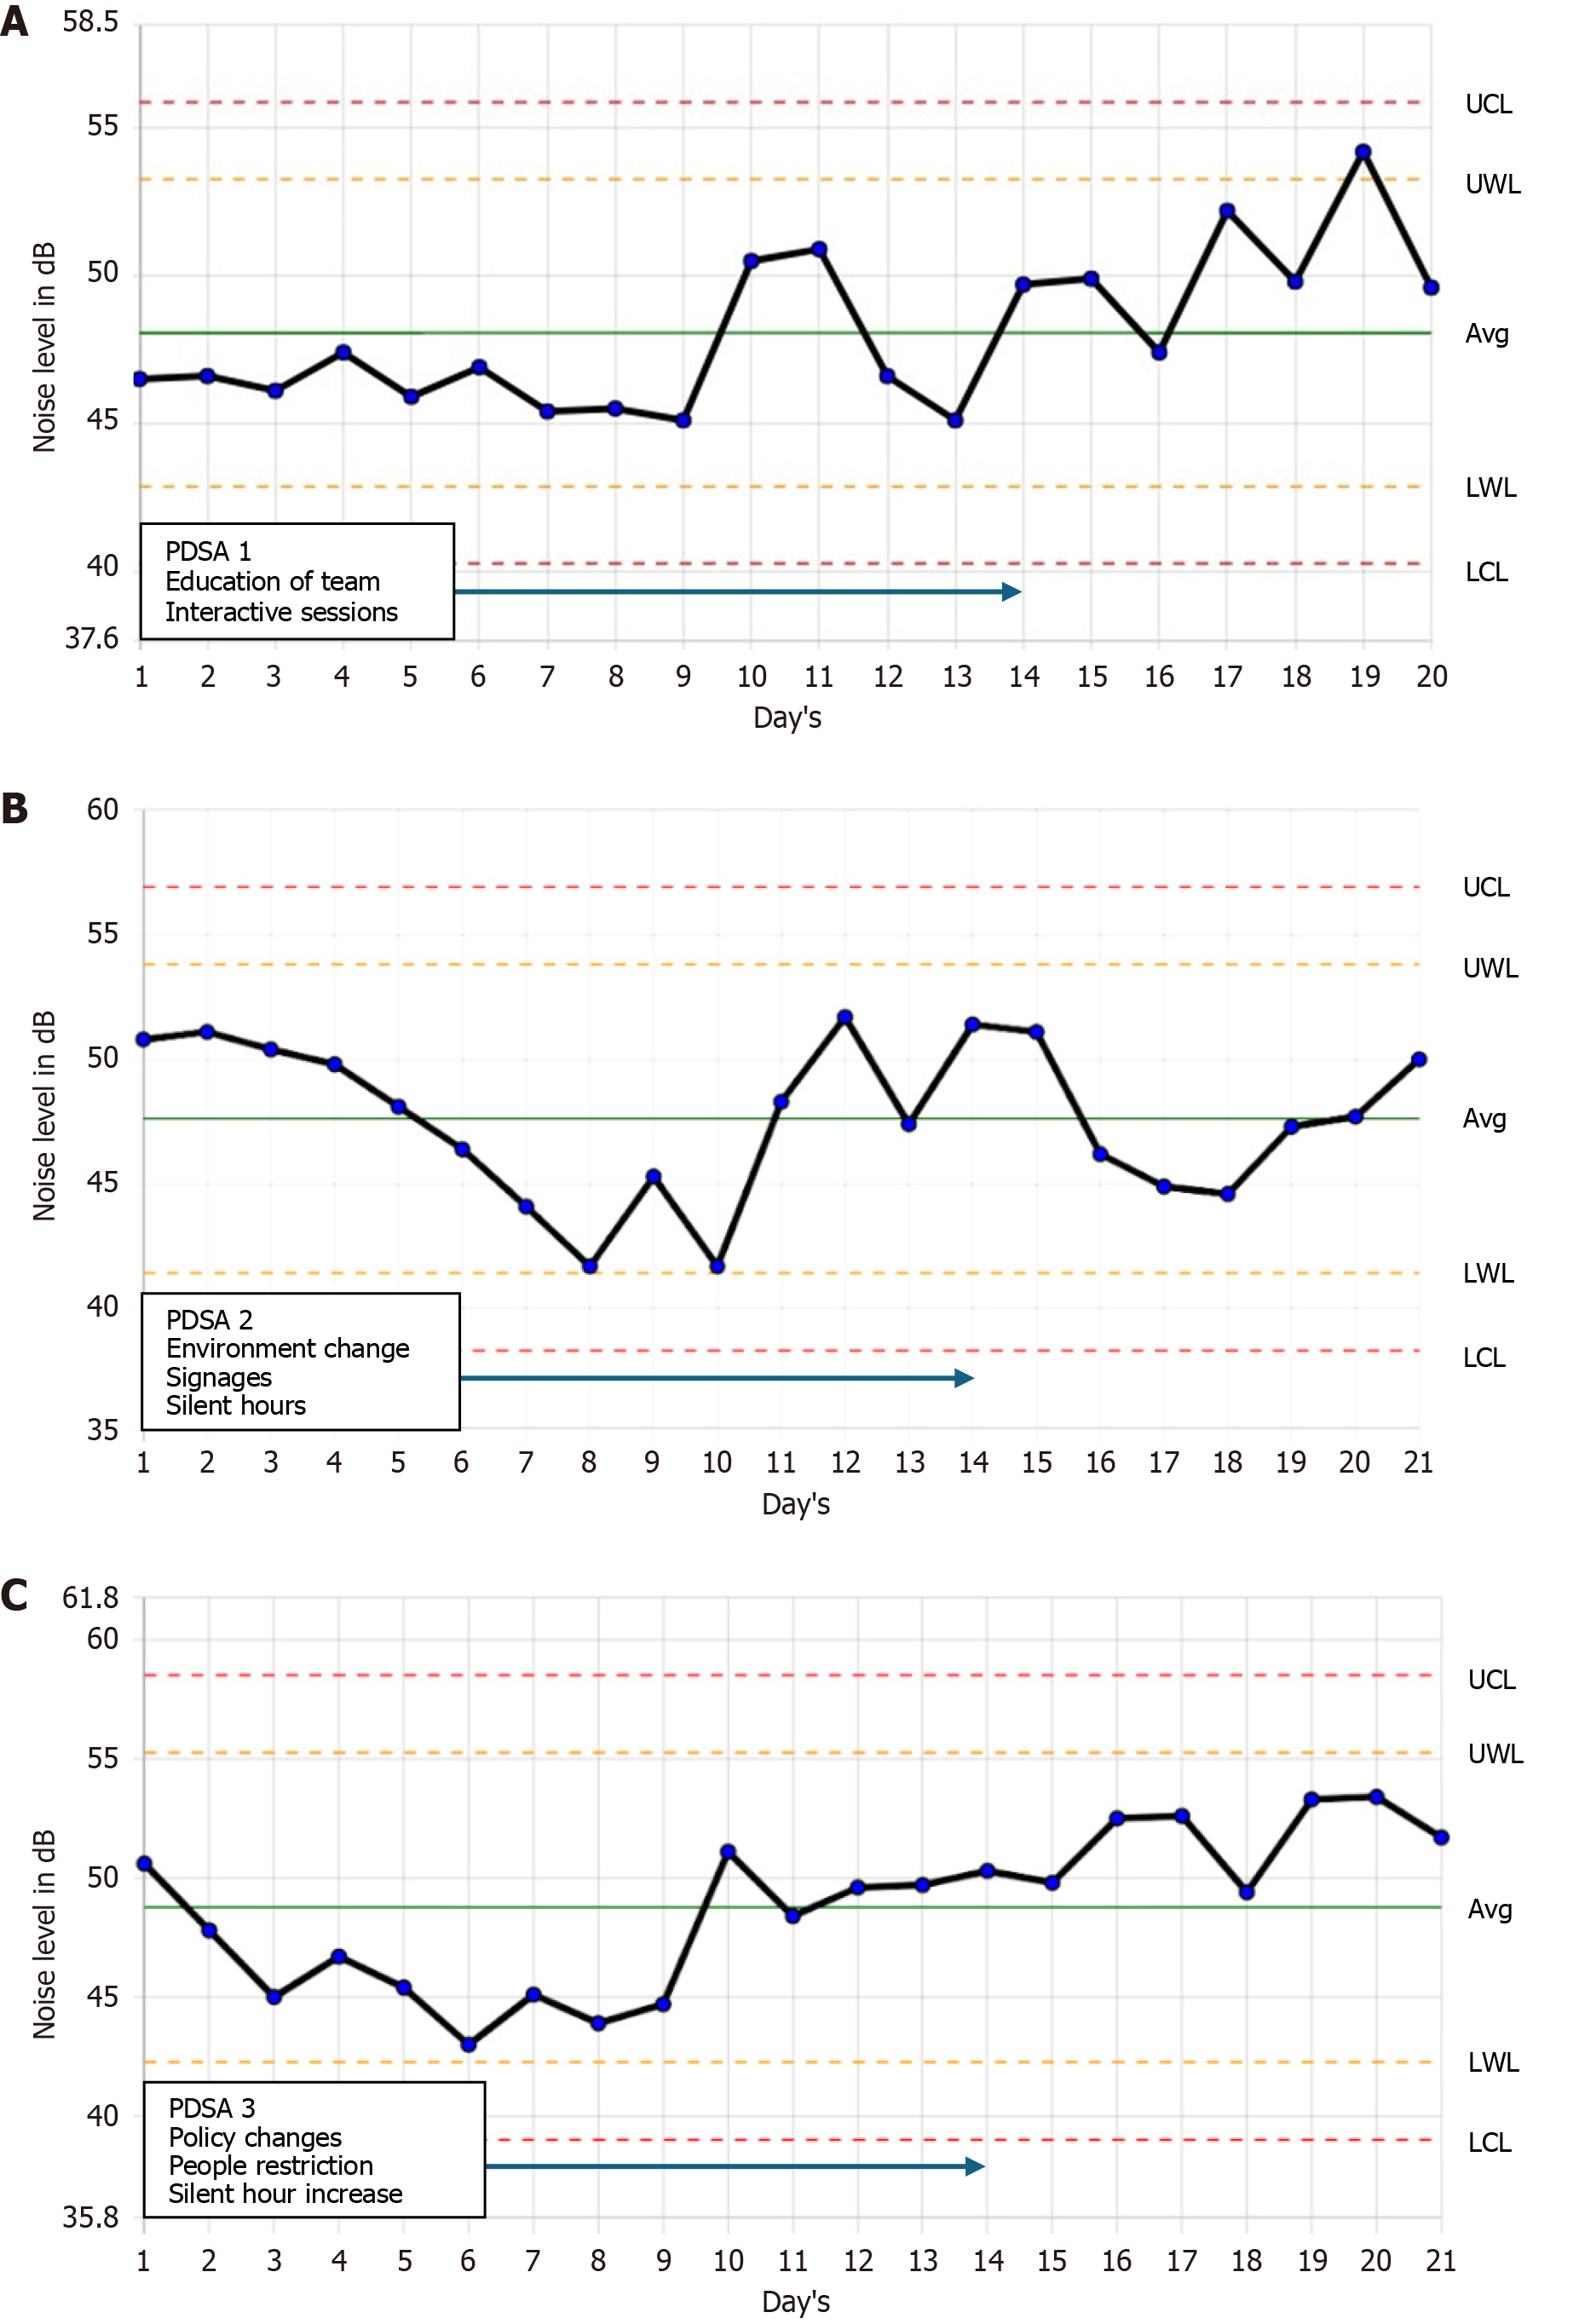
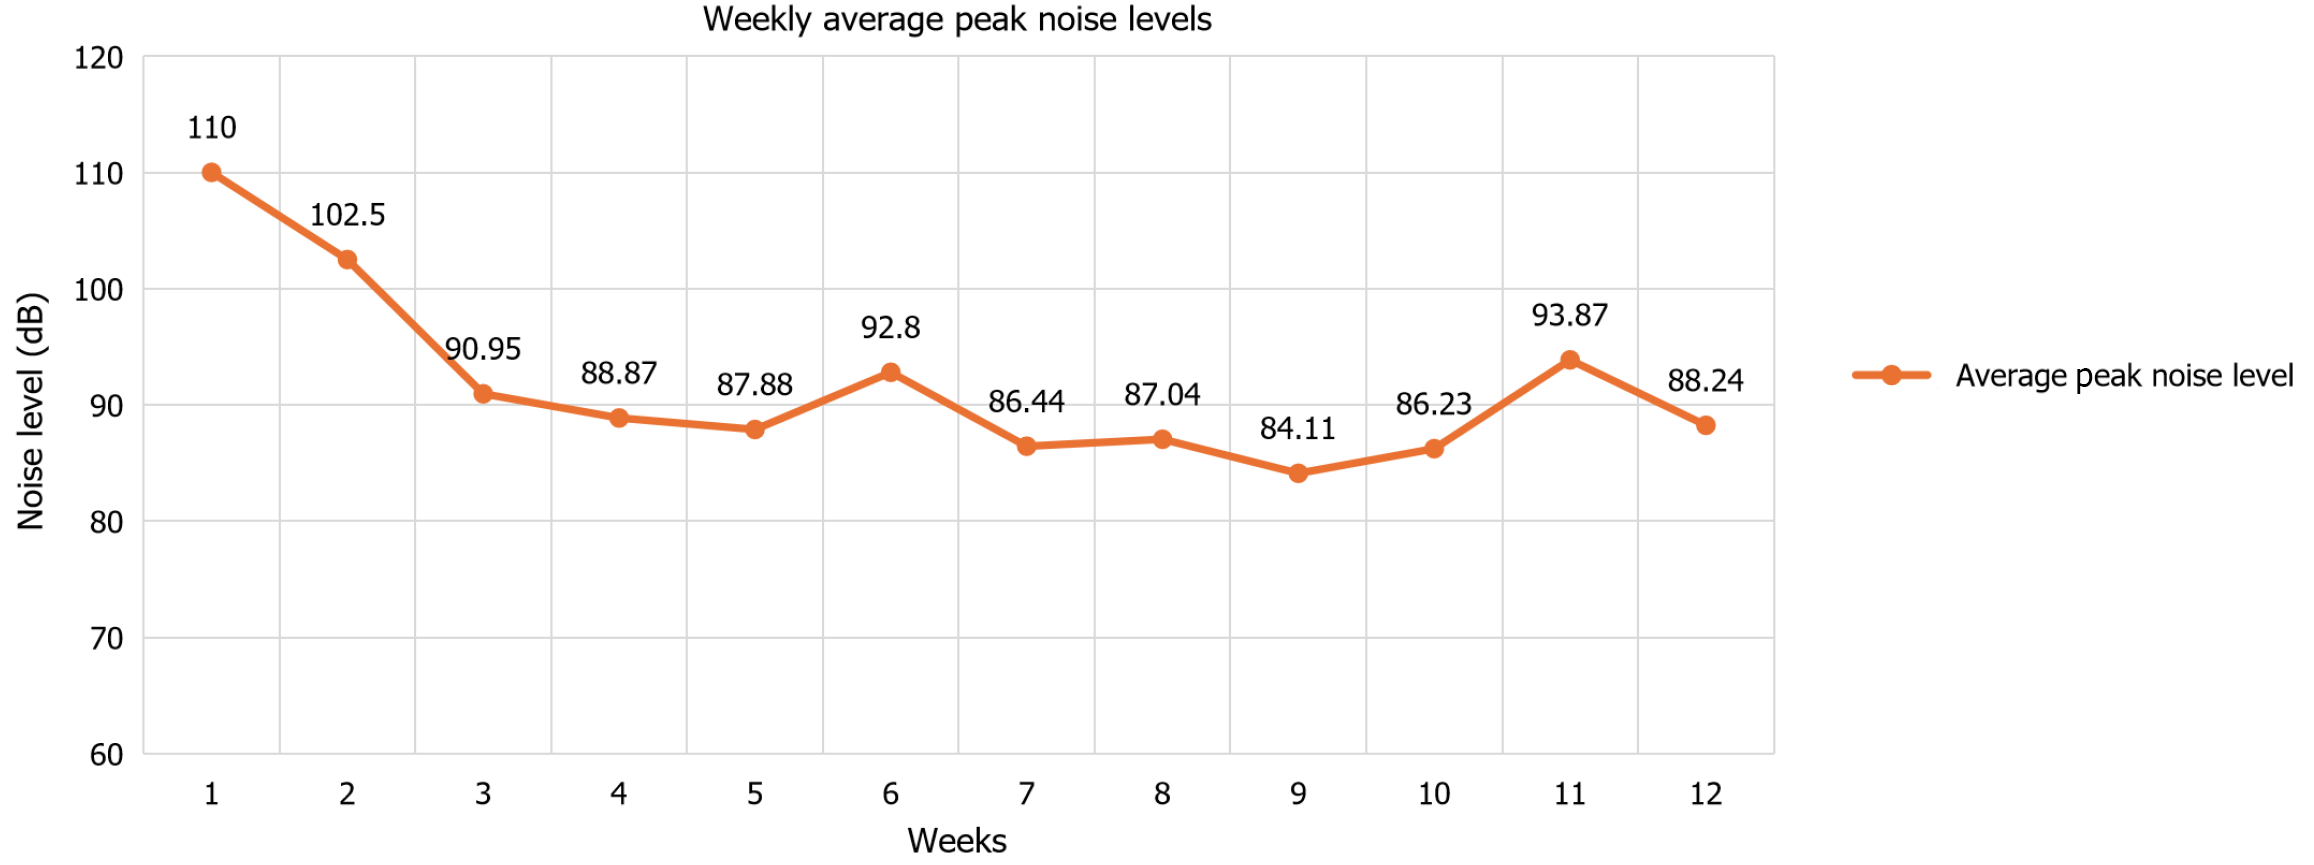
The baseline mean ambient noise level in the NICU was 66.4 dB during the day and 69.2 dB at night, with a 24 h average of 67.8 dB. At the end of the first PDSA cycle, the mean noise levels were 52.6 dB in the day and 48.5 dB at night with a 24 h average of 50.5 dB. At the end of the second cycle, the mean noise levels were 48.6 dB during the day and 46.2 dB at night with a 24 h average of 47.4 dB. At the end of the third cycle, the day and night mean noise levels were 53.3 dB and 50.4 dB, respectively at the end of 1 wk, and 52.4 dB and 50 dB at the end of 2 wk. The 24 h average noise level was 51.2 dB at the end of 2 wk after the third PDSA cycle (Figure 2). With the implementation of interventions in successive PDSA cycles, the mean noise levels in the NICU decreased from baseline by 21% during the day and by 28% at night, with a 24 h reduction of 25% at the end of three cycles. Successive noise reductions were achieved over 4 mo (Figure 3). From the control charts during the first PDSA cycle, it can be seen that the noise levels were within the UCL and LCL. However, during the last few days of the post-PDSA monitoring wk, the noise was noted to cross the UWL (Figure 4A). During the second PDSA cycle, the noise levels were noted to hit the LWL twice, but afterward it remained within the UWL and LWL (Figure 4B). In the third PDSA cycle, the noise level was well within the UWL and LWL, including the monitoring wk post-PDSA cycle (Figure 4C). Significant reductions in noise levels were observed after PDSA 1 (mean difference = −17.3 dB, P = 0.00054) and from Baseline to PDSA 2 (mean difference = −20.4 dB, P < 0.001). However, the change from PDSA 1 to PDSA 2 was not statistically significant (mean difference −3.1 dB, P = 0.053). Notably, there was a significant increase in noise level from PDSA 2 to PDSA 3 (mean difference 4.4 dB, P = 0.0097), resulting in a net reduction from Baseline to PDSA 3 (mean difference = −15.9 dB, P = 0.001) (Table 1). The noise peaks also decreased from 110 dB in the baseline period to 88.24 dB at the end of three PDSA cycles (Figure 5). The most significant drop in the peak noise level was noted during the first PDSA cycle, after which the peak noise levels stabilized, and no further drop was noted.
The 24 h average baseline noise level in our NICU was 67.8 dB, which decreased to 50.5 dB after our first cycle and to 47.4 dB and 51.2 dB after the next two cycles. There was a significant reduction after the first cycle but little change in subsequent cycles. This QI initiative resulted in a 24 h average noise reduction of 25% over 4 mo. The peak noise level decreased by 17% from baseline. The most substantial change occurred during the initial PDSA cycle, indicating the effectiveness of targeted education and early environmental modifications.
This result was achieved with a multifaceted intervention strategy including targeted education sessions for healthcare providers and caretakers, environmental modifications such as adjusting alarm settings and implementing quiet periods, and organizational changes to limit the number of individuals in the NICU at any given time. These interventions were implemented progressively over three PDSA cycles, with weekly feedback from the healthcare team.
We employed continuous monitoring of noise levels using a sound level meter and implemented the Institute for Healthcare Improvement model for improvement as our framework. Ahamed et al[1], used targeted education, behavioral, and environmental modifications to decrease the noise level in their NICU over 4 PDSA cycles. Similar quality improvement initiatives were used by Chawla et al[7], who achieved a 20% reduction from baseline noise level. A pilot project over a shorter 11 wk period found a 13.7% reduction in noise levels using education and silent hour implementation[8].
Accurate sound estimation requires a class 1 or 2 device, but considering financial constraints, we used a Mastech (MS 6701 rs 232/data logger) sound level meter, which has a rating of IEC 651 and the ANSI S1.4 type 2 American standard for sound level meter performance, which has been used earlier[10,11].
During the targeted education sessions, we were surprised to learn that our nursing staff was unaware of the ill effects of noise. Their active participation in asking questions helped us. We also gathered some valid inputs from the senior faculty, who helped us plan the study.
Our study underscores the importance of implementing comprehensive interventions to address noise pollution in the NICU setting. By involving various stakeholders and using iterative improvement cycles, we successfully achieved our aim of reducing noise levels within the NICU. Moreover, our findings suggest that sustained efforts and ongoing monitoring are essential for maintaining optimal noise levels and ensuring the well-being of neonates in intensive care settings.
In addition to noise reduction, our study also helped with team building and coordination among the stakeholders, especially the nursing staff and residents.
Our study has some limitations. We did not assess the impact of noise reduction on clinical outcomes. The noise meter was placed only in the main NICU cubicle, and because of technical reasons, it was not rotated between the out born NICU areas. We had no control over the biomedical team visiting for equipment checks, which led to noise. Hospital renovation work adjacent to the NICU area led to increased peak levels during the 11th wk of our study. Owing to a technical issue, we lost data for 1 d during the first PDSA cycle. Because of the Hawthorne effect, it was noted that during data collection times, the staff would become hypervigilant. This bias was limited by continuous sound monitoring over 24 h. Though we achieved our target of a 10% reduction in noise level, we were far from reaching the AAP recommenda
Our study demonstrates the feasibility and effectiveness of implementing a multifaceted intervention strategy to reduce noise levels within the NICU. By addressing this critical issue, we aim to improve the quality of care and enhance outcomes for preterm infants undergoing intensive medical treatment.
We thank Dr. Sandeep G for his valuable contributions in data collection and equipment handling. Dr. Vinayaka G, Dr. Vikram S Kumar, and Dr. Manjunathaswamy R for their valuable insights and support.
| 1. | Ahamed MF, Campbell D, Horan S, Rosen O. Noise Reduction in the Neonatal Intensive Care Unit: A Quality Improvement Initiative. Am J Med Qual. 2018;33:177-184. [RCA] [PubMed] [DOI] [Full Text] [Cited by in Crossref: 13] [Cited by in RCA: 17] [Article Influence: 1.9] [Reference Citation Analysis (0)] |
| 2. | Thakur N, Batra P, Gupta P. Noise as a Health Hazard for Children, Time to Make a Noise about it. Indian Pediatr. 2016;53:111-114. [RCA] [PubMed] [DOI] [Full Text] [Cited by in Crossref: 4] [Cited by in RCA: 4] [Article Influence: 0.4] [Reference Citation Analysis (0)] |
| 3. | Almadhoob A, Ohlsson A. Sound reduction management in the neonatal intensive care unit for preterm or very low birth weight infants. Cochrane Database Syst Rev. 2020;1:CD010333. [RCA] [PubMed] [DOI] [Full Text] [Cited by in Crossref: 24] [Cited by in RCA: 39] [Article Influence: 6.5] [Reference Citation Analysis (0)] |
| 4. | Committee on Environmental Health. Noise: A Hazard for the Fetus and Newborn. Pediatrics. 1997;100:724-727. [RCA] [DOI] [Full Text] [Cited by in Crossref: 350] [Cited by in RCA: 321] [Article Influence: 11.1] [Reference Citation Analysis (0)] |
| 5. | Parra J, de Suremain A, Berne Audeoud F, Ego A, Debillon T. Sound levels in a neonatal intensive care unit significantly exceeded recommendations, especially inside incubators. Acta Paediatr. 2017;106:1909-1914. [RCA] [PubMed] [DOI] [Full Text] [Cited by in Crossref: 17] [Cited by in RCA: 29] [Article Influence: 3.2] [Reference Citation Analysis (0)] |
| 6. | Mackenzie D, Galbrun L. Noise levels and noise sources in acute care hospital wards. Build Serv Eng Res Technol. 2007;28:117-131. [DOI] [Full Text] |
| 7. | Chawla S, Barach P, Dwaihy M, Kamat D, Shankaran S, Panaitescu B, Wang B, Natarajan G. A targeted noise reduction observational study for reducing noise in a neonatal intensive unit. J Perinatol. 2017;37:1060-1064. [RCA] [PubMed] [DOI] [Full Text] [Cited by in Crossref: 18] [Cited by in RCA: 23] [Article Influence: 2.6] [Reference Citation Analysis (0)] |
| 8. | Hull W, Wright K. A Quality Improvement Pilot Project for Noise Reduction in the NICU. Adv Neonatal Care. 2023;23:401-408. [RCA] [PubMed] [DOI] [Full Text] [Cited by in Crossref: 1] [Cited by in RCA: 3] [Article Influence: 1.0] [Reference Citation Analysis (0)] |
| 9. | Benneyan JC, Lloyd RC, Plsek PE. Statistical process control as a tool for research and healthcare improvement. Qual Saf Health Care. 2003;12:458-464. [RCA] [PubMed] [DOI] [Full Text] [Cited by in Crossref: 643] [Cited by in RCA: 764] [Article Influence: 34.7] [Reference Citation Analysis (0)] |
| 10. | Joshi G, Tada N. Analysis of noise level in neonatal intensive care unit and post natal ward of a tertiary care hospital in an urban city. Int J Contemp Pediatr. 2016;. [RCA] [DOI] [Full Text] [Cited by in Crossref: 6] [Cited by in RCA: 6] [Article Influence: 0.6] [Reference Citation Analysis (0)] |
| 11. | Rangaswamy DR, Kamble N. Utility of Smartphone Application to Detect Noise in NICU. Indian J Pediatr. 2024;. [RCA] [PubMed] [DOI] [Full Text] [Reference Citation Analysis (0)] |


