Copyright
©The Author(s) 2017.
World J Clin Pediatr. Feb 8, 2017; 6(1): 81-88
Published online Feb 8, 2017. doi: 10.5409/wjcp.v6.i1.81
Published online Feb 8, 2017. doi: 10.5409/wjcp.v6.i1.81
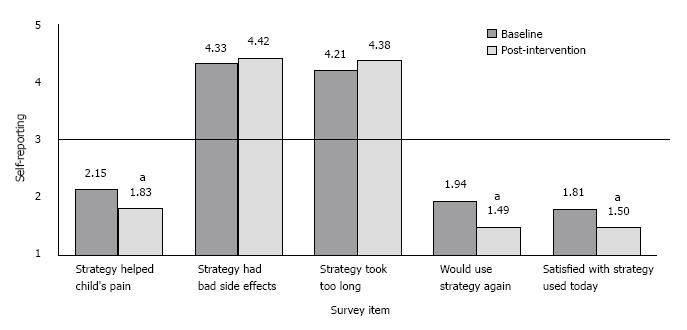
Figure 1 Comparison of parent/caregiver self-reported satisfaction with pain prevention strategies used at visit at baseline (n = 85) and at post-intervention follow up (n = 101) via parent/caregiver survey.
A value of 3 indicates the neutral point; scores above 3 indicate more concern/negative response about this area, while a value below 3 indicates less concern/more positive response. aP < 0.05 vs Baseline.
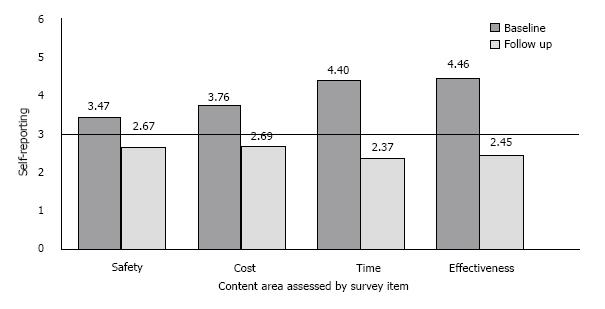
Figure 2 Comparison of parent/caregiver self-reported attitudes about pain prevention strategies for vaccination at baseline (n = 259) and at 1 year post-intervention follow up (n = 336) via parent/caregiver survey.
A value of 3 indicates the neutral point; scores above 3 indicate more concern about this area, while a value below 3 indicates less concern. All comparisons were significant at P < 0.05.
- Citation: Schurman JV, Deacy AD, Johnson RJ, Parker J, Williams K, Wallace D, Connelly M, Anson L, Mroczka K. Using quality improvement methods to increase use of pain prevention strategies for childhood vaccination. World J Clin Pediatr 2017; 6(1): 81-88
- URL: https://www.wjgnet.com/2219-2808/full/v6/i1/81.htm
- DOI: https://dx.doi.org/10.5409/wjcp.v6.i1.81


