
















Copyright: ©Author(s) 2026.
World J Clin Pediatr. Dec 9, 2026; 15(4): 120832
Published online Dec 9, 2026. doi: 10.5409/wjcp.120832
Published online Dec 9, 2026. doi: 10.5409/wjcp.120832
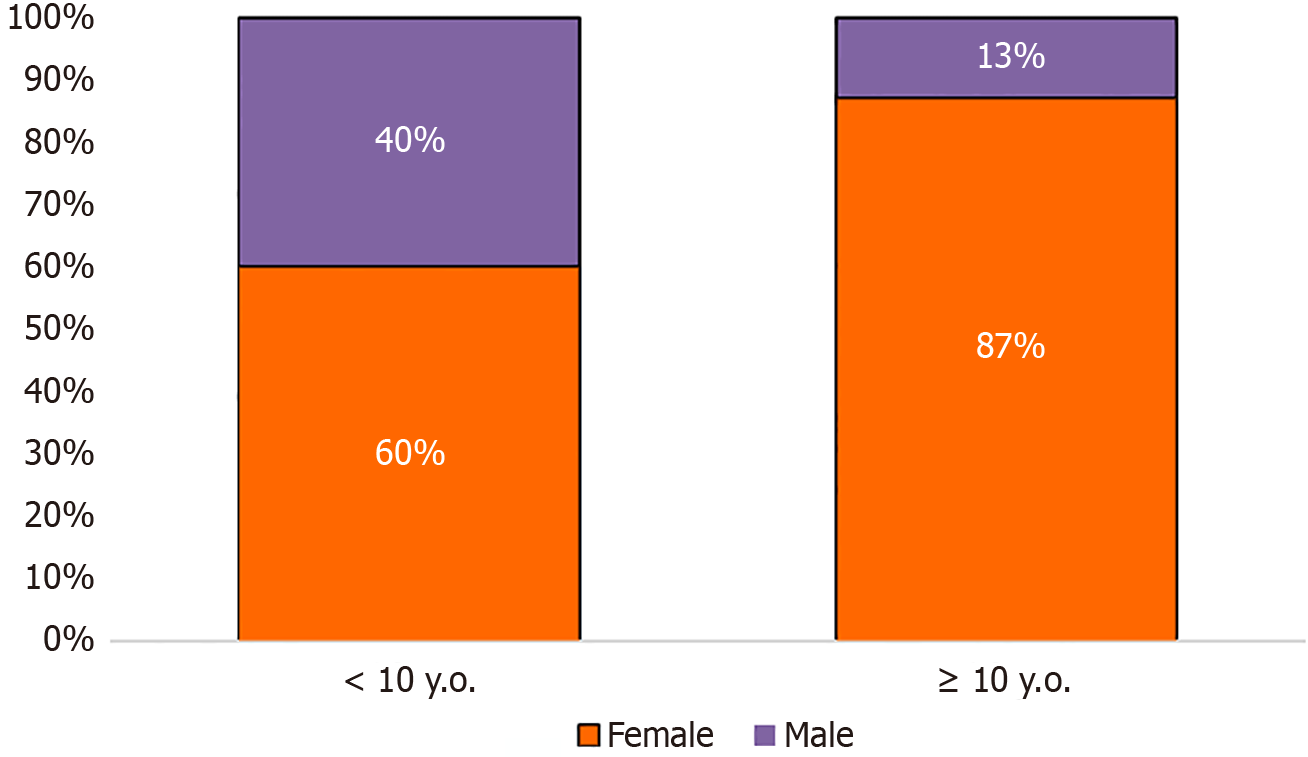
Figure 1 Gender distribution in the younger (< 10 years) and older (≥ 10 years) age groups.
P = 0.016 (Fisher’s exact test).
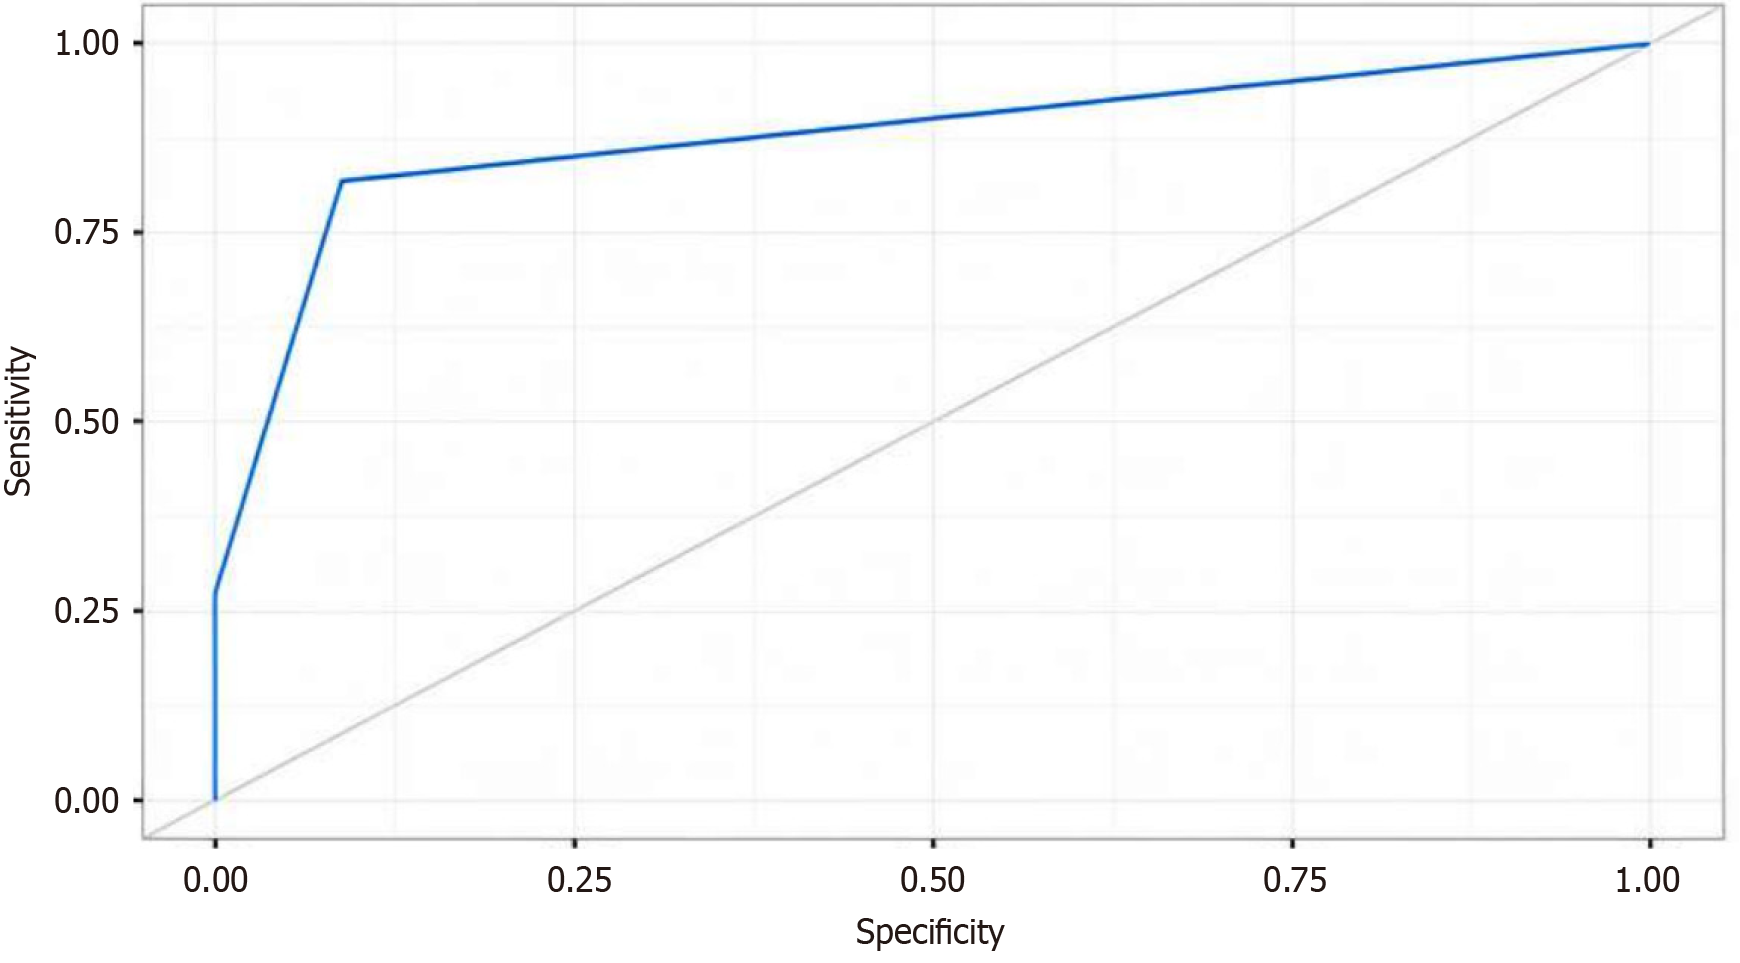
Figure 2 Receiver operating characteristic curve for the number of surgical interventions as a predictor of early-onset Takayasu arteritis (≤ 10 years).
Area under the curve = 0.877 (95%CI: 0.738-1.000).
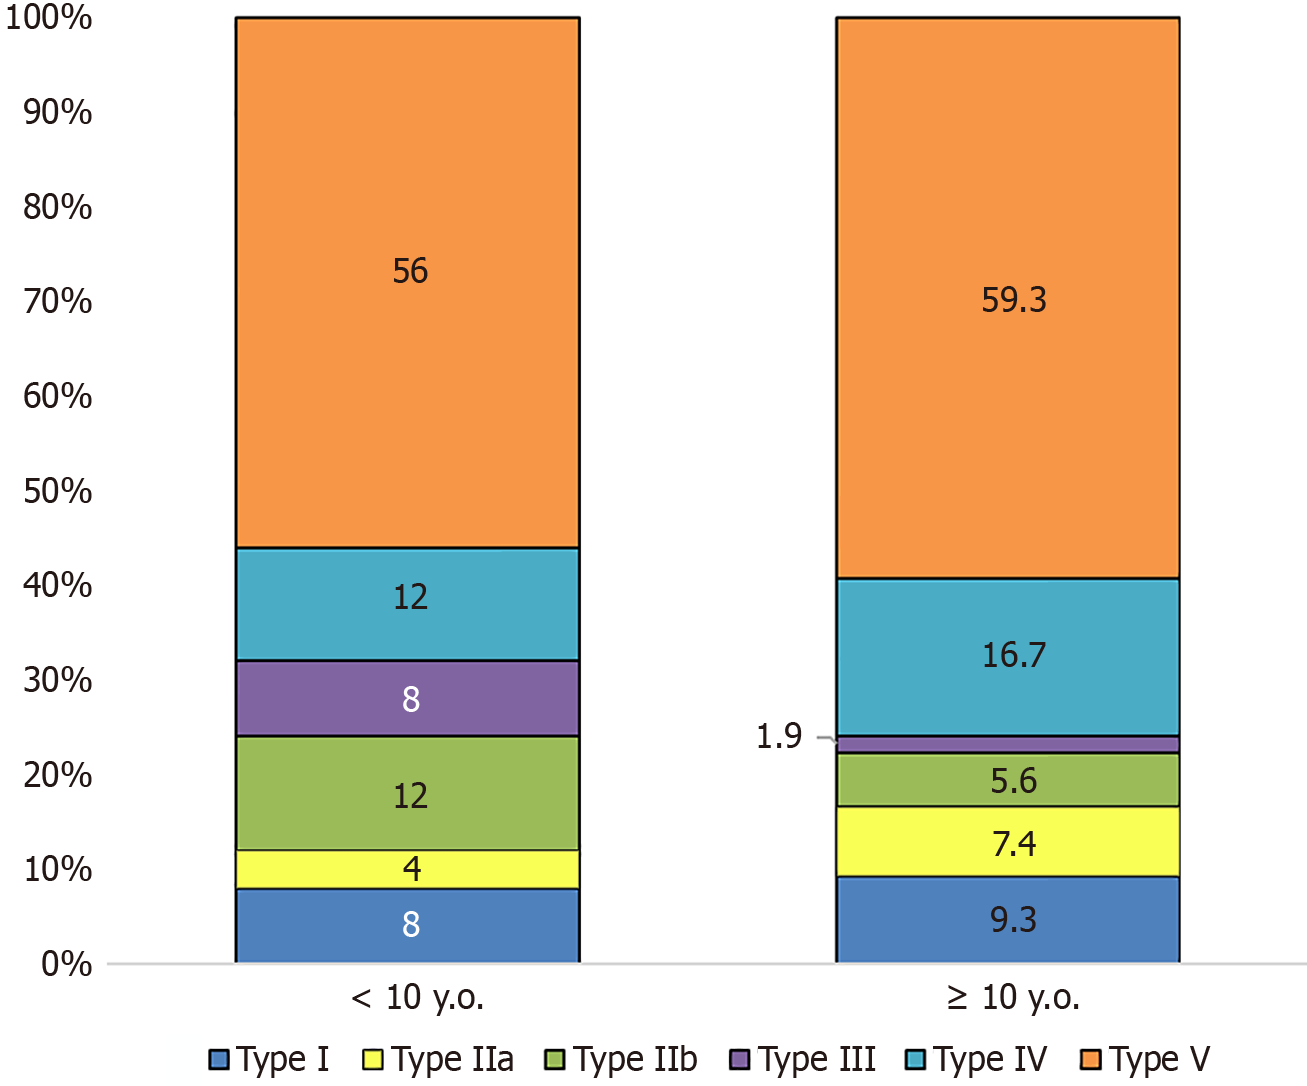
Figure 3
Distribution of angiographic types (Hata classification[25]) in patients with childhood-onset Takayasu arteritis, stratified by age group.
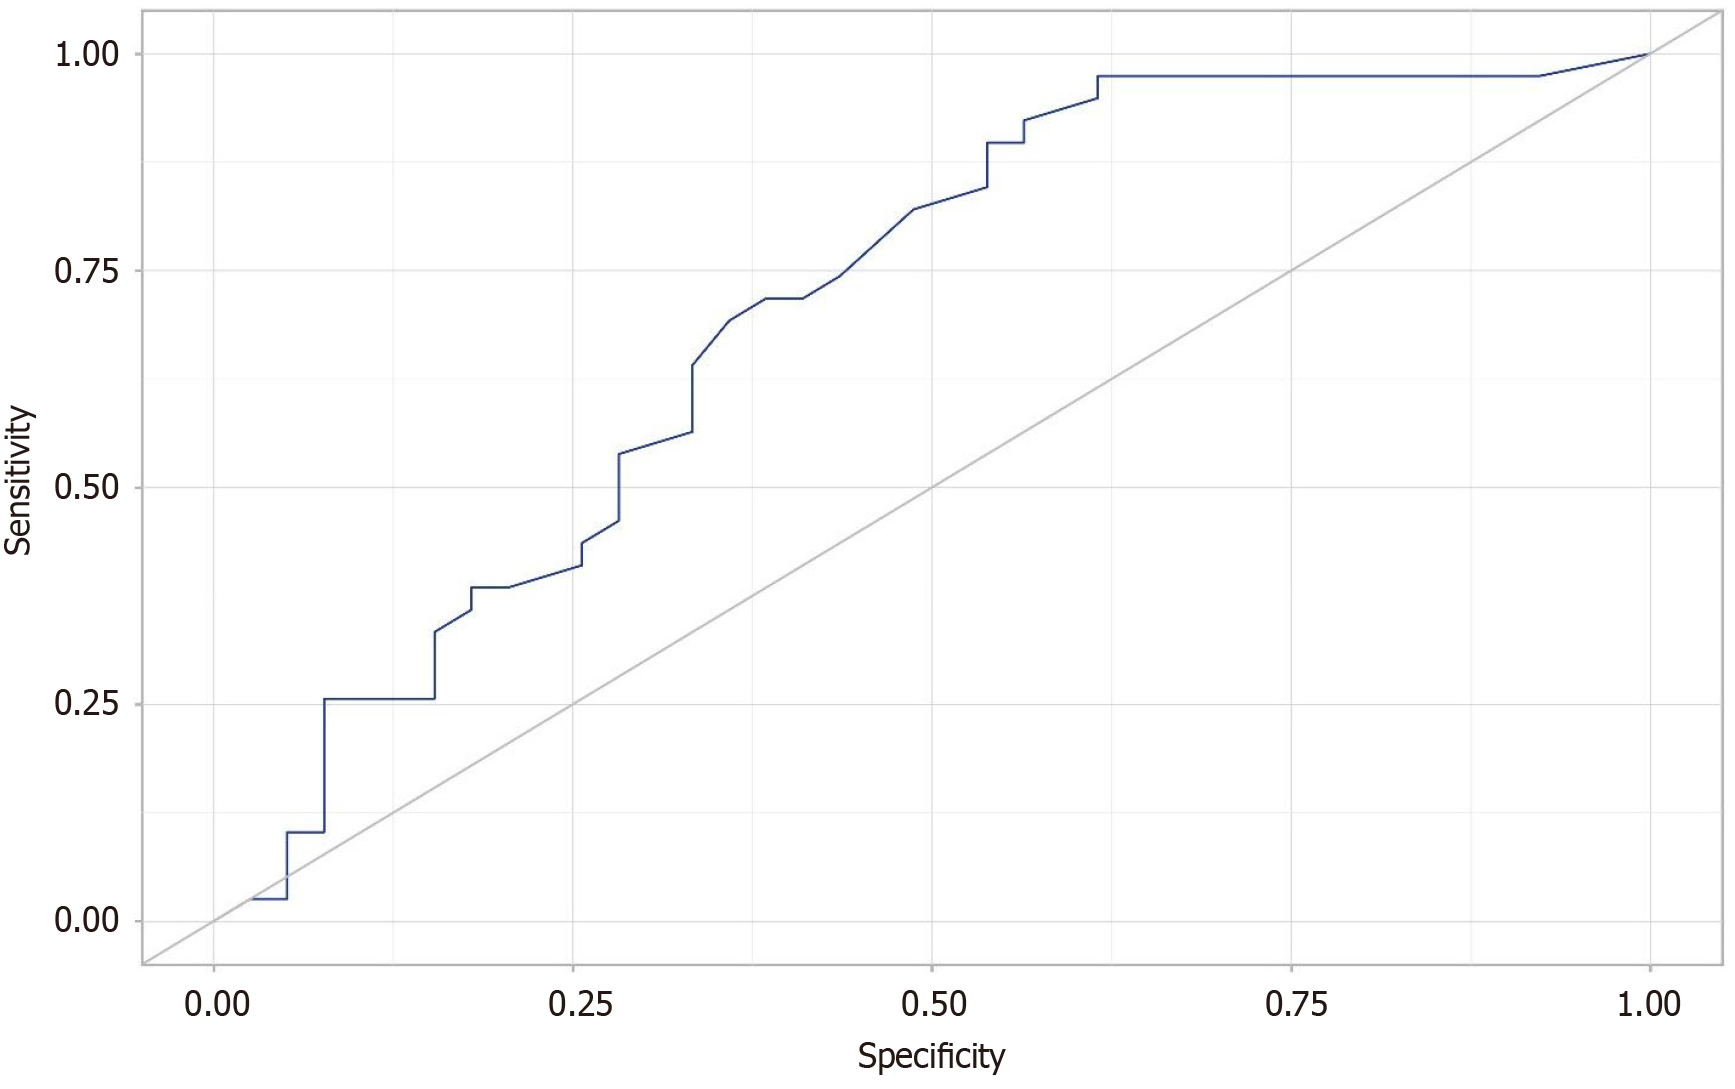
Figure 4 Receiver operating characteristic curve for the logistic regression model predicting biologic disease-modifying antirheumatic drugs prescription.
Area under the curve = 0.704 (95%CI: 0.589-0.820; P = 0.002). The optimal cut-off value (Youden index) was 0.396, corresponding to a sensitivity of 89.7% and a specificity of 46.2%.
- Citation: Podzolkova VA, Geppe NA, Glazyrina AA, Valieva SI, Avrusin IS, Kurbanova SK, Vakhlyarskaya SS, Kostina YO, Yudina VT, Lagutina EA, Osminina MK, Zholobova ES, Podchernyaeva NS, Turginekova EP, Sorokina LS, Davtian SA, Kostik MM. Does Takayasu arteritis differ between children and adolescents? Insights from a Russian multicenter cohort. World J Clin Pediatr 2026; 15(4): 120832
- URL: https://www.wjgnet.com/2219-2808/full/v15/i4/120832.htm
- DOI: https://dx.doi.org/10.5409/wjcp.120832