
















Copyright: ©Author(s) 2026.
World J Clin Pediatr. Sep 9, 2026; 15(3): 121288
Published online Sep 9, 2026. doi: 10.5409/wjcp.121288
Published online Sep 9, 2026. doi: 10.5409/wjcp.121288
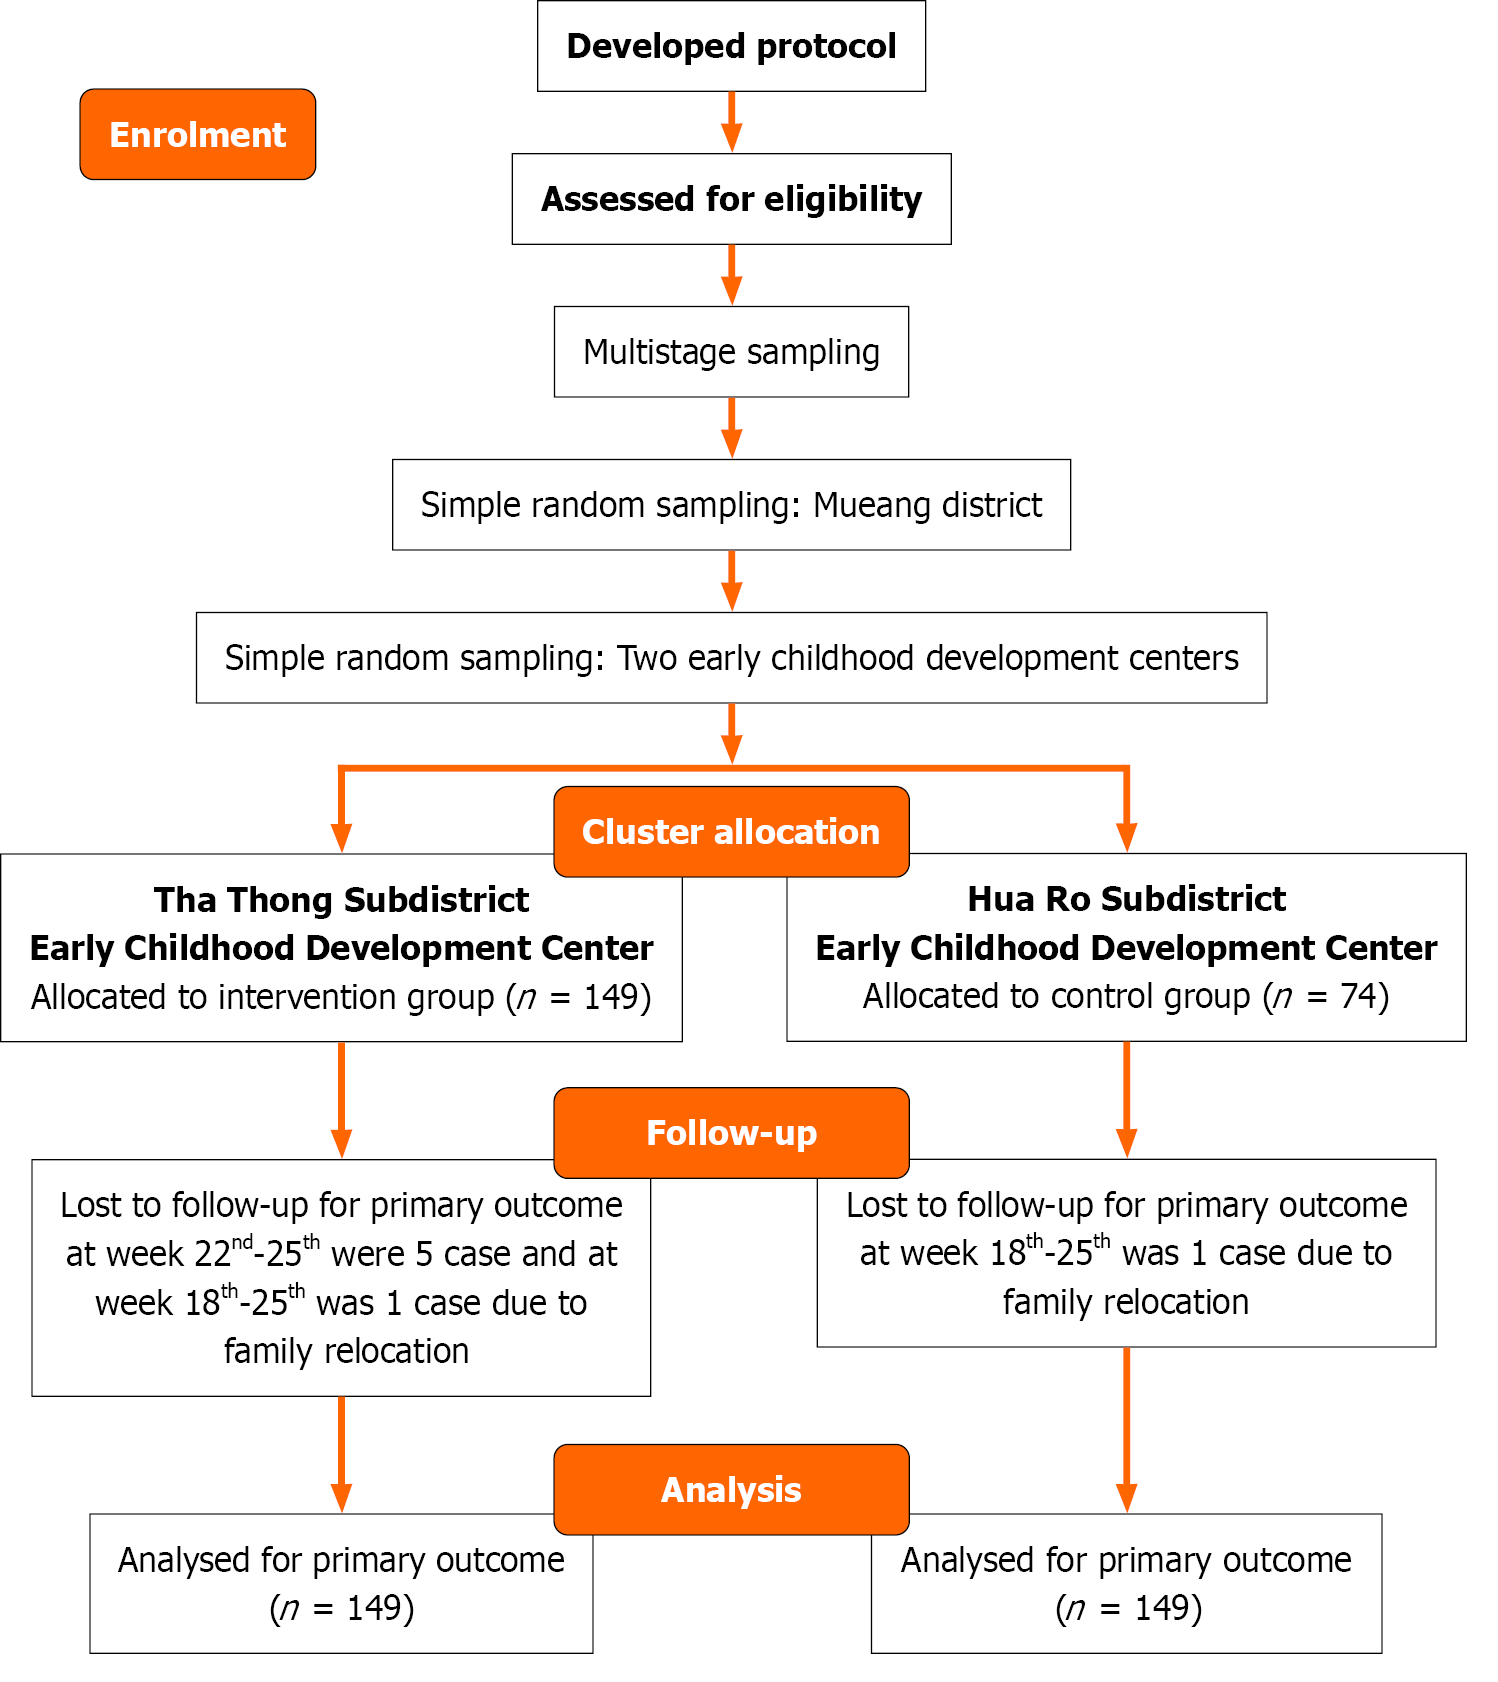
Figure 1
Study flow diagram of cluster allocation, follow-up, and analysis.
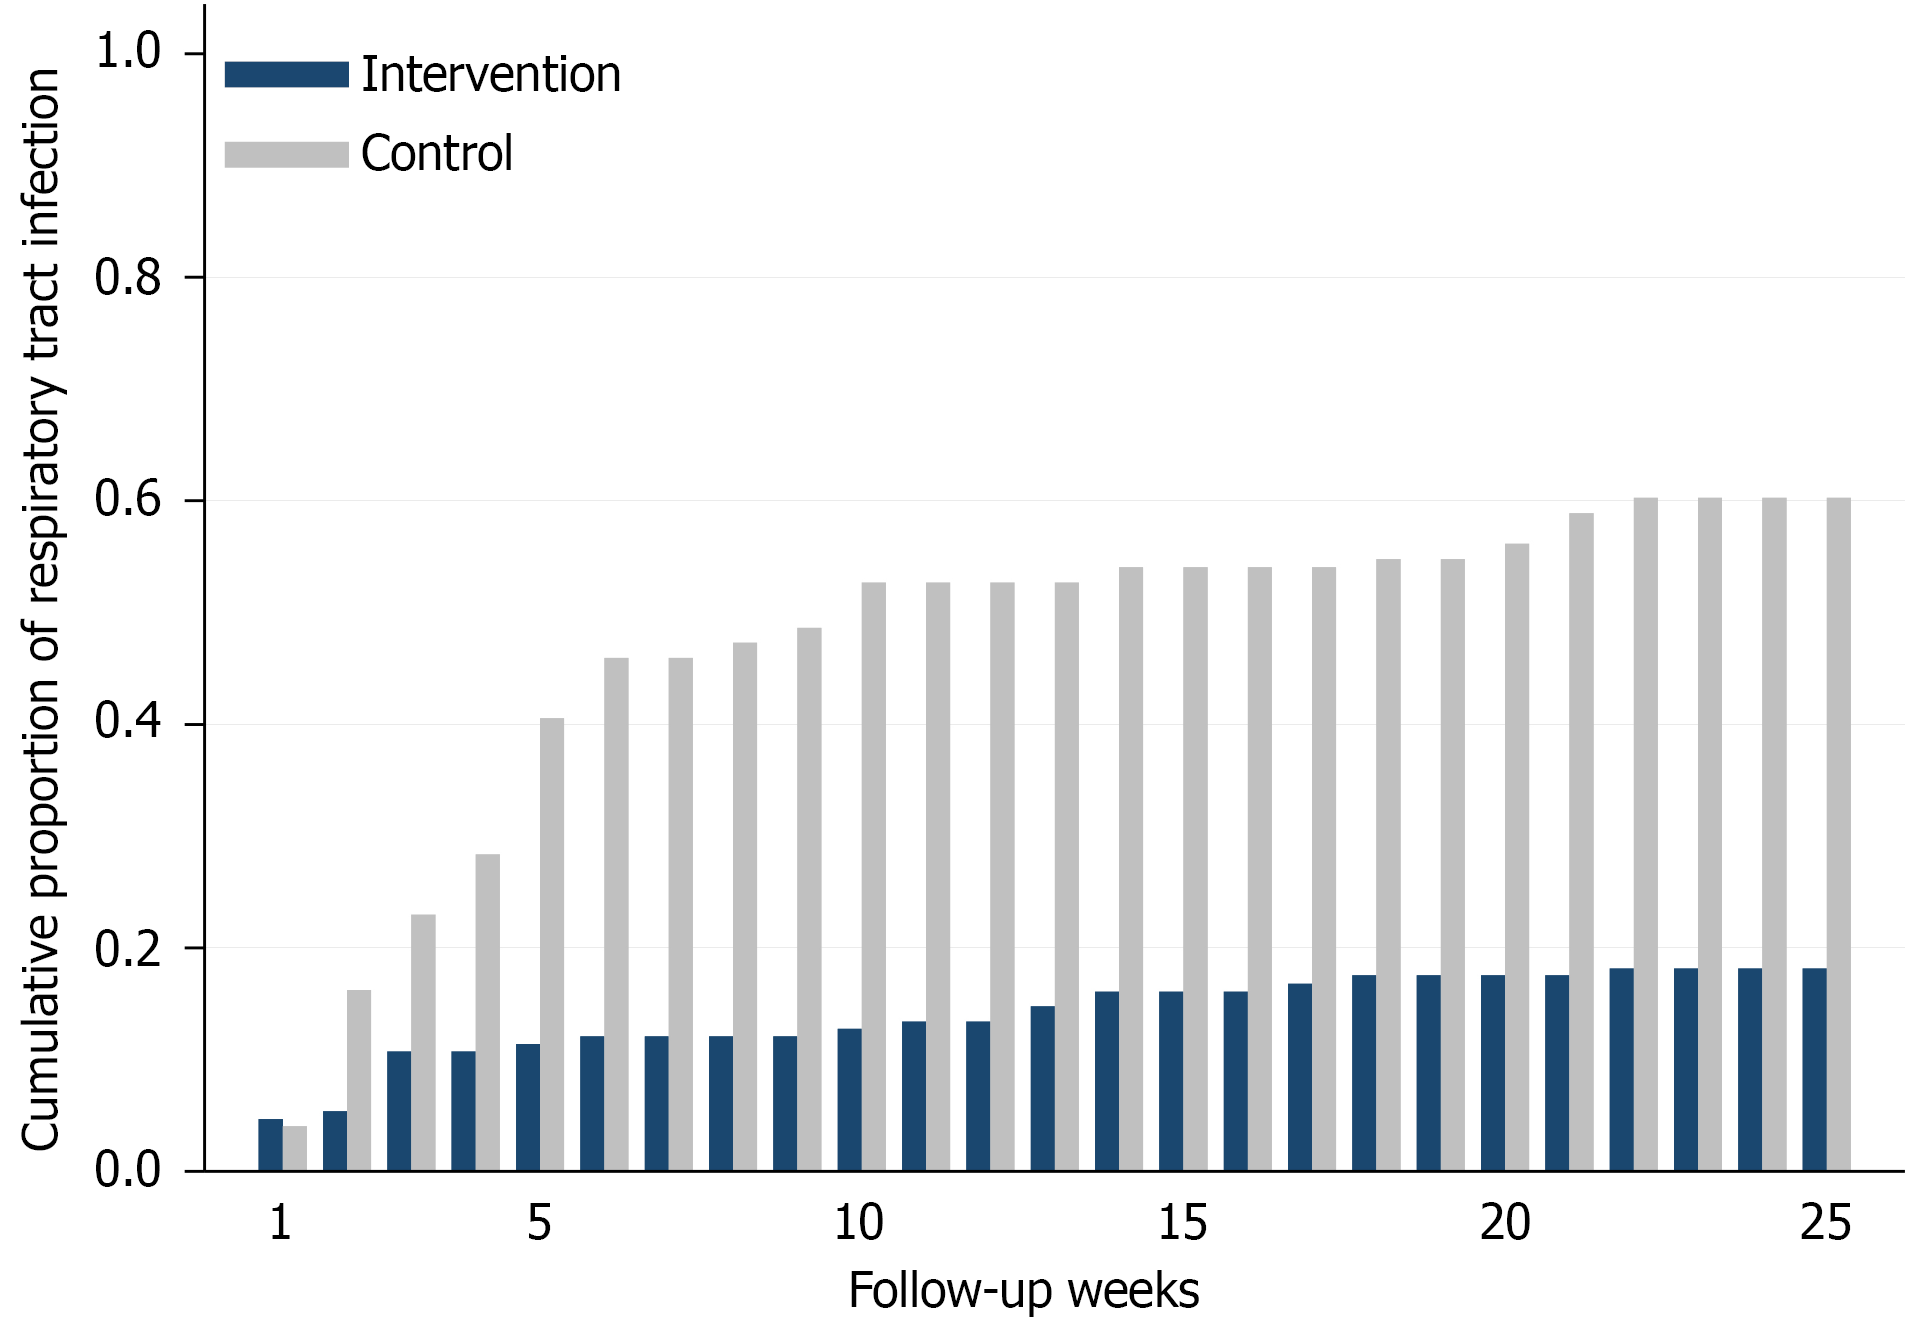
Figure 2
Weekly cumulative proportion of children with at least one respiratory tract infections episode in the intervention and control groups over the 25-week follow-up period.
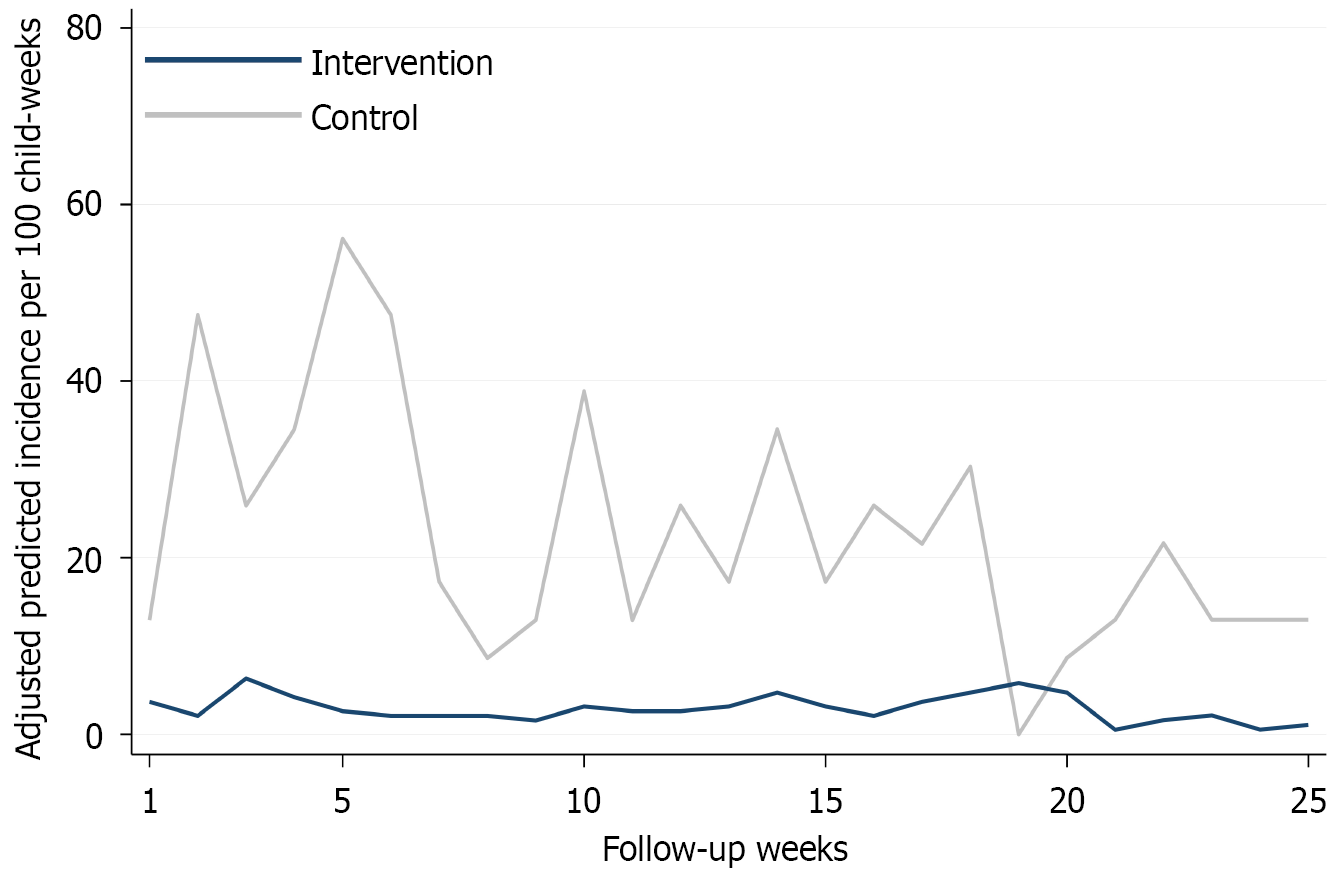
Figure 3
Adjusted predicted mean incidence rates of respiratory tract infections in the intervention and control groups over the 25-week follow-up period, estimated from the multivariable Poisson regression model using marginal predictions.
- Citation: Srisingh K, Sribuarom N, Suasing C, Inkate S. Effectiveness of a structured protocol for the prevention of acute respiratory tract infections in daycare centers: A quasi-experimental study. World J Clin Pediatr 2026; 15(3): 121288
- URL: https://www.wjgnet.com/2219-2808/full/v15/i3/121288.htm
- DOI: https://dx.doi.org/10.5409/wjcp.121288