
















Copyright: ©Author(s) 2026.
World J Clin Pediatr. Sep 9, 2026; 15(3): 120066
Published online Sep 9, 2026. doi: 10.5409/wjcp.120066
Published online Sep 9, 2026. doi: 10.5409/wjcp.120066
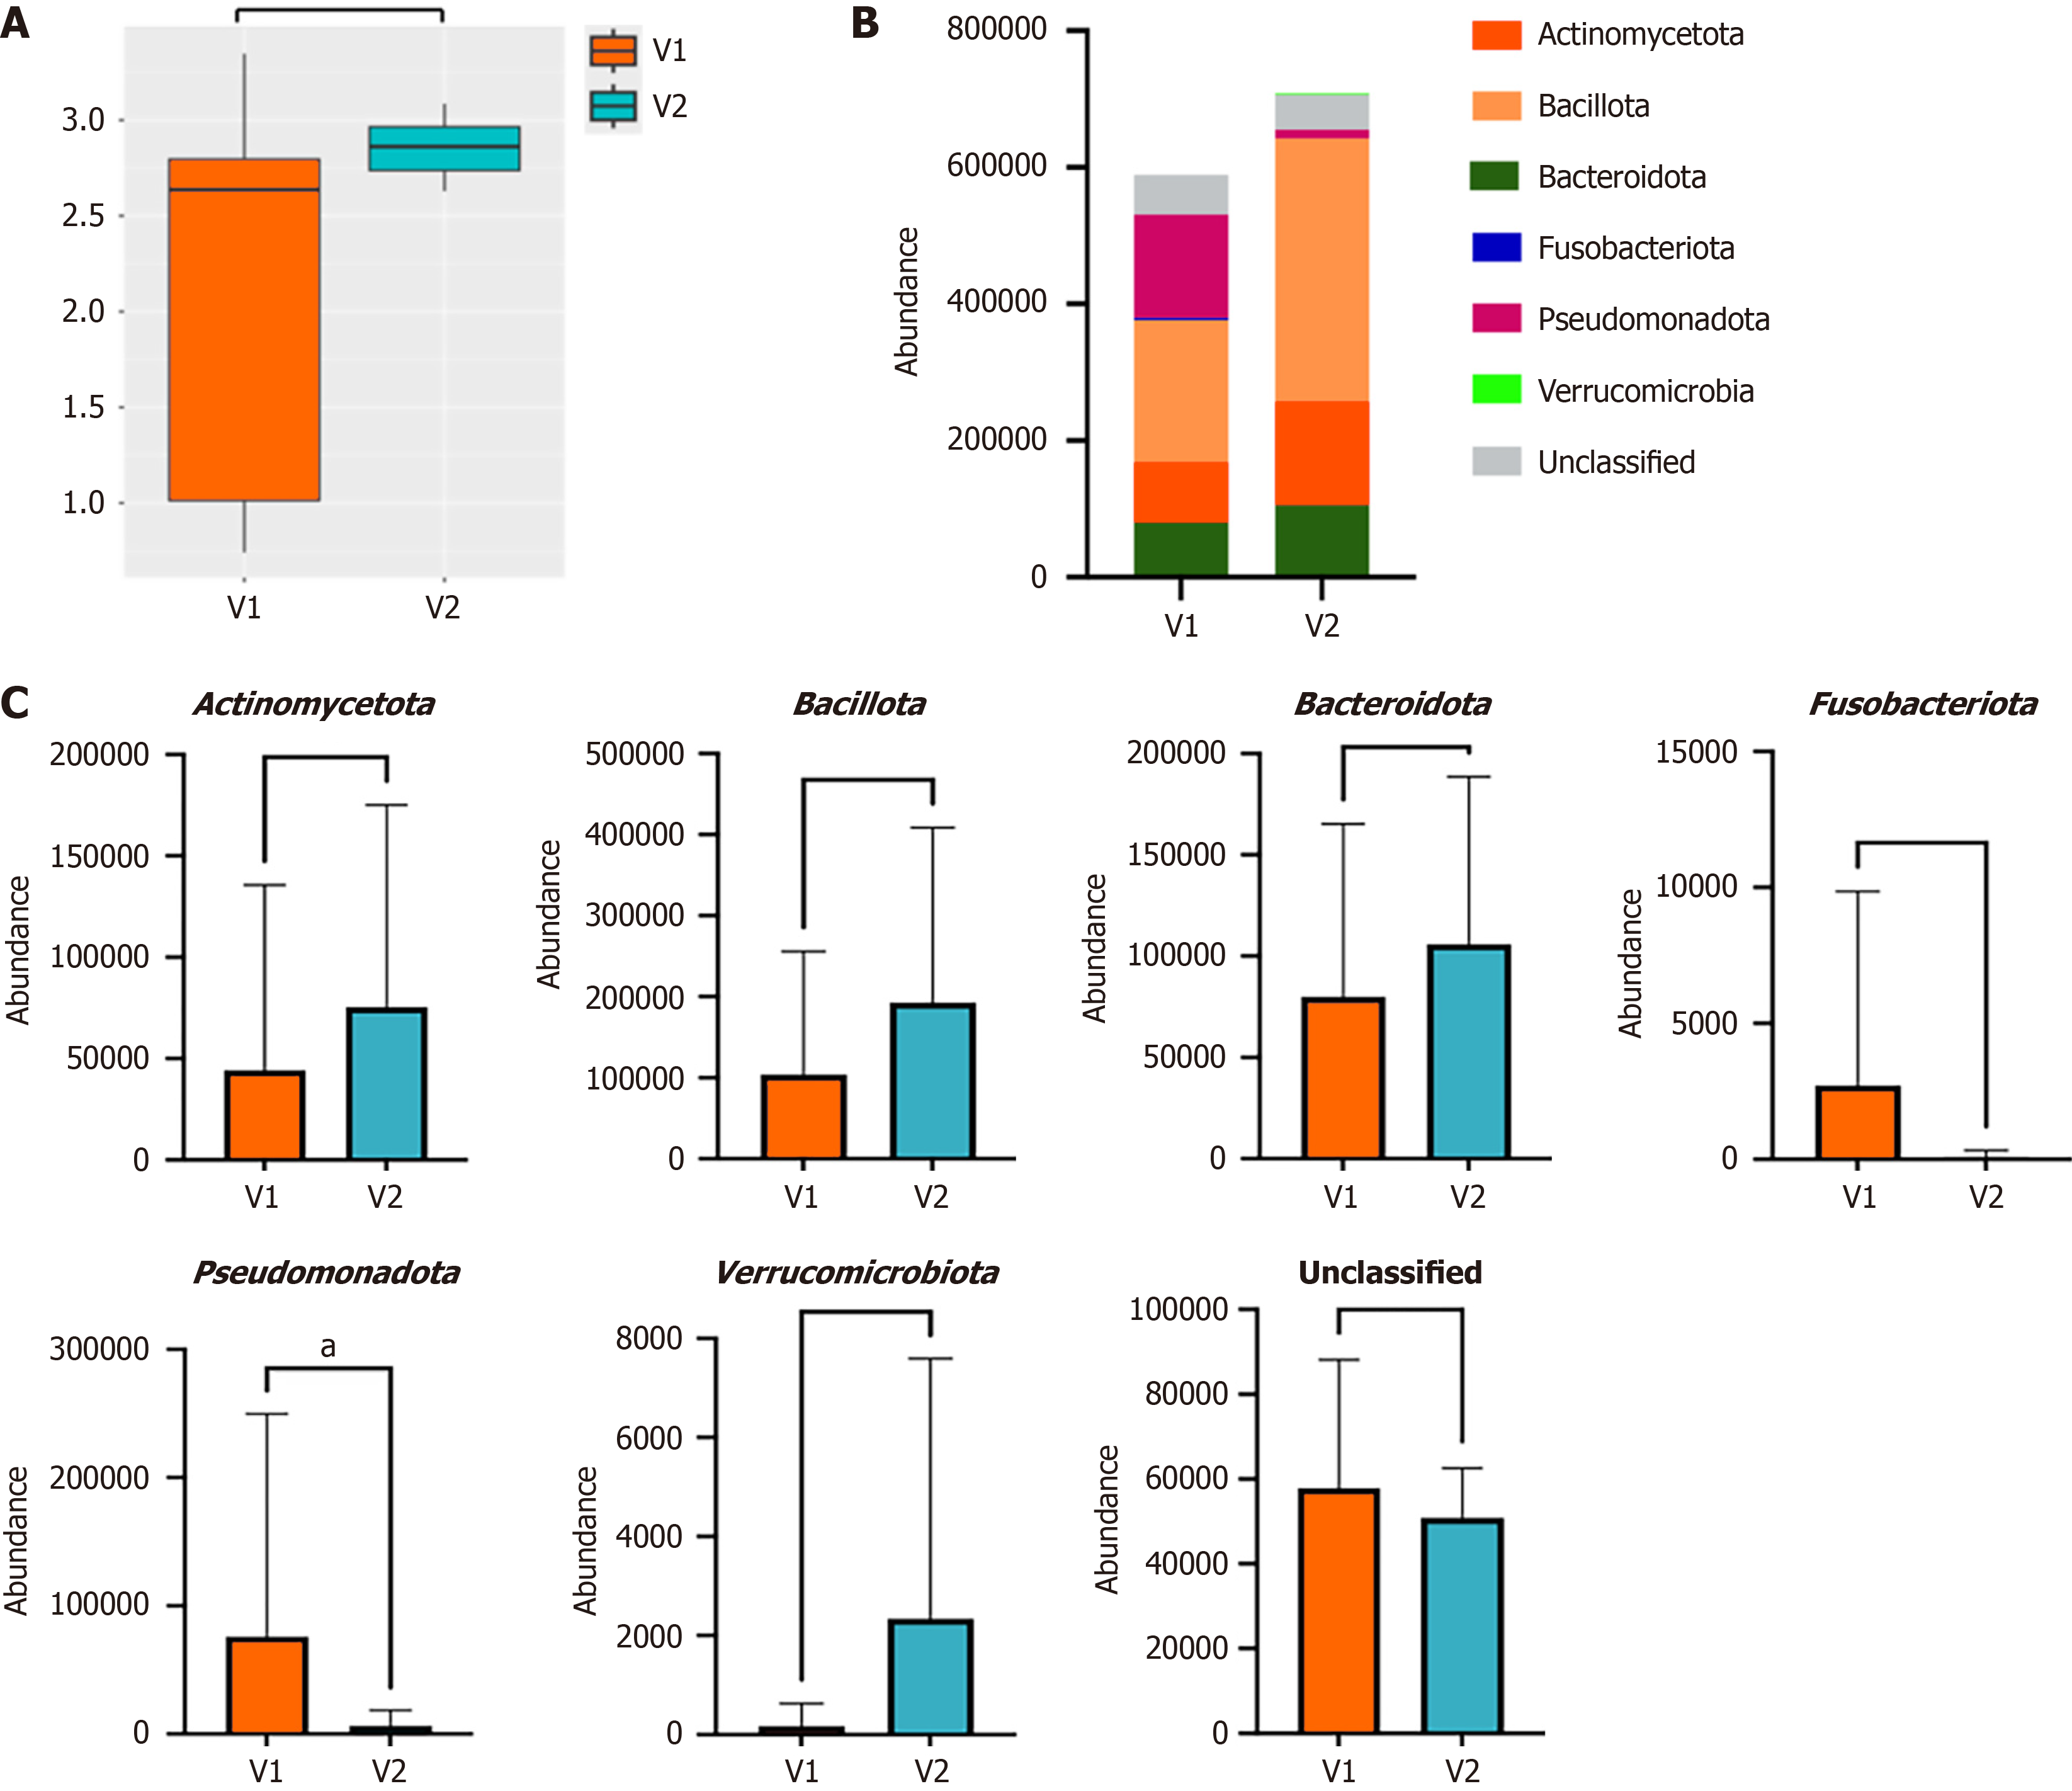
Figure 1 Diversity and taxonomic composition of gut microbiota in inflammatory bowel disease during flare (visit 1) and remission (visit 2).
A: Shannon diversity index; B: Phylum-level diversity; C: Phylum-level abundance. V1: Visit 1; V2: Visit 2. aP < 0.05.
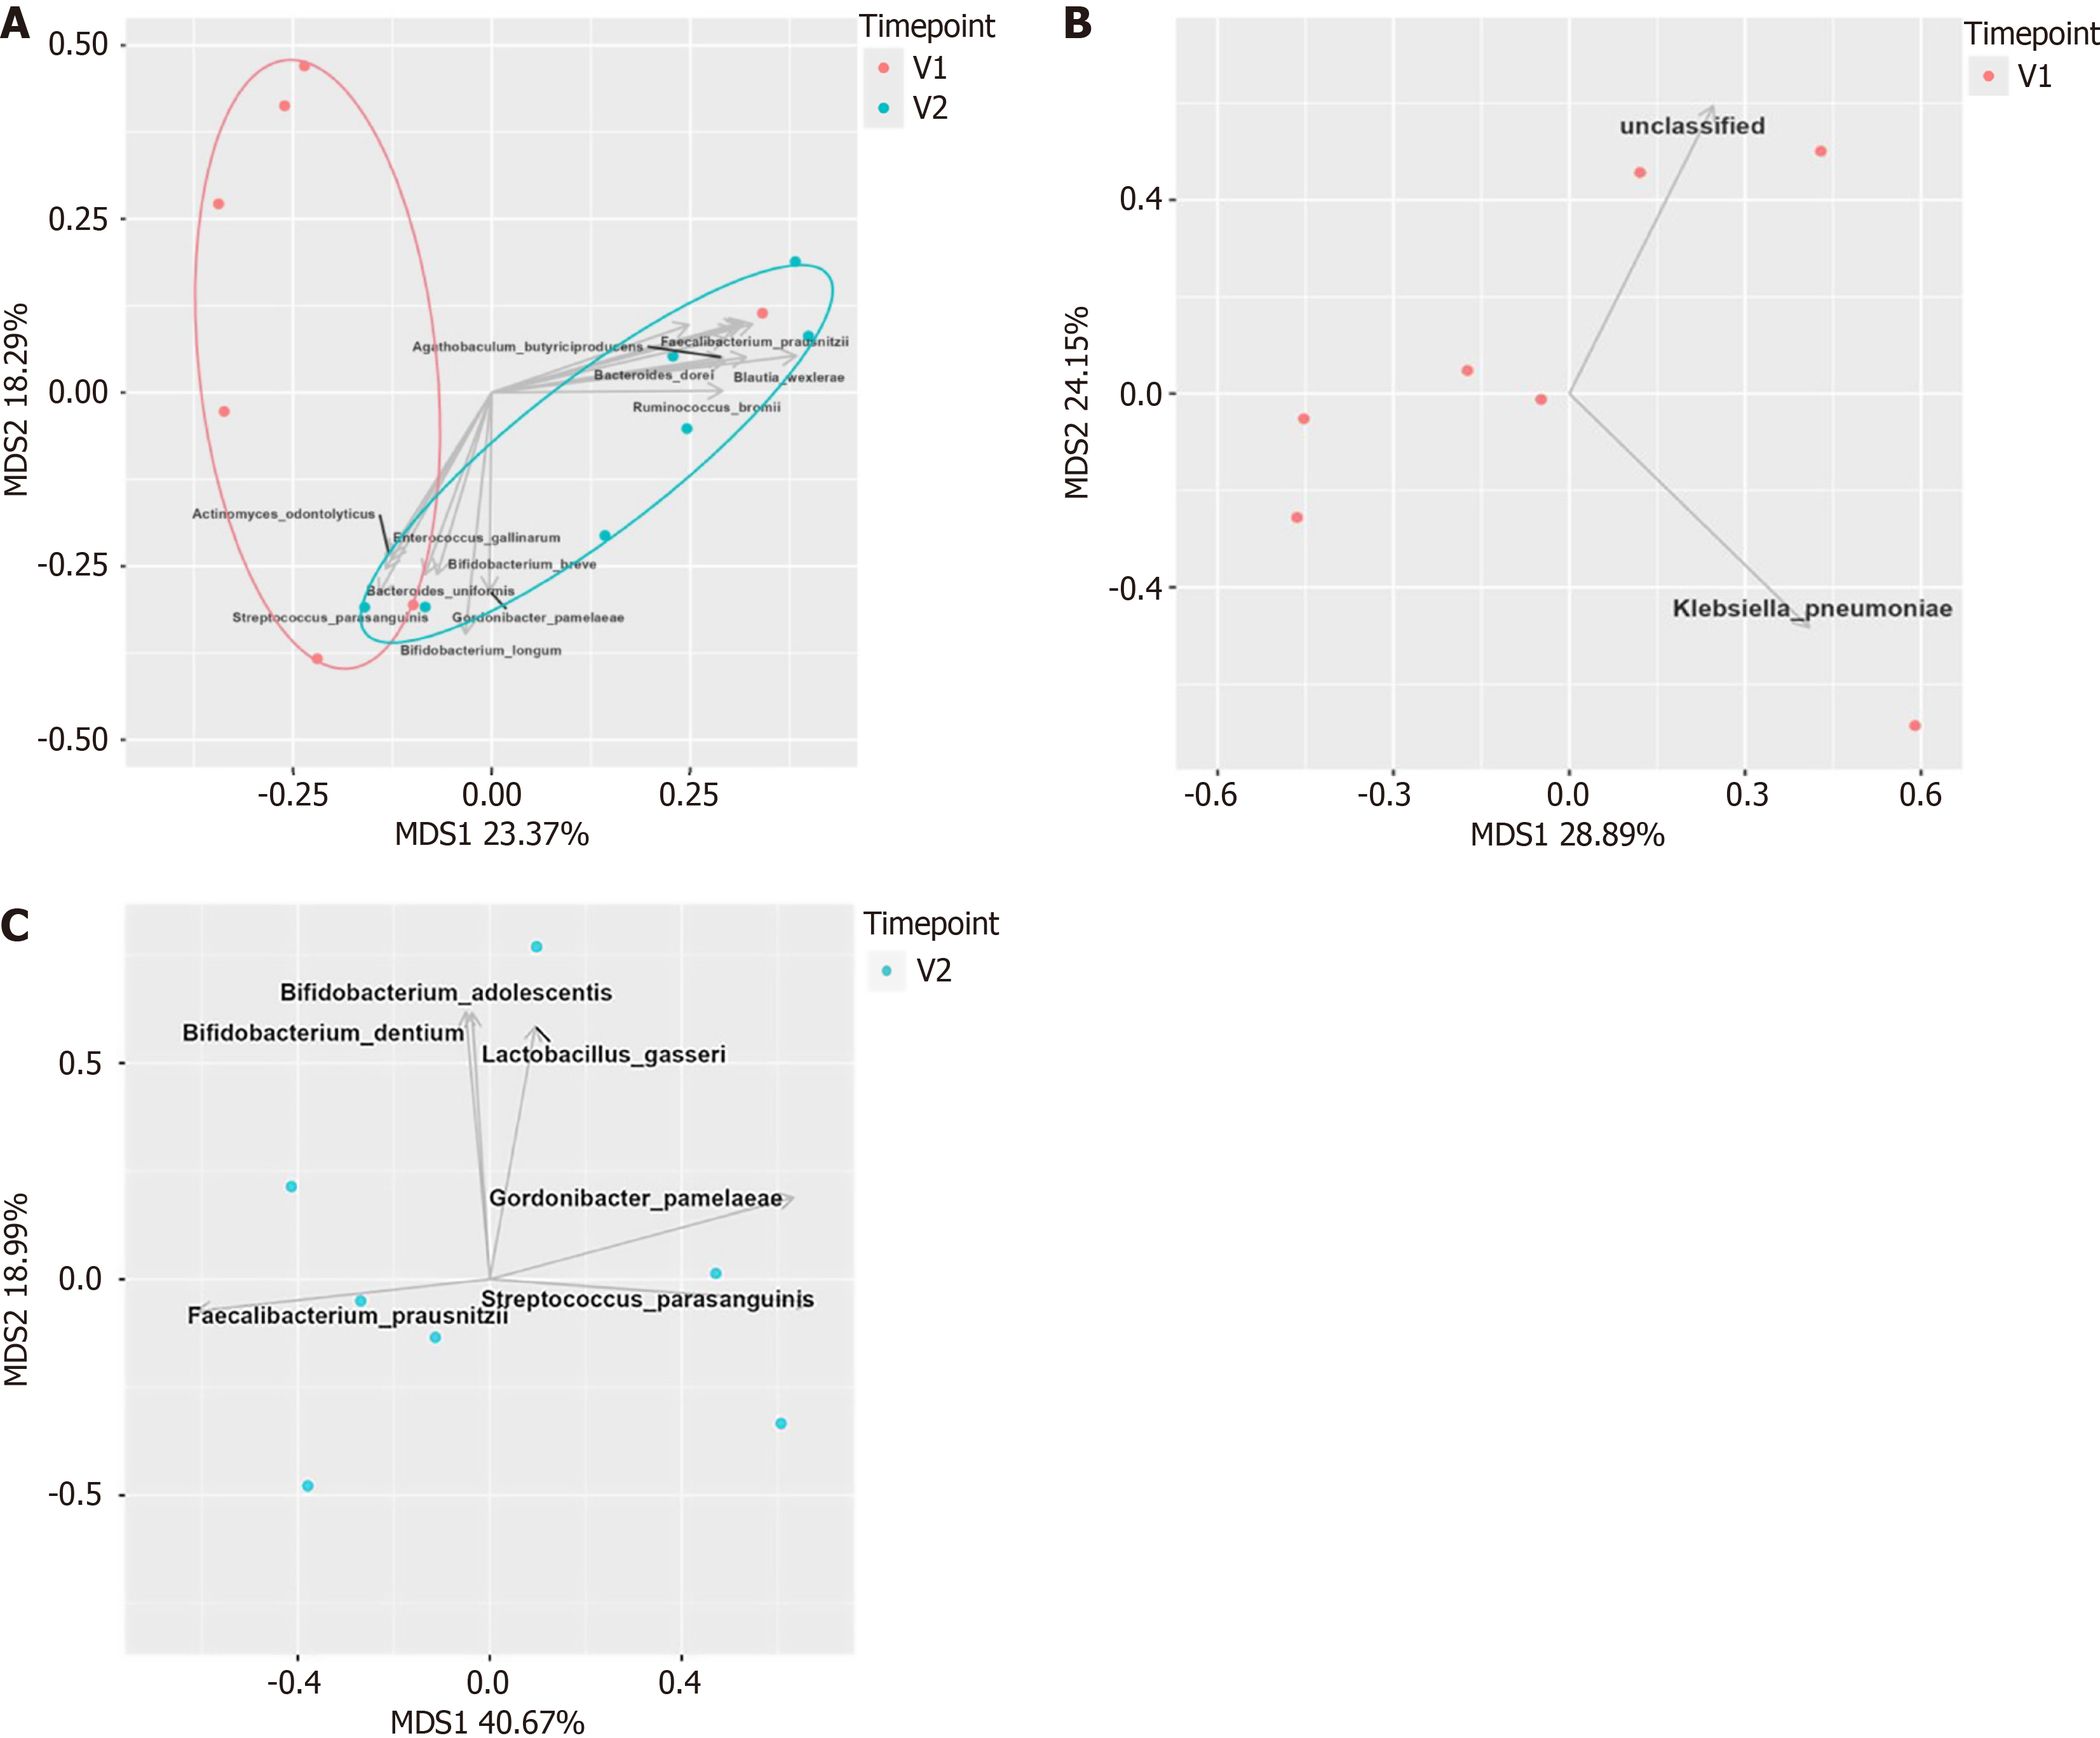
Figure 2 Multidimensional scaling plots of gut microbiota composition during flare (visit 1) and remission (visit 2) states of inflammatory bowel disease.
A: Overall gut microbiota composition across both flare and remission states; B: Gut microbiota composition among participants during the flare state (visit 1); C: Gut microbiota composition among participants during the remission state (visit 2). MDS: Multidimensional scaling; V1: Visit 1; V2: Visit 2.
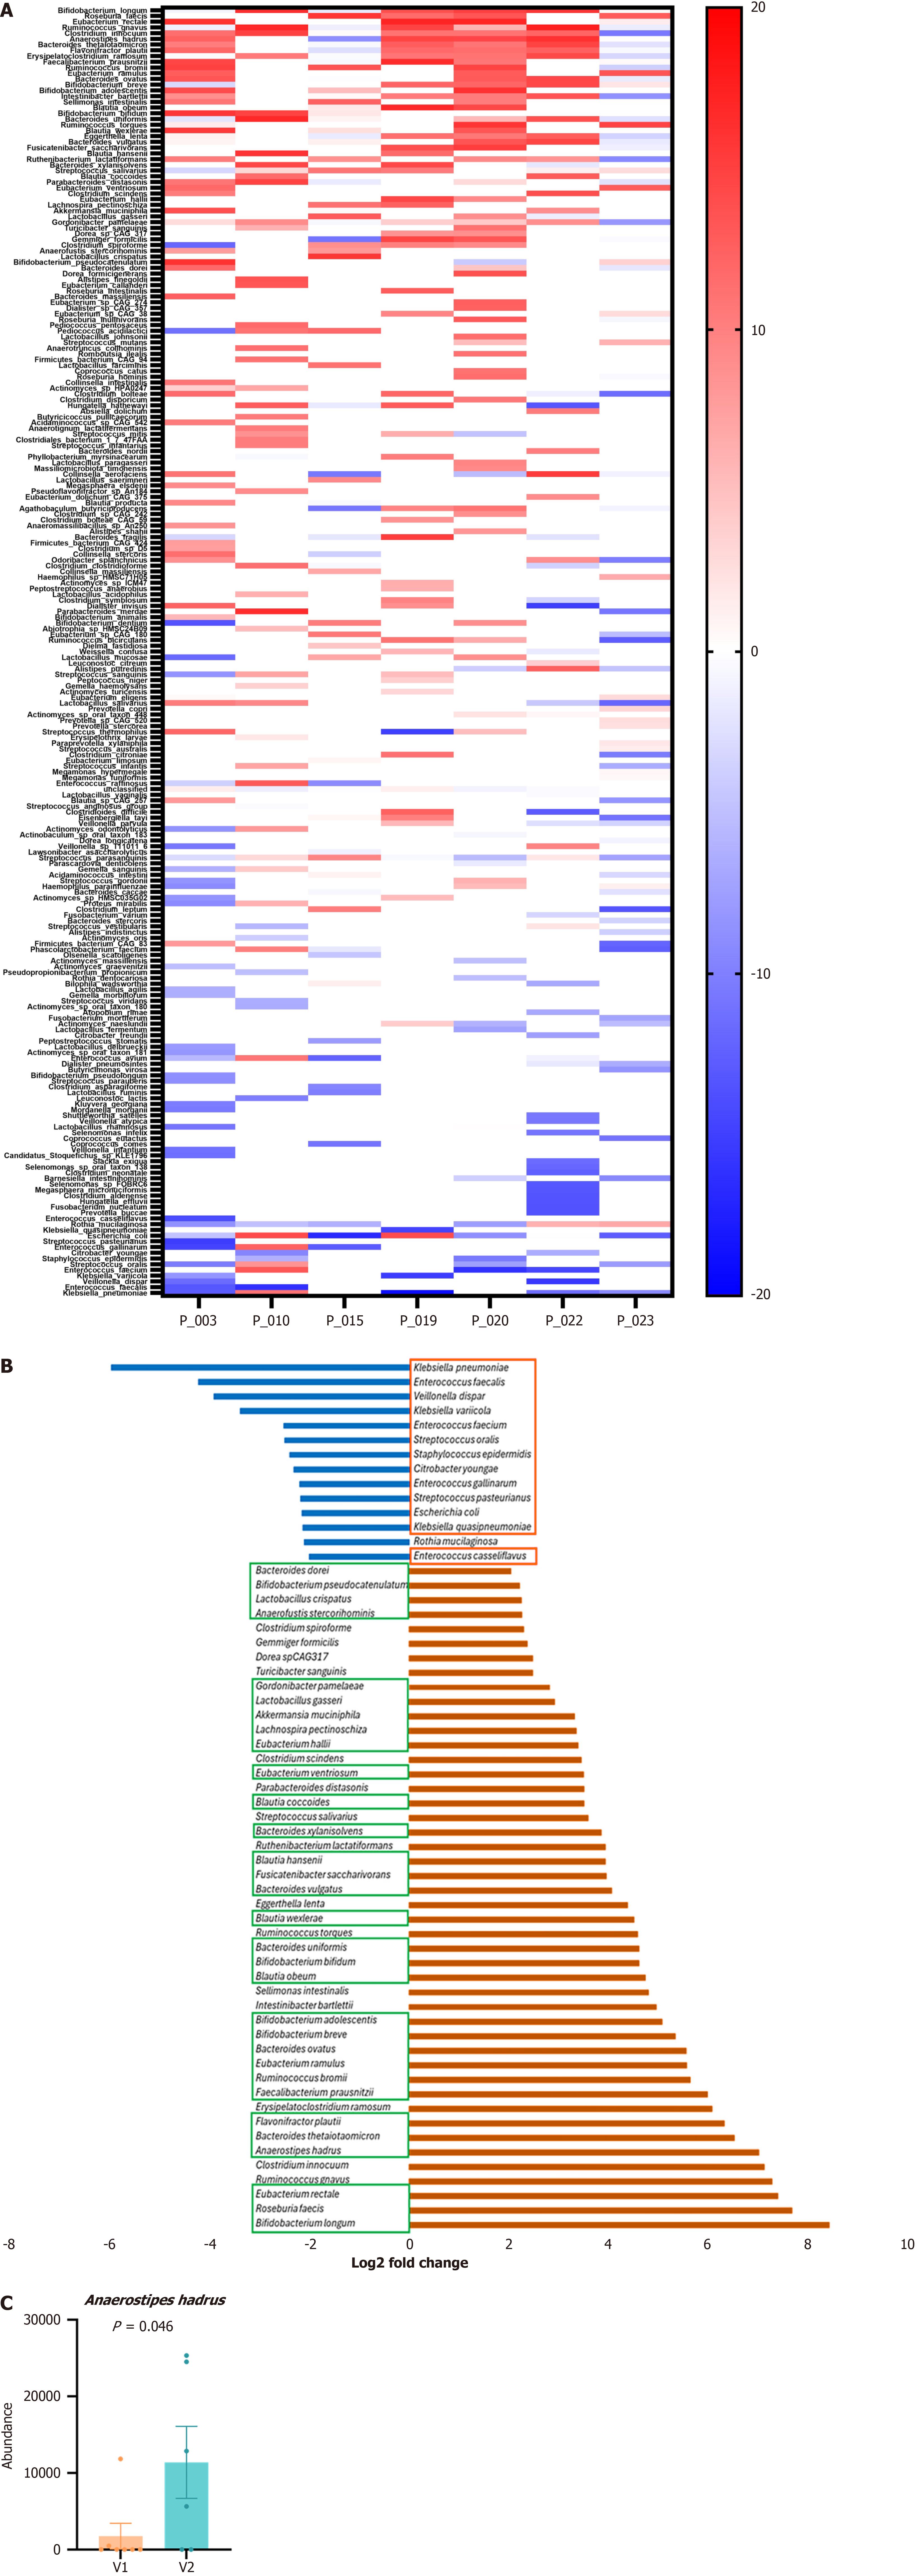
Figure 3 Differentially abundant gut microbes in remission (visit 2) compared with flare (visit 1) states of inflammatory bowel disease.
A: Heatmap showing gut microbes exhibiting significant differential abundance (2-fold change) in remission (visit 2) compared with flare (visit 1) for each individual participant; B: Log2 fold change of gut microbes that are significantly upregulated or downregulated (2-fold change) in remission (visit 2) compared with flare (visit 1). Red box indicates pathogenic microbes associated with inflammatory bowel disease and green box indicates beneficial microbes associated with inflammatory bowel disease; C: Individual gut microbe showing statistically significant differential abundance (2-fold change) in remission (visit 2) compared with flare (visit 1). V1: Visit 1; V2: Visit 2.
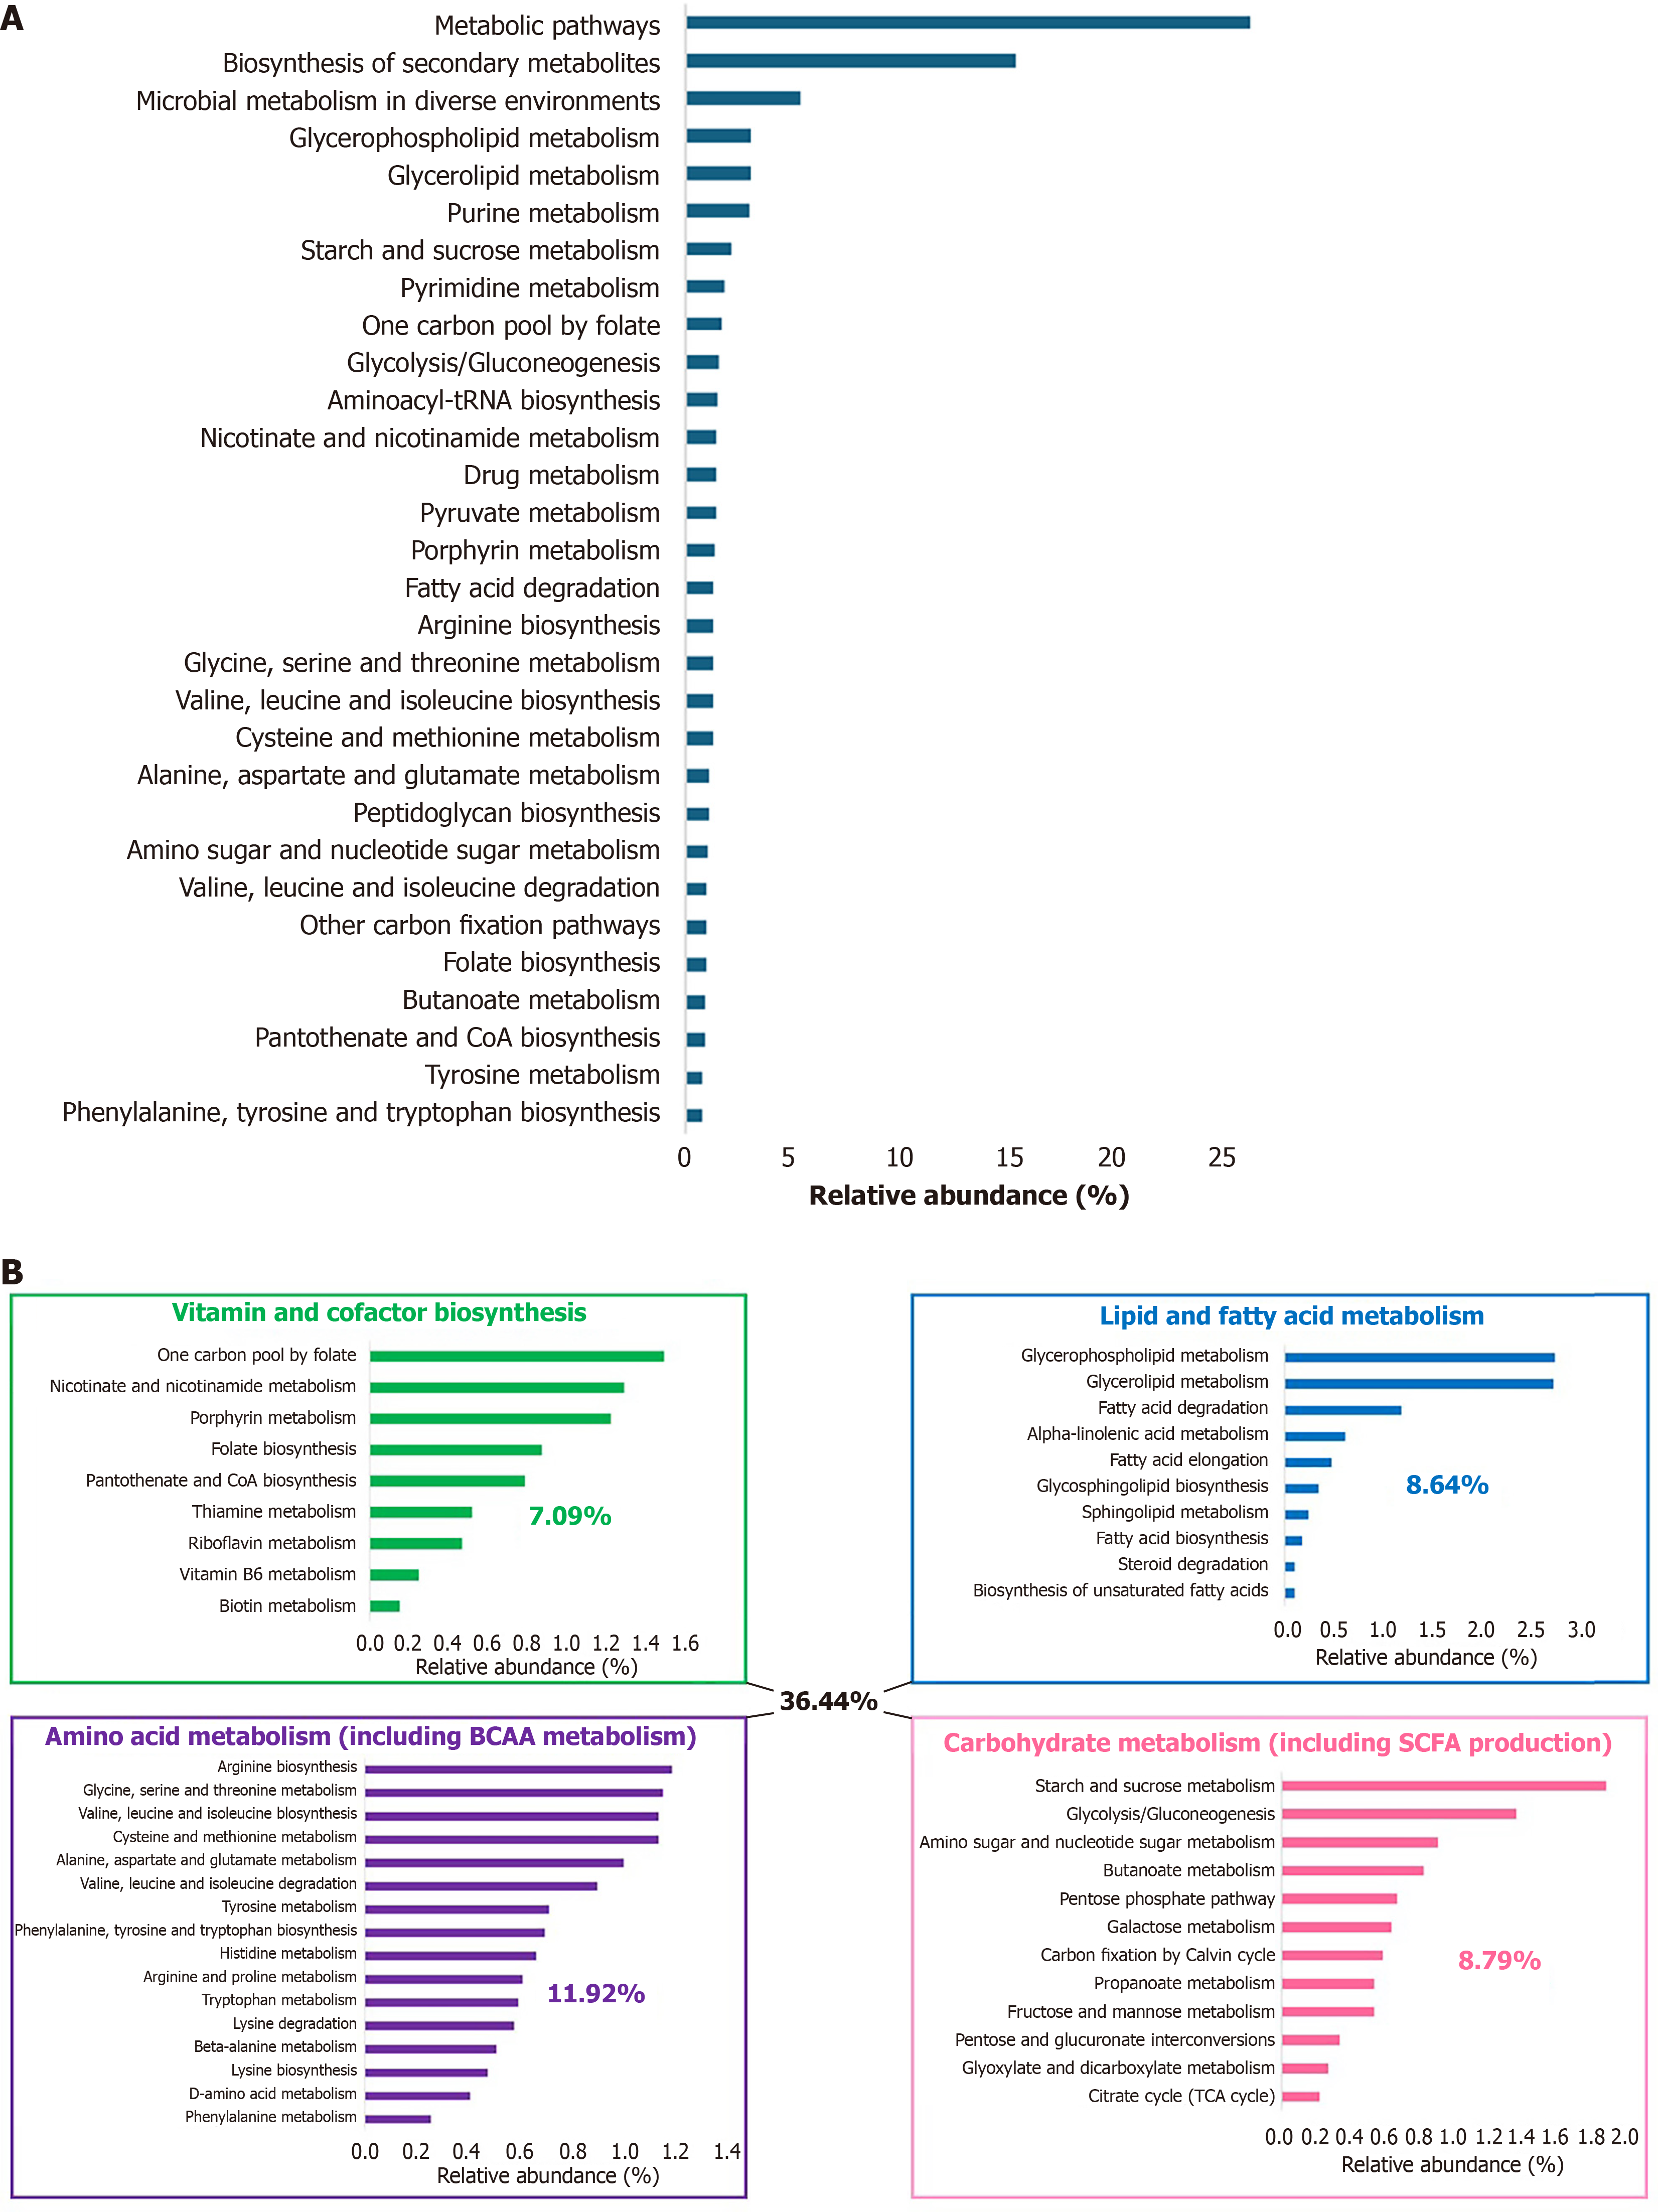
Figure 4 Microbial functional pathways associated with significantly altered microbial genes in remission (visit 2) compared with flare (visit 1) states of inflammatory bowel disease.
A: Top 30 microbial functional pathways associated with microbial genes exhibiting significant differential abundance (≥ 2-fold change) in remission (visit 2) compared with flare (visit 1); B: Major metabolic pathway categories, including vitamin and cofactor biosynthesis, carbohydrate metabolism, amino acid metabolism, and lipid and fatty acid metabolism, associated with microbial genes significantly altered in remission (visit 2) compared with flare (visit 1). SCFA: Short-chain fatty acid; BCAA: Branched-chain amino acids.
- Citation: Huang JG, Tay CJX, Aw MM, Lee YS, Ooi DSQ. Microbial and functional shifts between flare and remission in a single-center cohort of children with inflammatory bowel disease. World J Clin Pediatr 2026; 15(3): 120066
- URL: https://www.wjgnet.com/2219-2808/full/v15/i3/120066.htm
- DOI: https://dx.doi.org/10.5409/wjcp.120066