
















Copyright: ©Author(s) 2026.
World J Clin Pediatr. Sep 9, 2026; 15(3): 118603
Published online Sep 9, 2026. doi: 10.5409/wjcp.118603
Published online Sep 9, 2026. doi: 10.5409/wjcp.118603
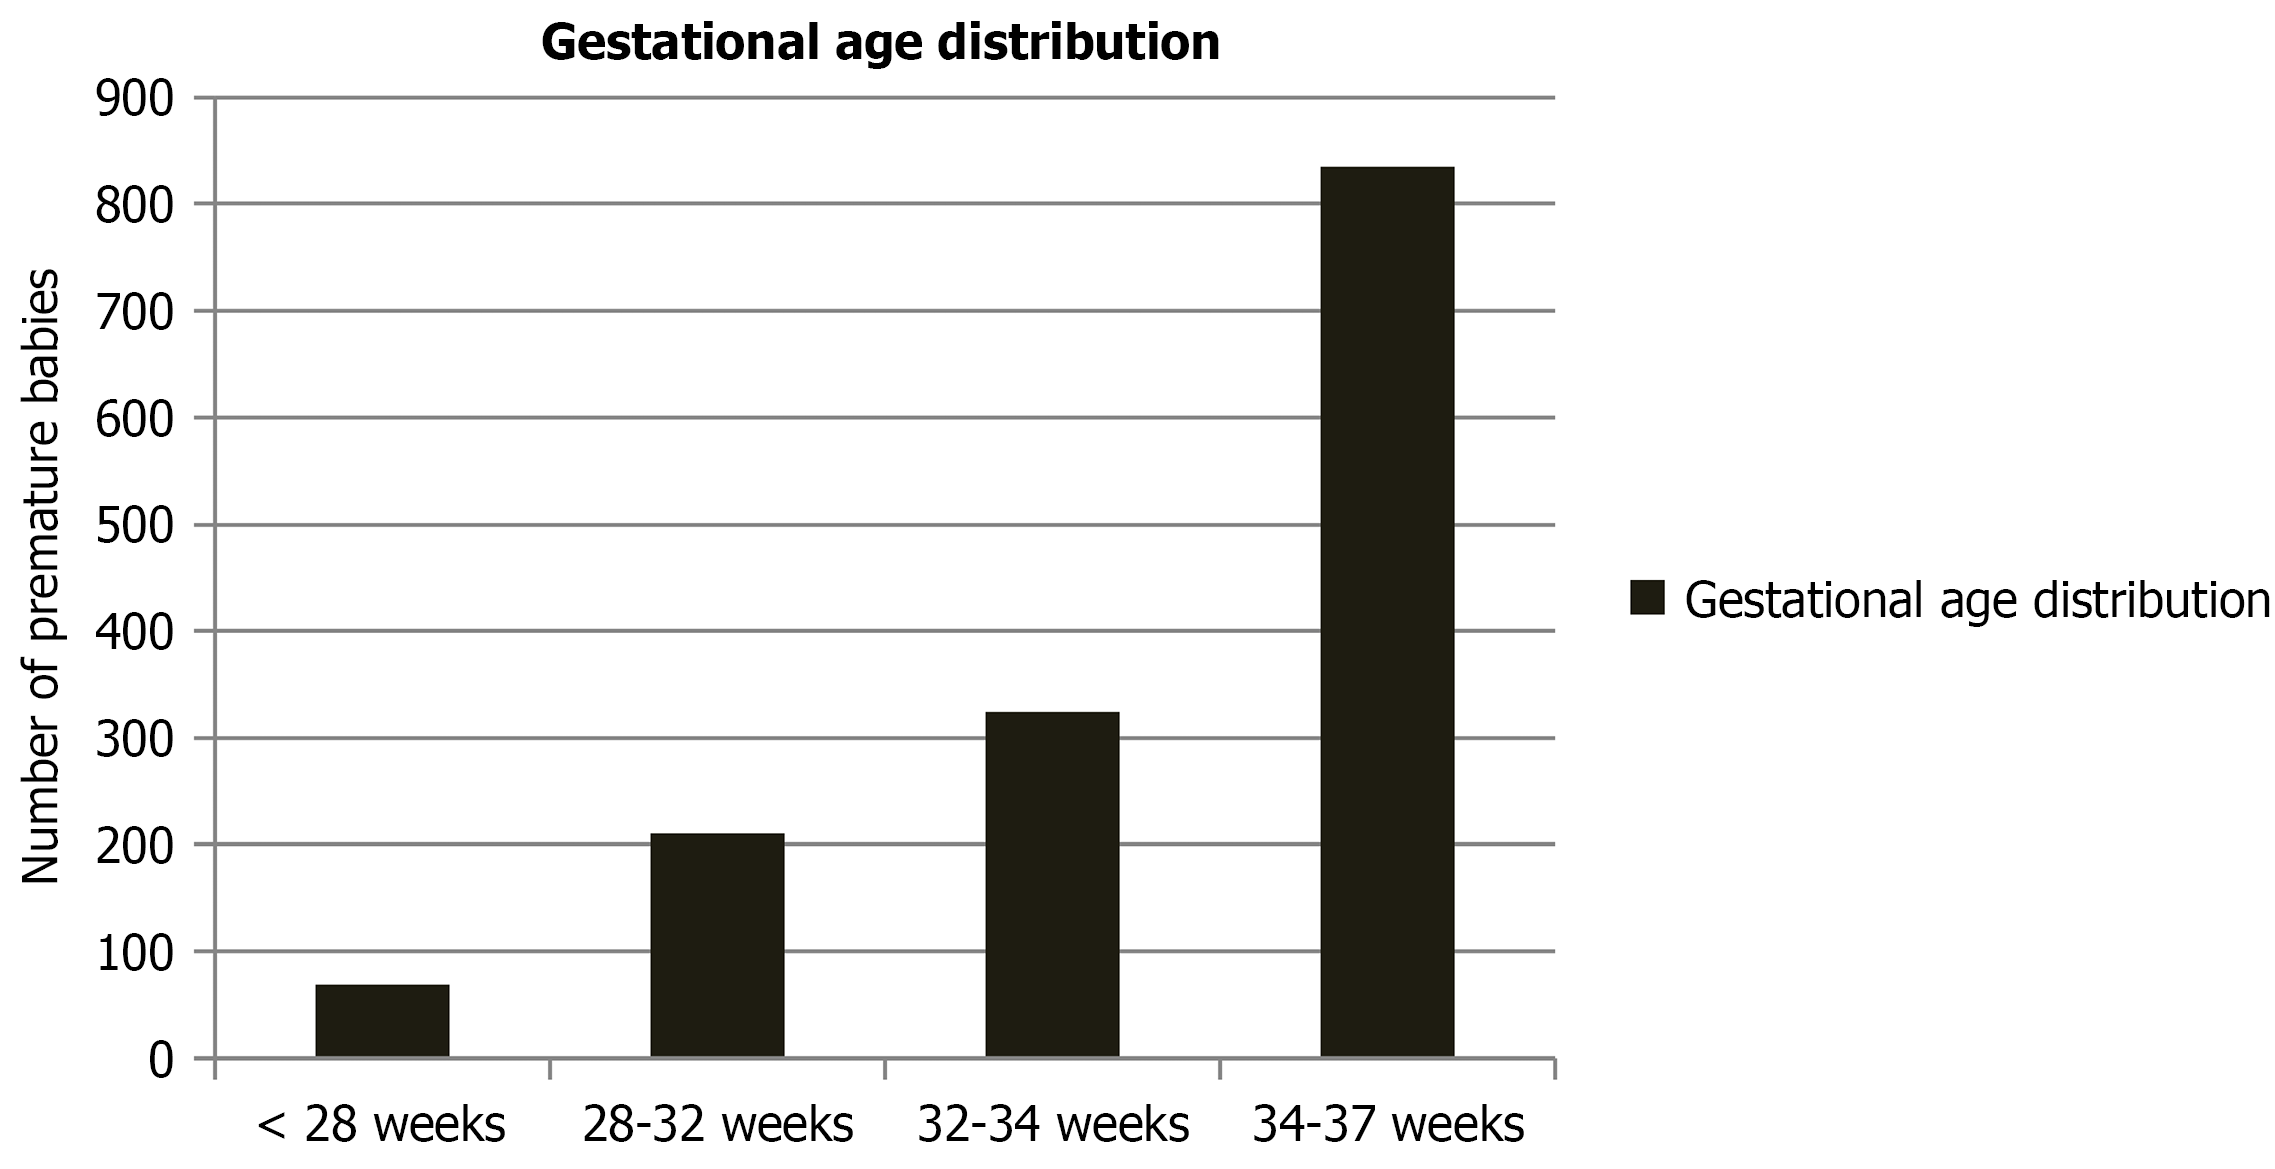
Figure 1 Gestational age distribution of preterm neonates admitted to the tribal-district neonatal intensive care unit between 2022 and 2024.
Illustrates the year-wise distribution of preterm neonates categorized by gestational age at admission. Late preterm infants (34-36+6 weeks) constituted the largest subgroup (835/1438; 58.1%), followed by moderate preterm (32-33+6 weeks; 324; 22.5%) and very preterm (28-31+6 weeks; 210; 14.6%) neonates. Extremely preterm infants (< 28 weeks) accounted for 69 admissions (4.8%). The distribution pattern remained stable across the three-year study period.
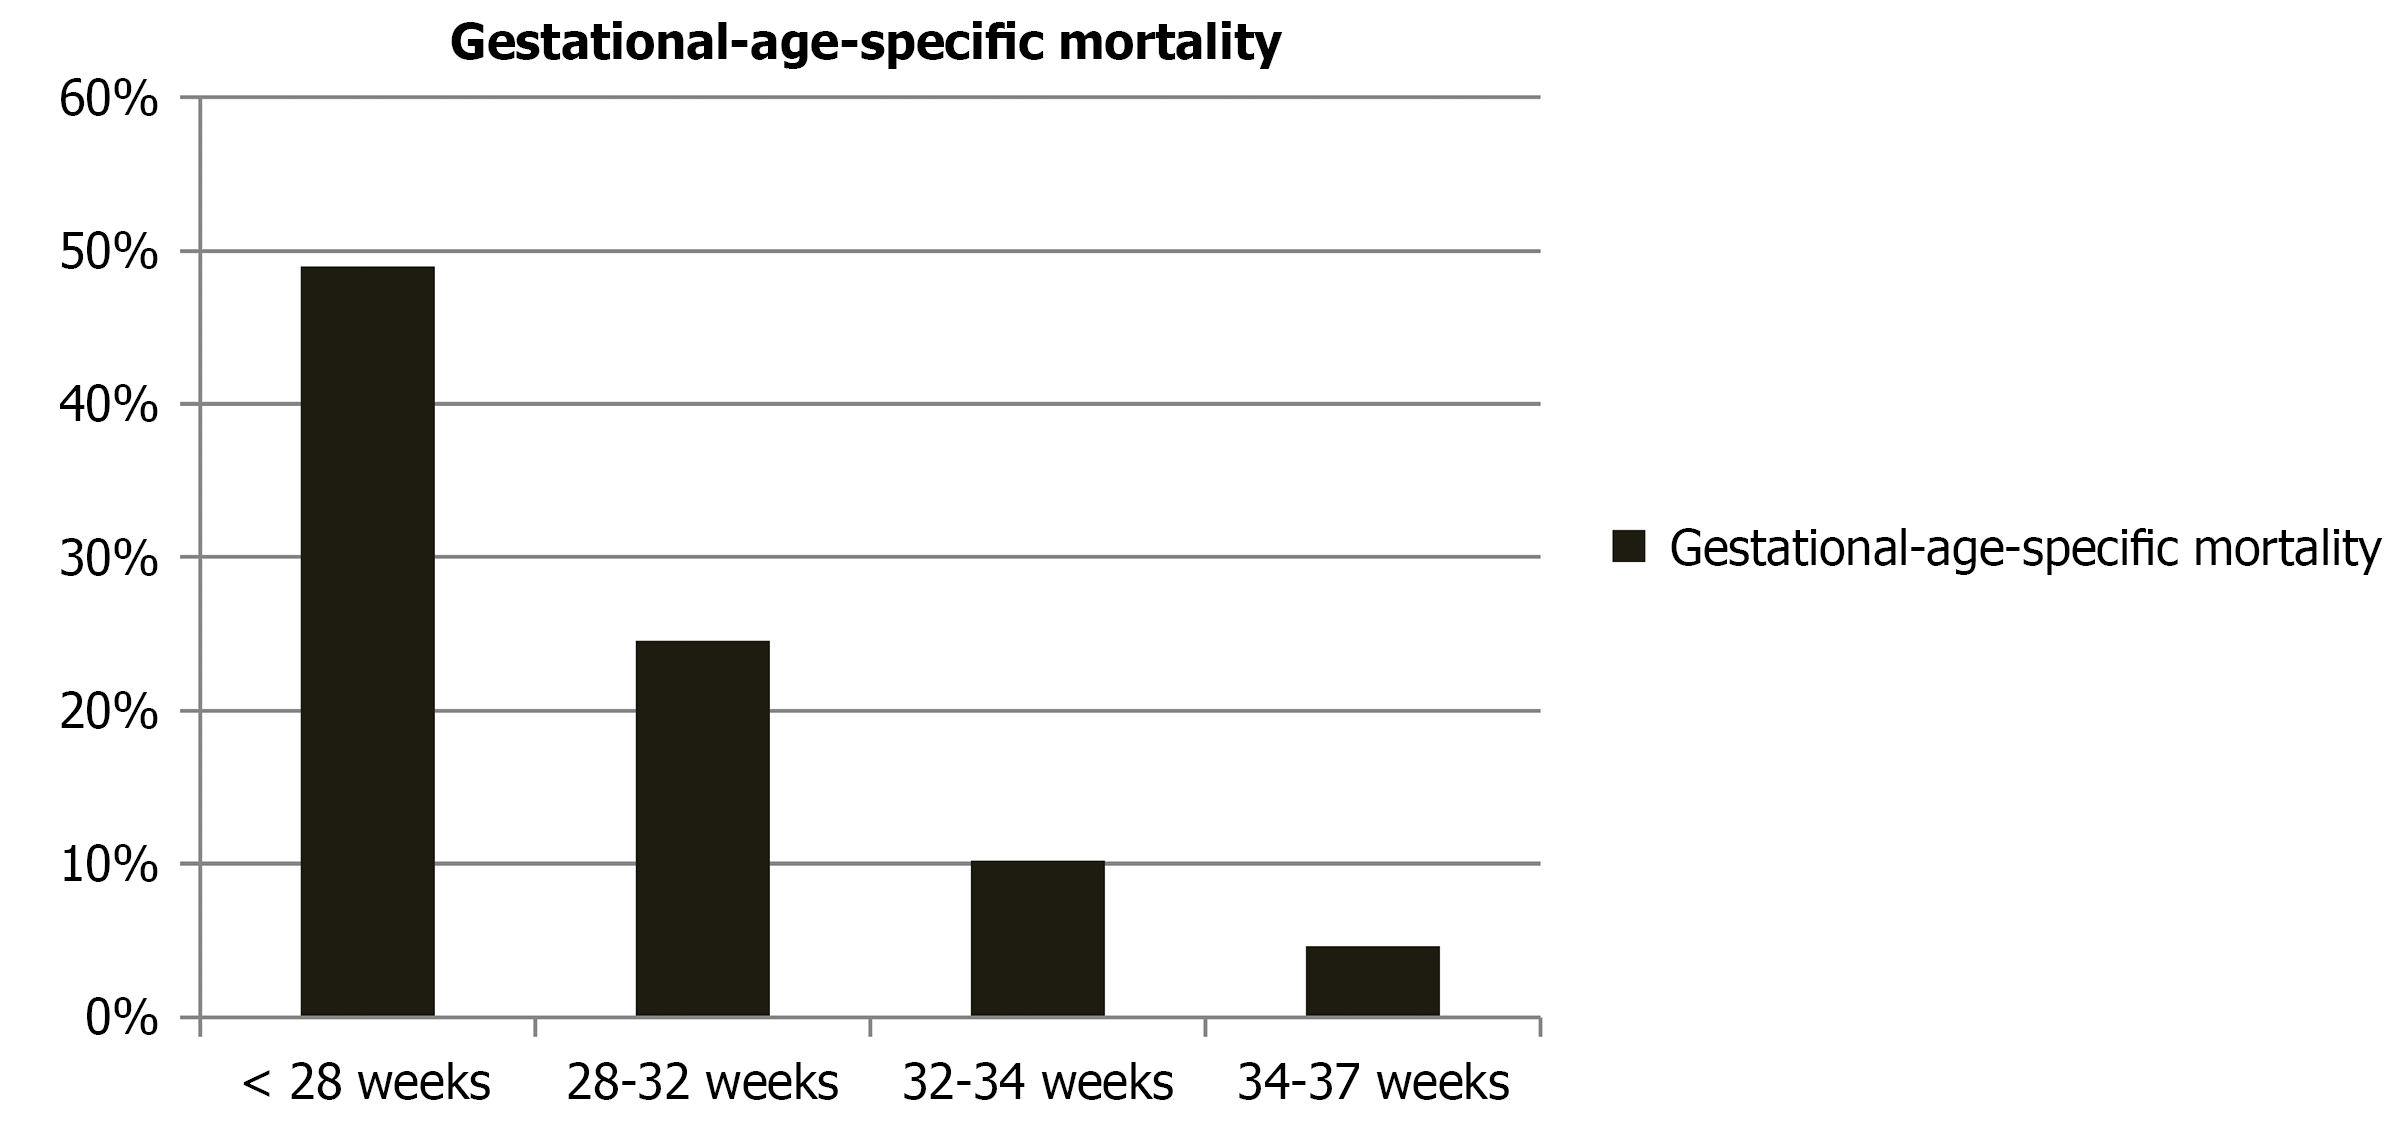
Figure 2 Mortality gradient by gestational age among preterm neonates.
Demonstrates gestational age-specific in-hospital mortality rates among preterm neonates. Mortality showed a marked inverse relationship with advancing gestational age, decreasing from 49.3% among extremely preterm neonates (< 28 weeks) to 24.8% in very preterm (28-31+6 weeks), 10.2% in moderate preterm (32-33+6 weeks), and 4.6% in late preterm infants (34-36+6 weeks). Mortality rates were calculated excluding neonates discharged against medical advice from the denominator.
- Citation: Patil PN, Khan Z, Patel M, Mahyavanshi DK. Patterns of preterm admission, morbidity, and mortality in a tribal-district neonatal intensive care unit: A retrospective cohort study. World J Clin Pediatr 2026; 15(3): 118603
- URL: https://www.wjgnet.com/2219-2808/full/v15/i3/118603.htm
- DOI: https://dx.doi.org/10.5409/wjcp.118603