Copyright
©The Author(s) 2025.
World J Clin Pediatr. Dec 9, 2025; 14(4): 113328
Published online Dec 9, 2025. doi: 10.5409/wjcp.v14.i4.113328
Published online Dec 9, 2025. doi: 10.5409/wjcp.v14.i4.113328
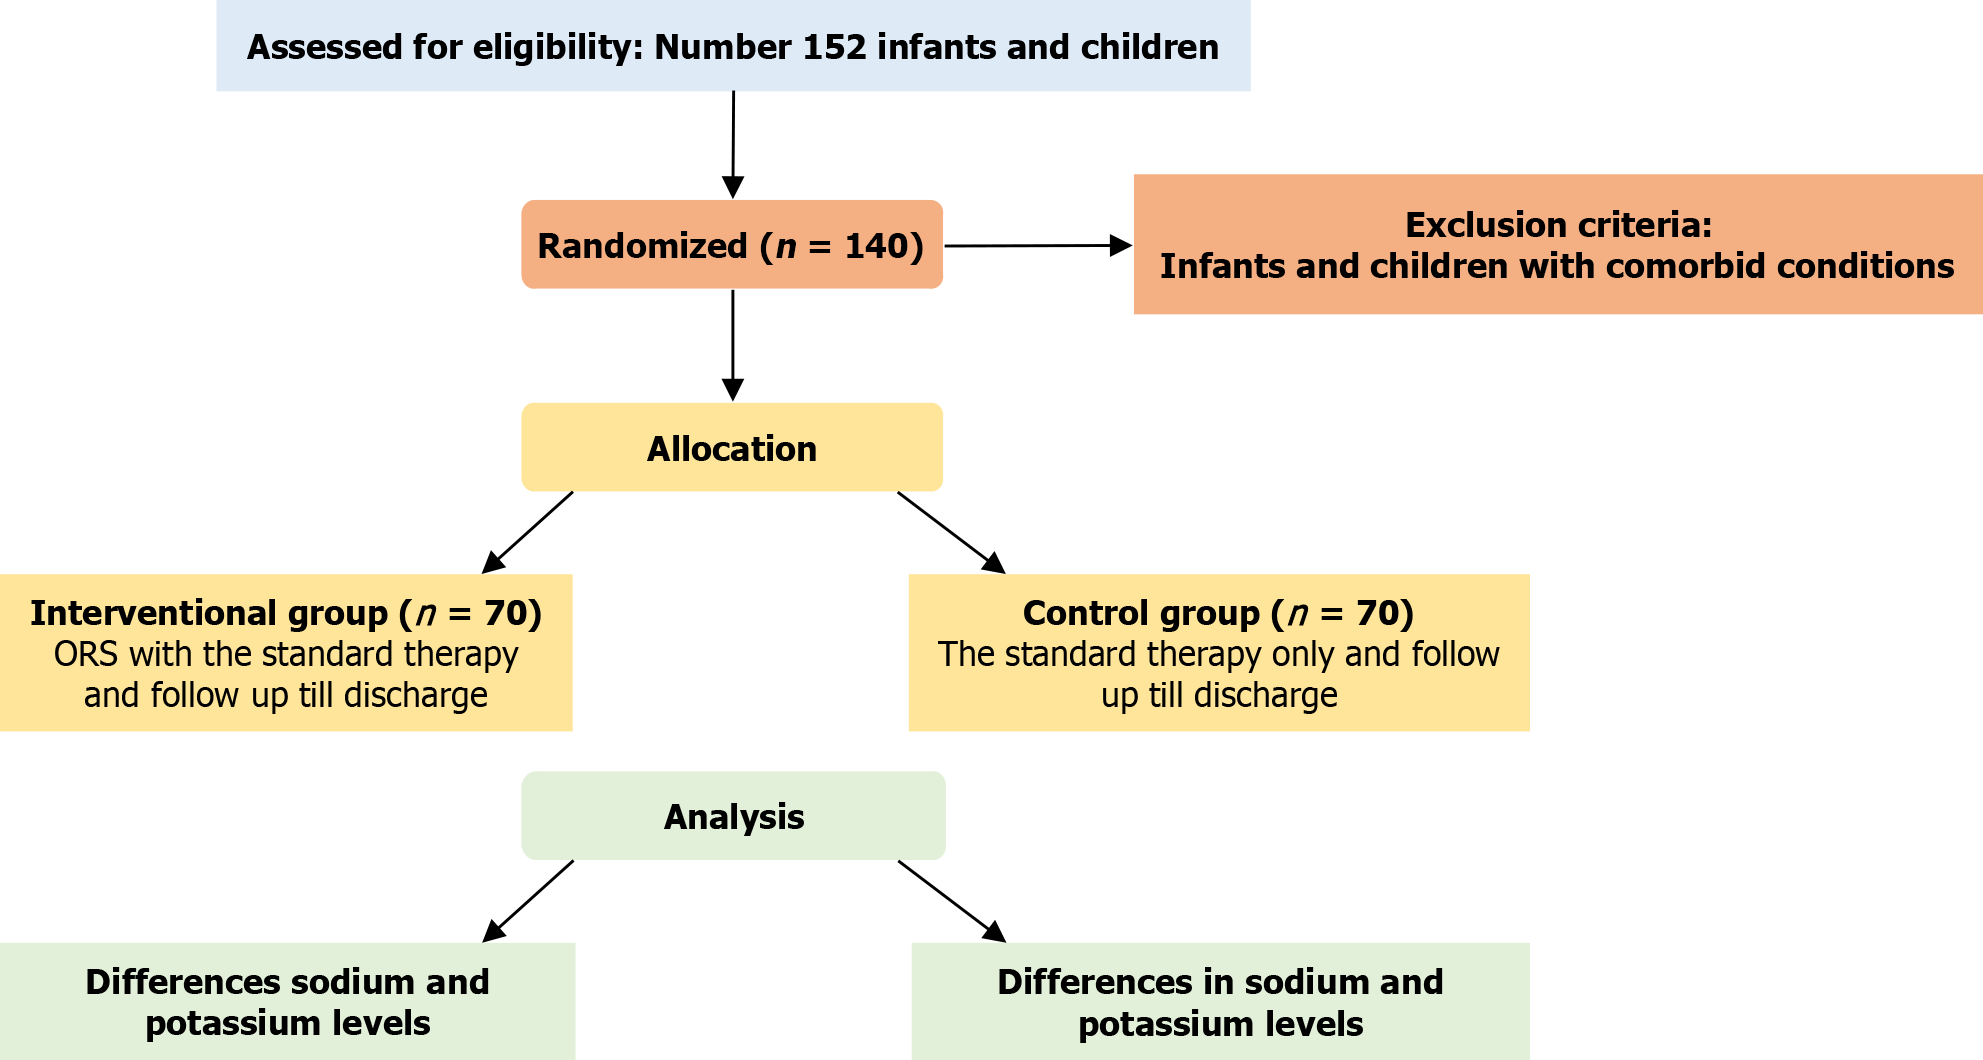
Figure 1 Flow chart of the study according to the CONSORT checklist.
ORS: Oral rehydration solution.
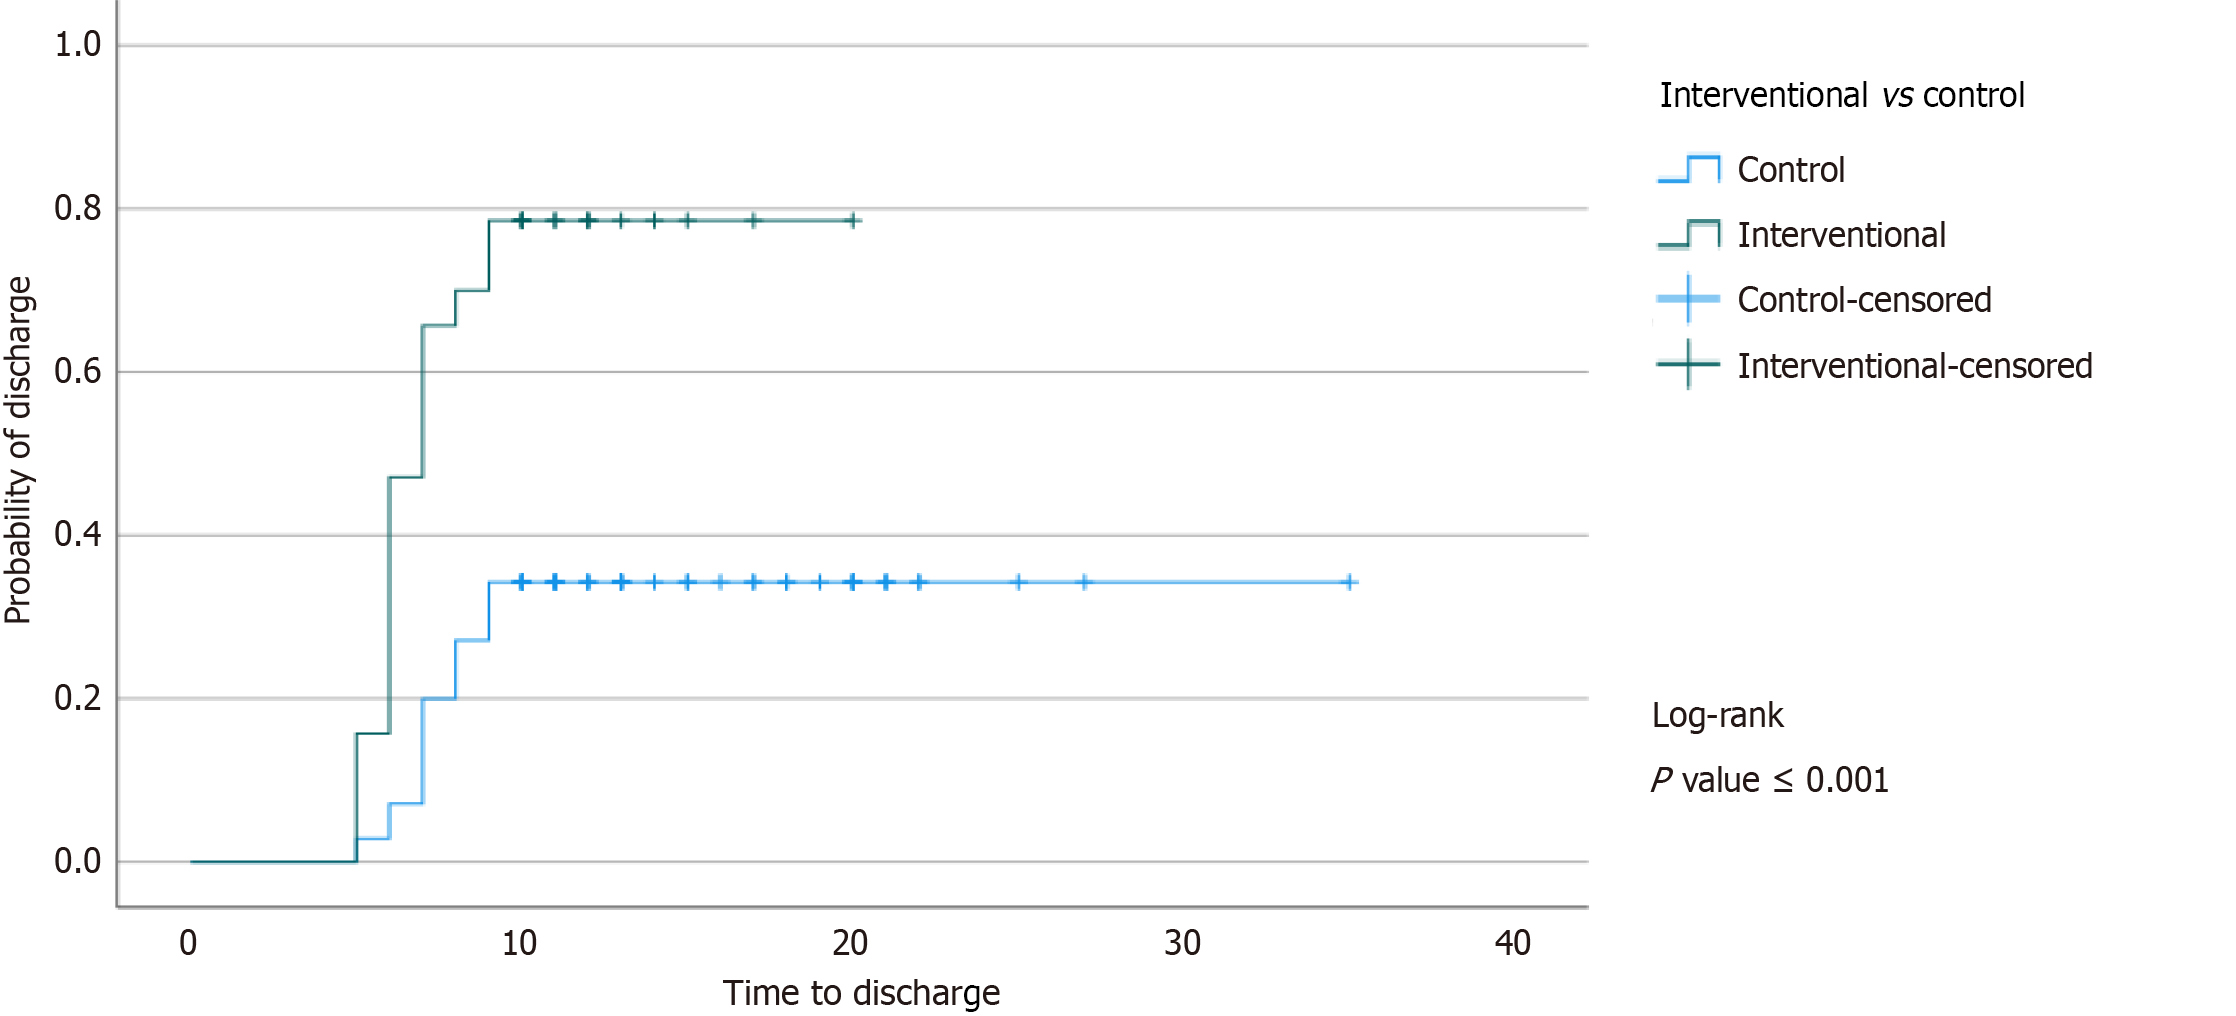
Figure 2 Kaplan-Meier curve for time to discharge in the intervention and control groups.
Children in the intervention group had a significantly shorter time to discharge than those in the control group did.
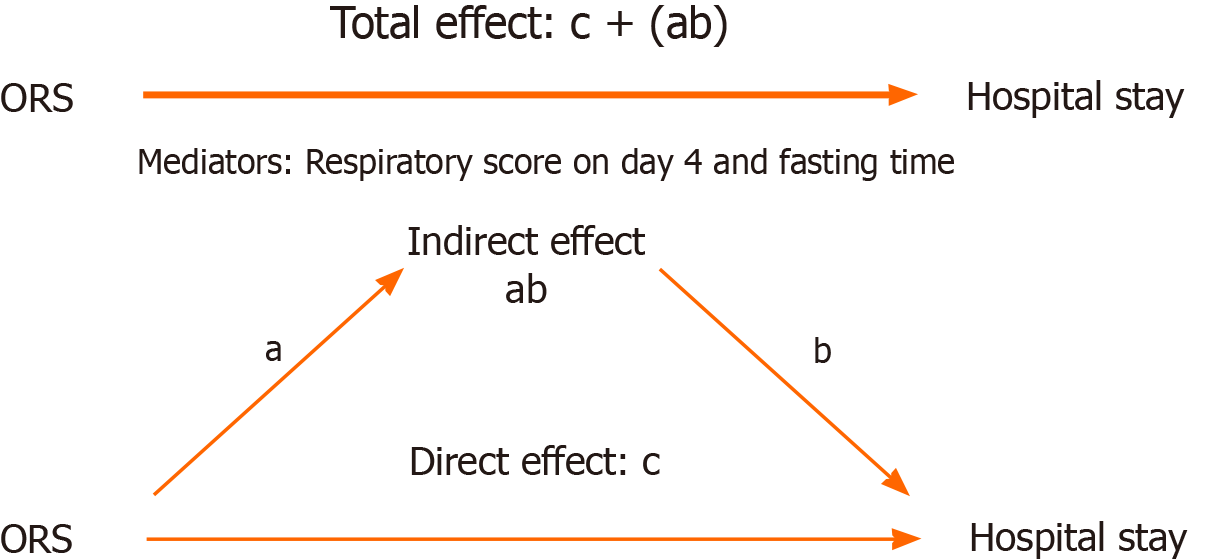
Figure 3 Path diagram for oral rehydration solution supplementation showing the direct effect of oral rehydration solution and the indirect effects of mediators and the total effect.
a and b: Indirect effect of the mediators; c: Direct effect of oral rehydration solution. ORS: Oral rehydration solution.
- Citation: Atef Abdelsattar Ibrahim H, Agha M, Taha M. Effects of oral rehydration solution-based prophylactic sodium supplementation on clinical outcomes in pediatric pneumonia: A randomized controlled trial. World J Clin Pediatr 2025; 14(4): 113328
- URL: https://www.wjgnet.com/2219-2808/full/v14/i4/113328.htm
- DOI: https://dx.doi.org/10.5409/wjcp.v14.i4.113328


