©The Author(s) 2019.
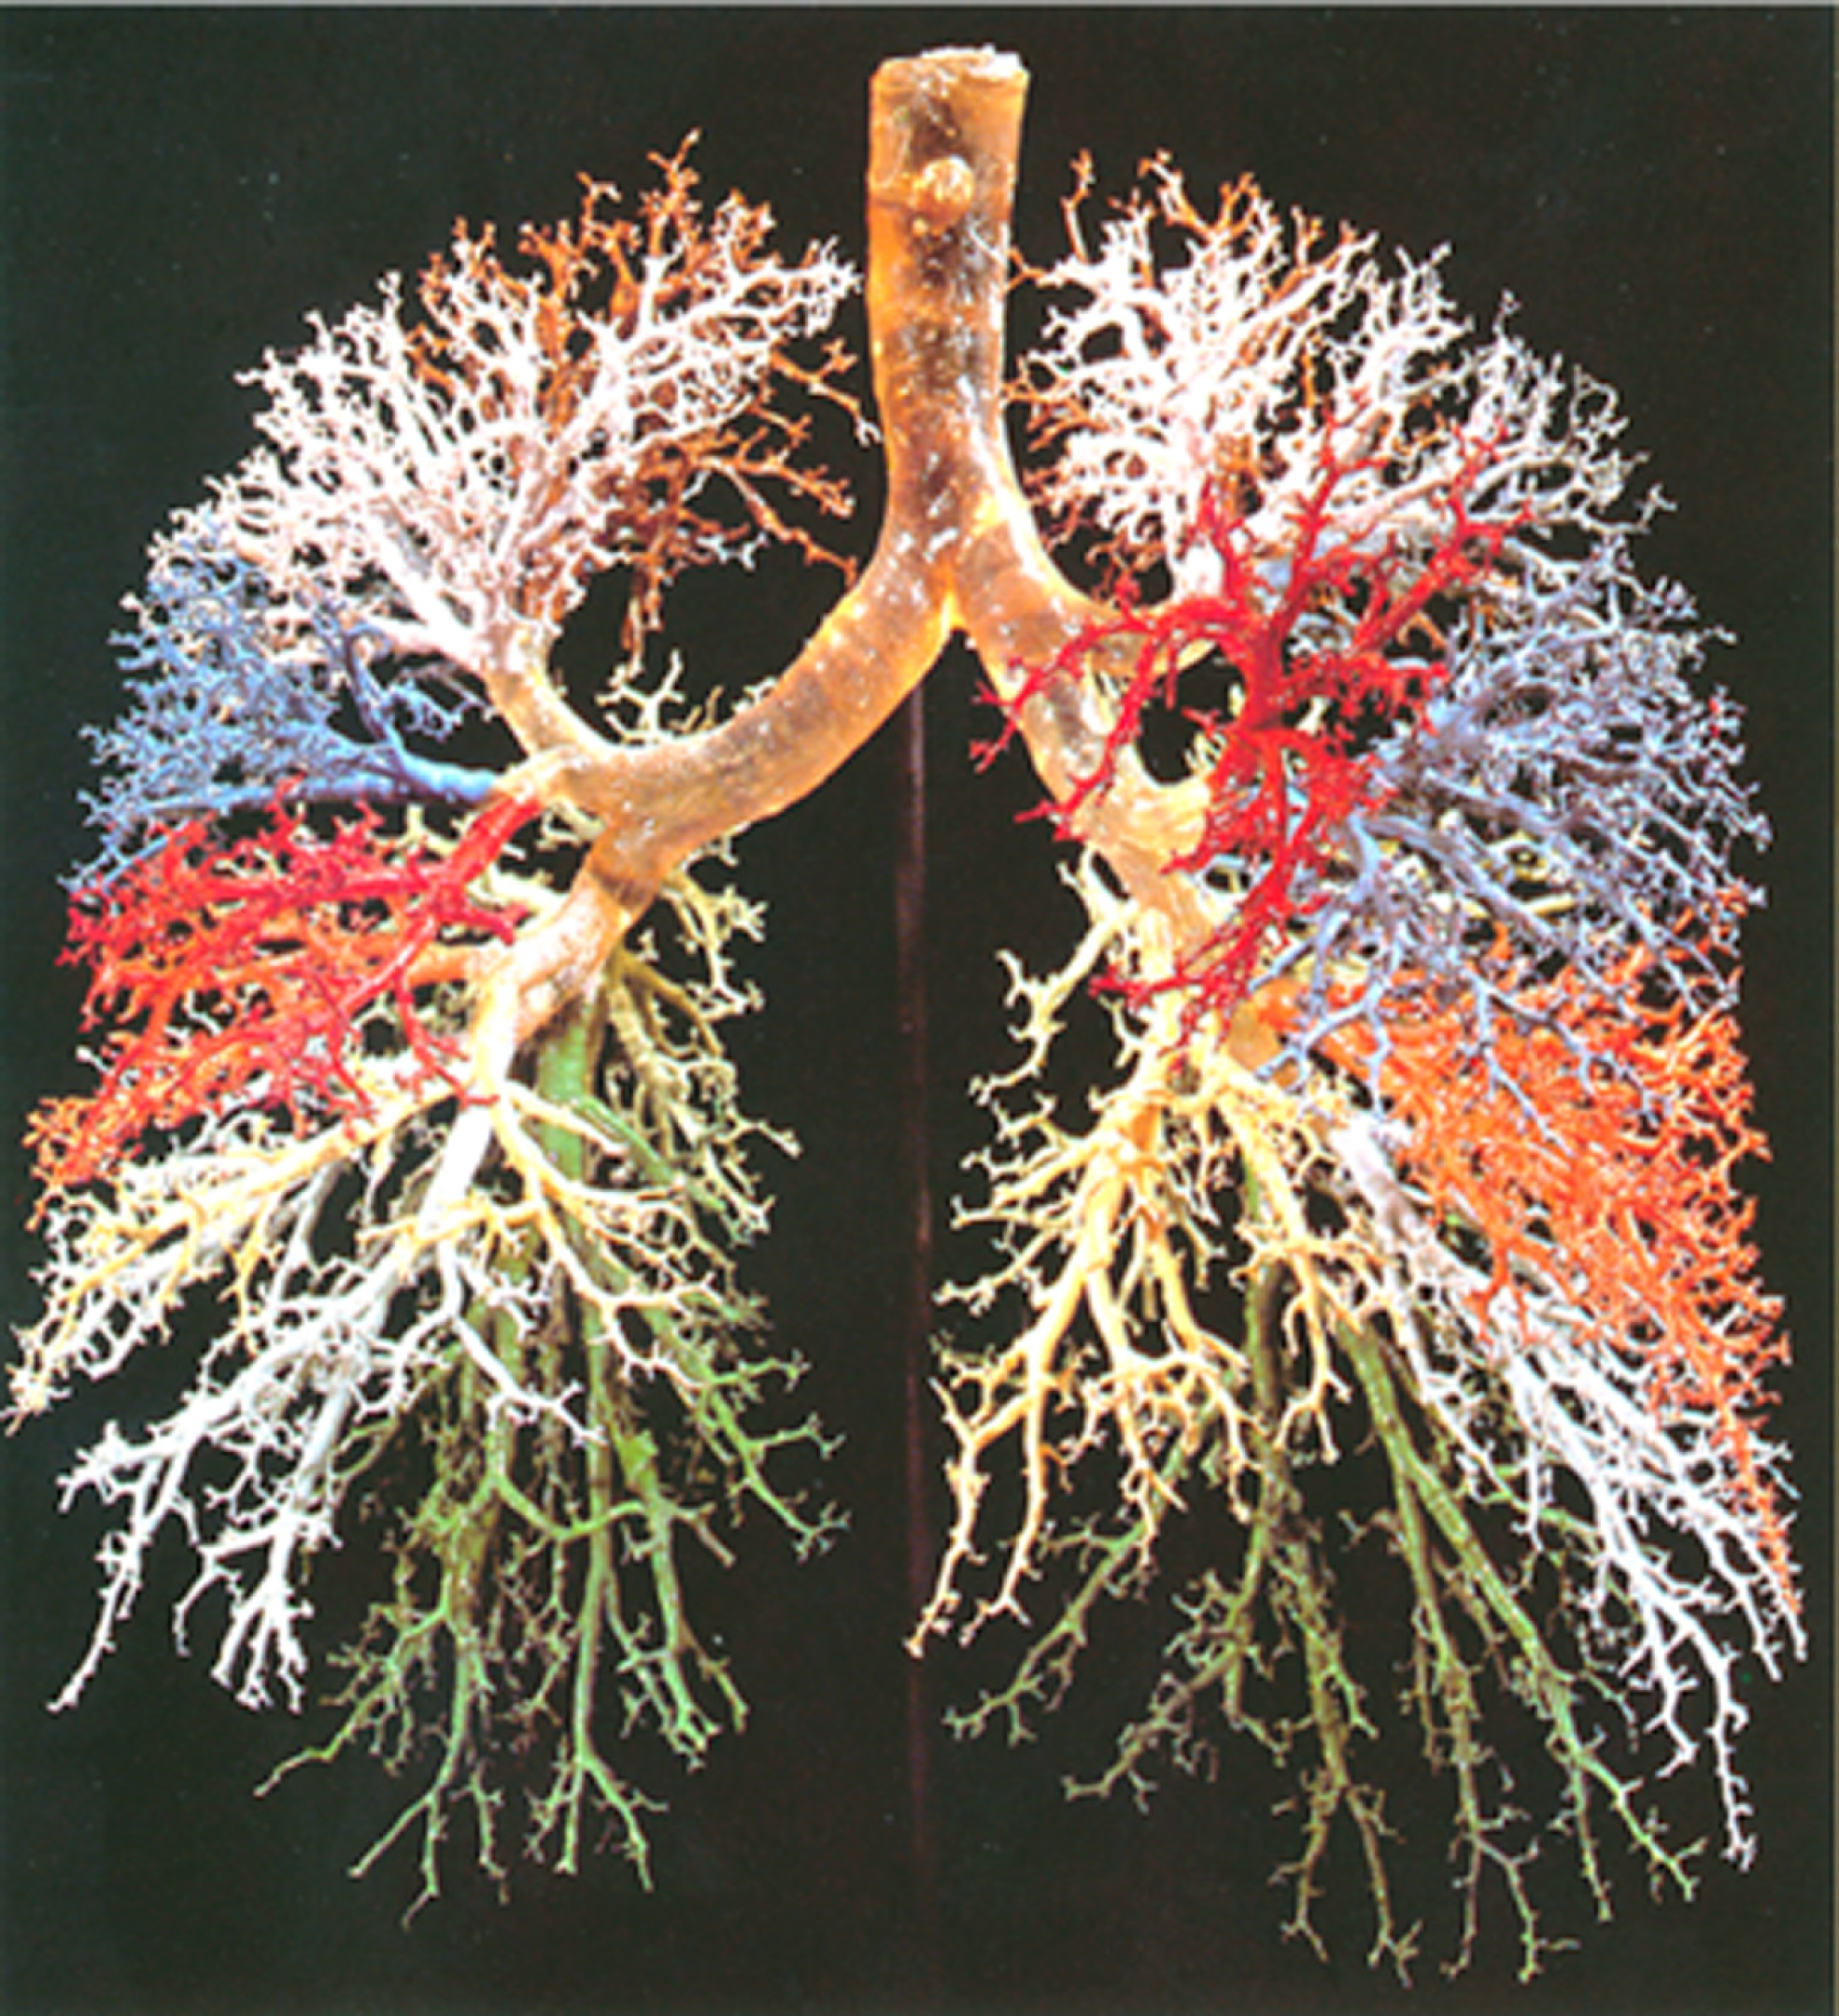
Figure 1 Resin cast of human lung.
Complicated dichotomously branching tree of conducting airways is exhibited. Adopted from ref[1].
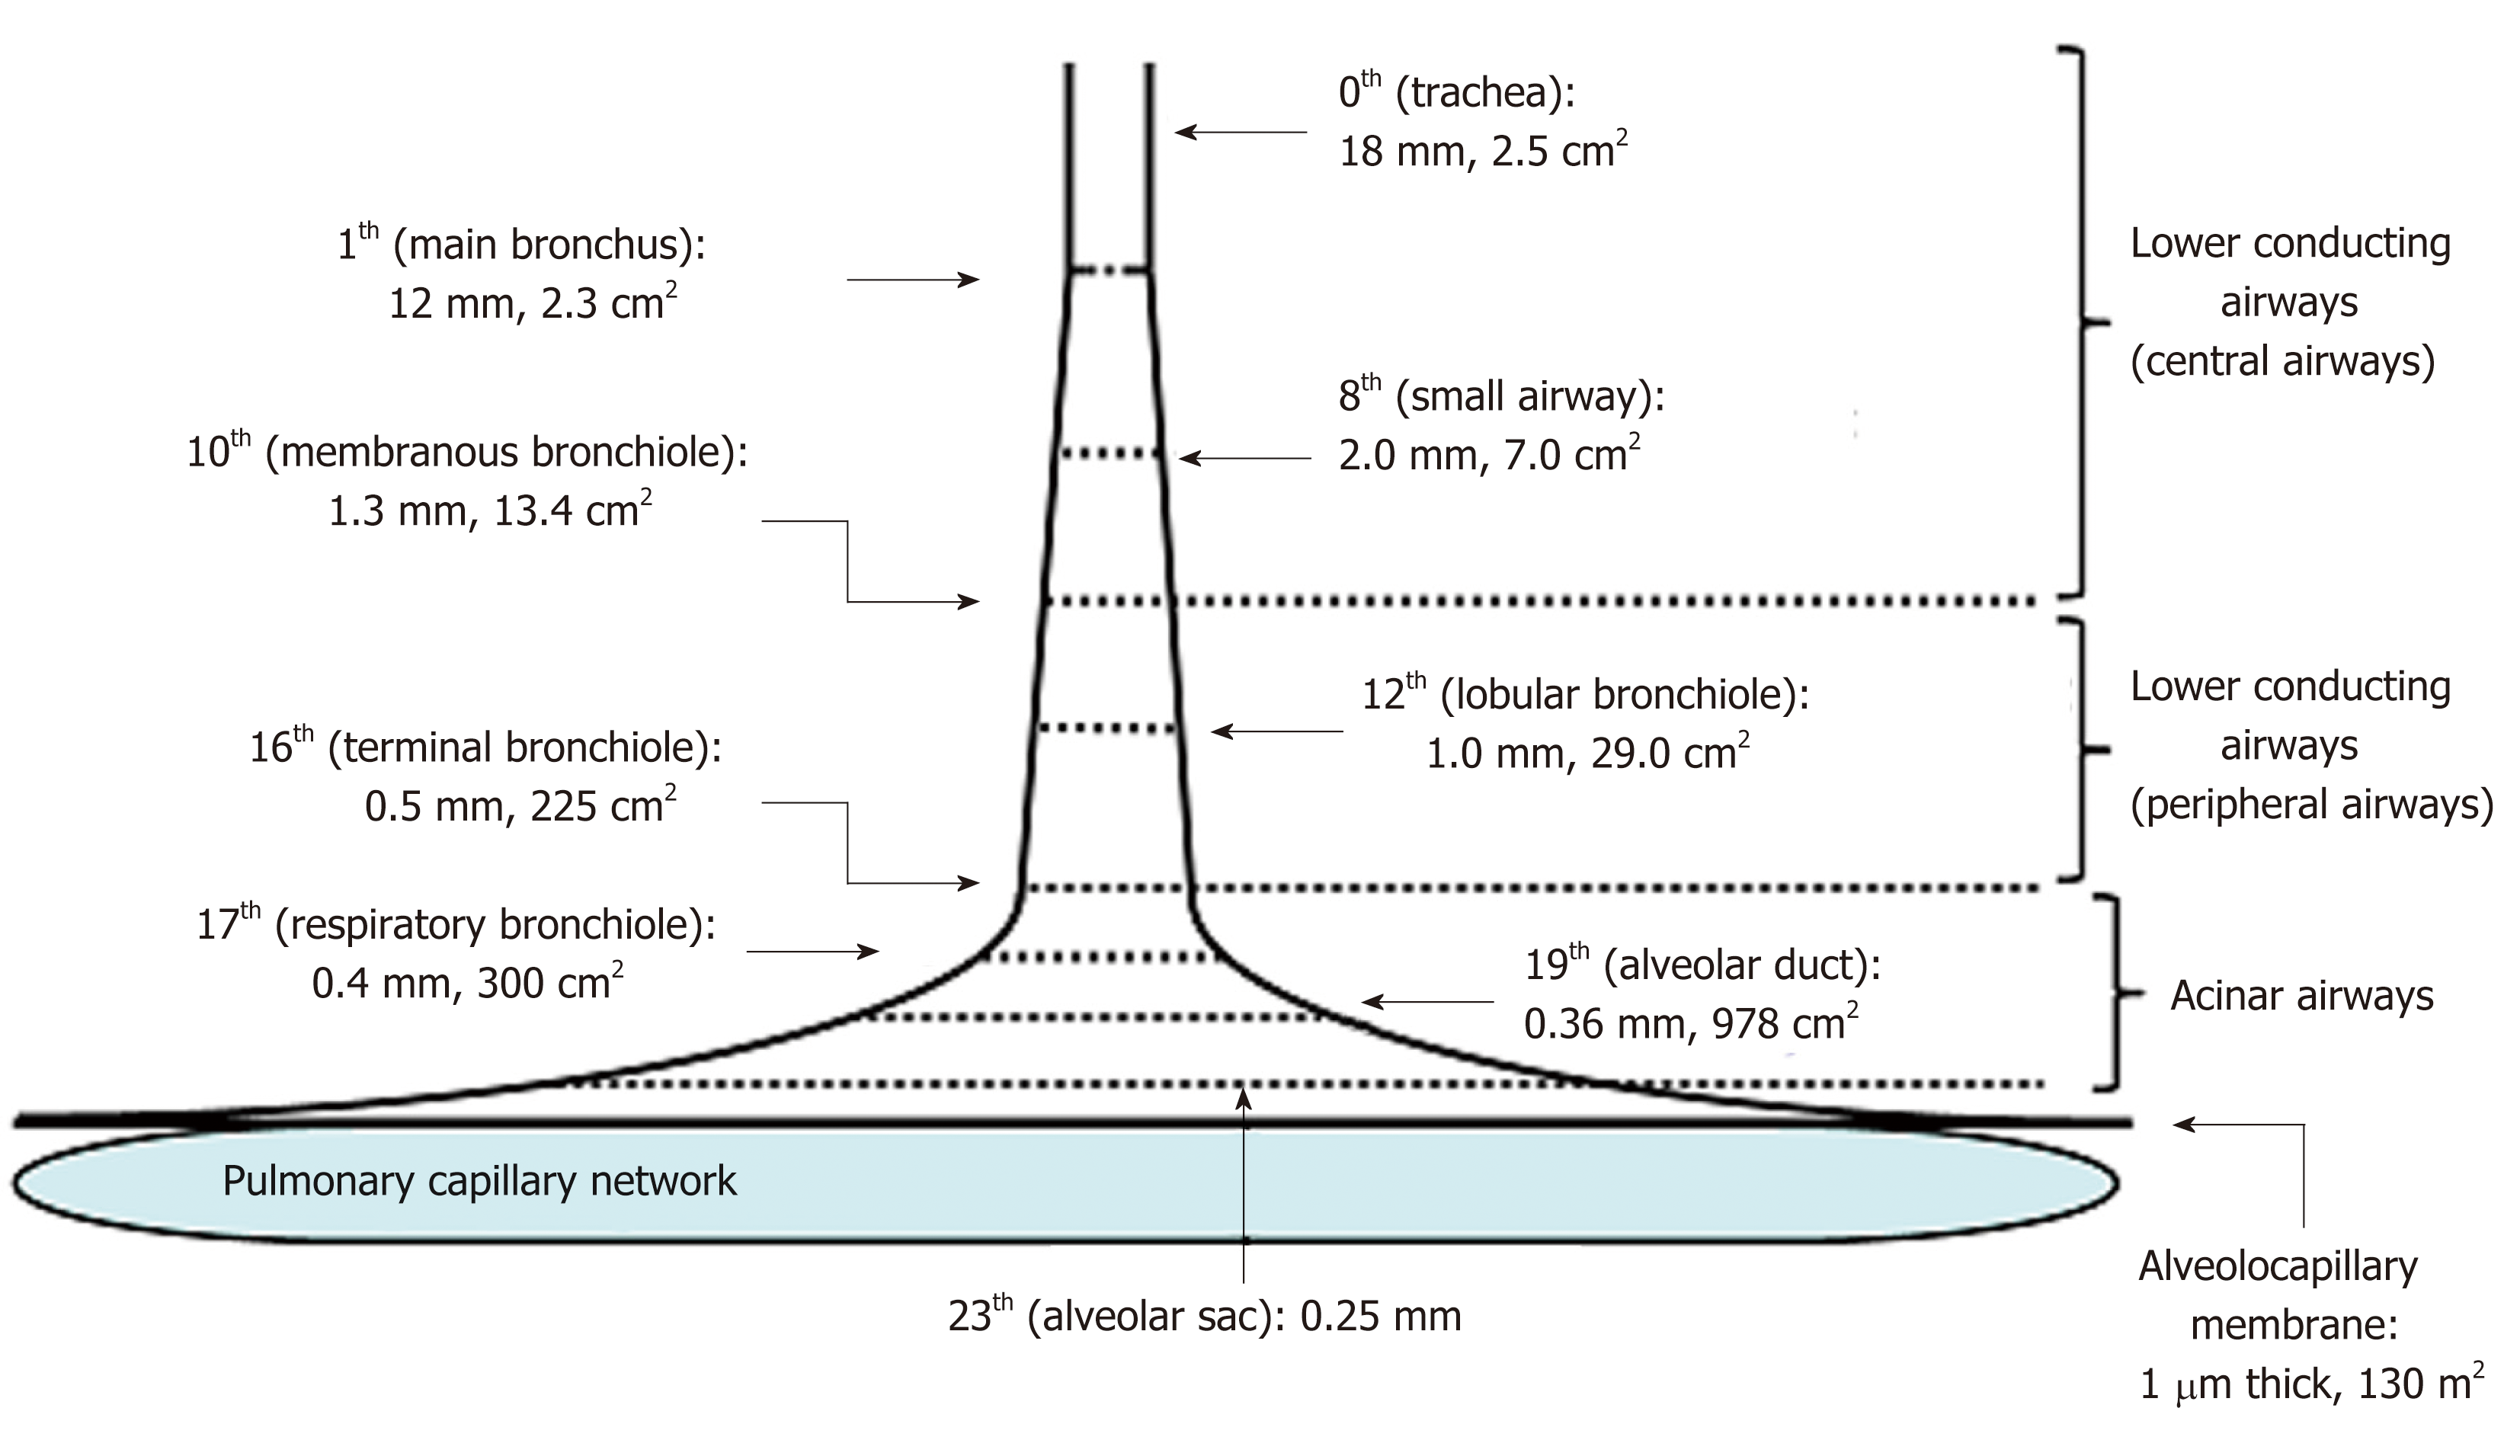
Figure 2 Schematic presentation of effective diameter and cross-sectional area along lower conducting airways and acinar airways (trumpet or thumbtack model).
Generations of branching tree and diameter as well as cross-sectional area in each generation are obtained from model A of Weibel[2]. Lower conducting airways are classified into two routes; i.e., central airways [generation from zero (trachea) to 9th] and peripheral airways (generation from 10th to 16th, in which 16th generation corresponds to terminal bronchiole). Peripheral airways are characterized by membrane bronchioles, whereas small airways are defined by their diameters of less than 2.0 mm originating in the 8th generation. Airways from the 17th generation (respiratory bronchiole) to the 23th generation (alveolar sac) are not included in peripheral airways. Instead, they are defined as acinar (alveolated) airways (acinus indicates that defined by Loeschcke). This is because acinar airways function by carrying gas and exchanging gas. Alveolar sacs end in alveoli formed by alveolar walls containing alveolocapillary membranes and capillary networks. Thickness of the alveolocapillary membrane is about 1.0 μm and total cross-sectional area of the alveolocapillary membrane and capillary network is about 130 m2.
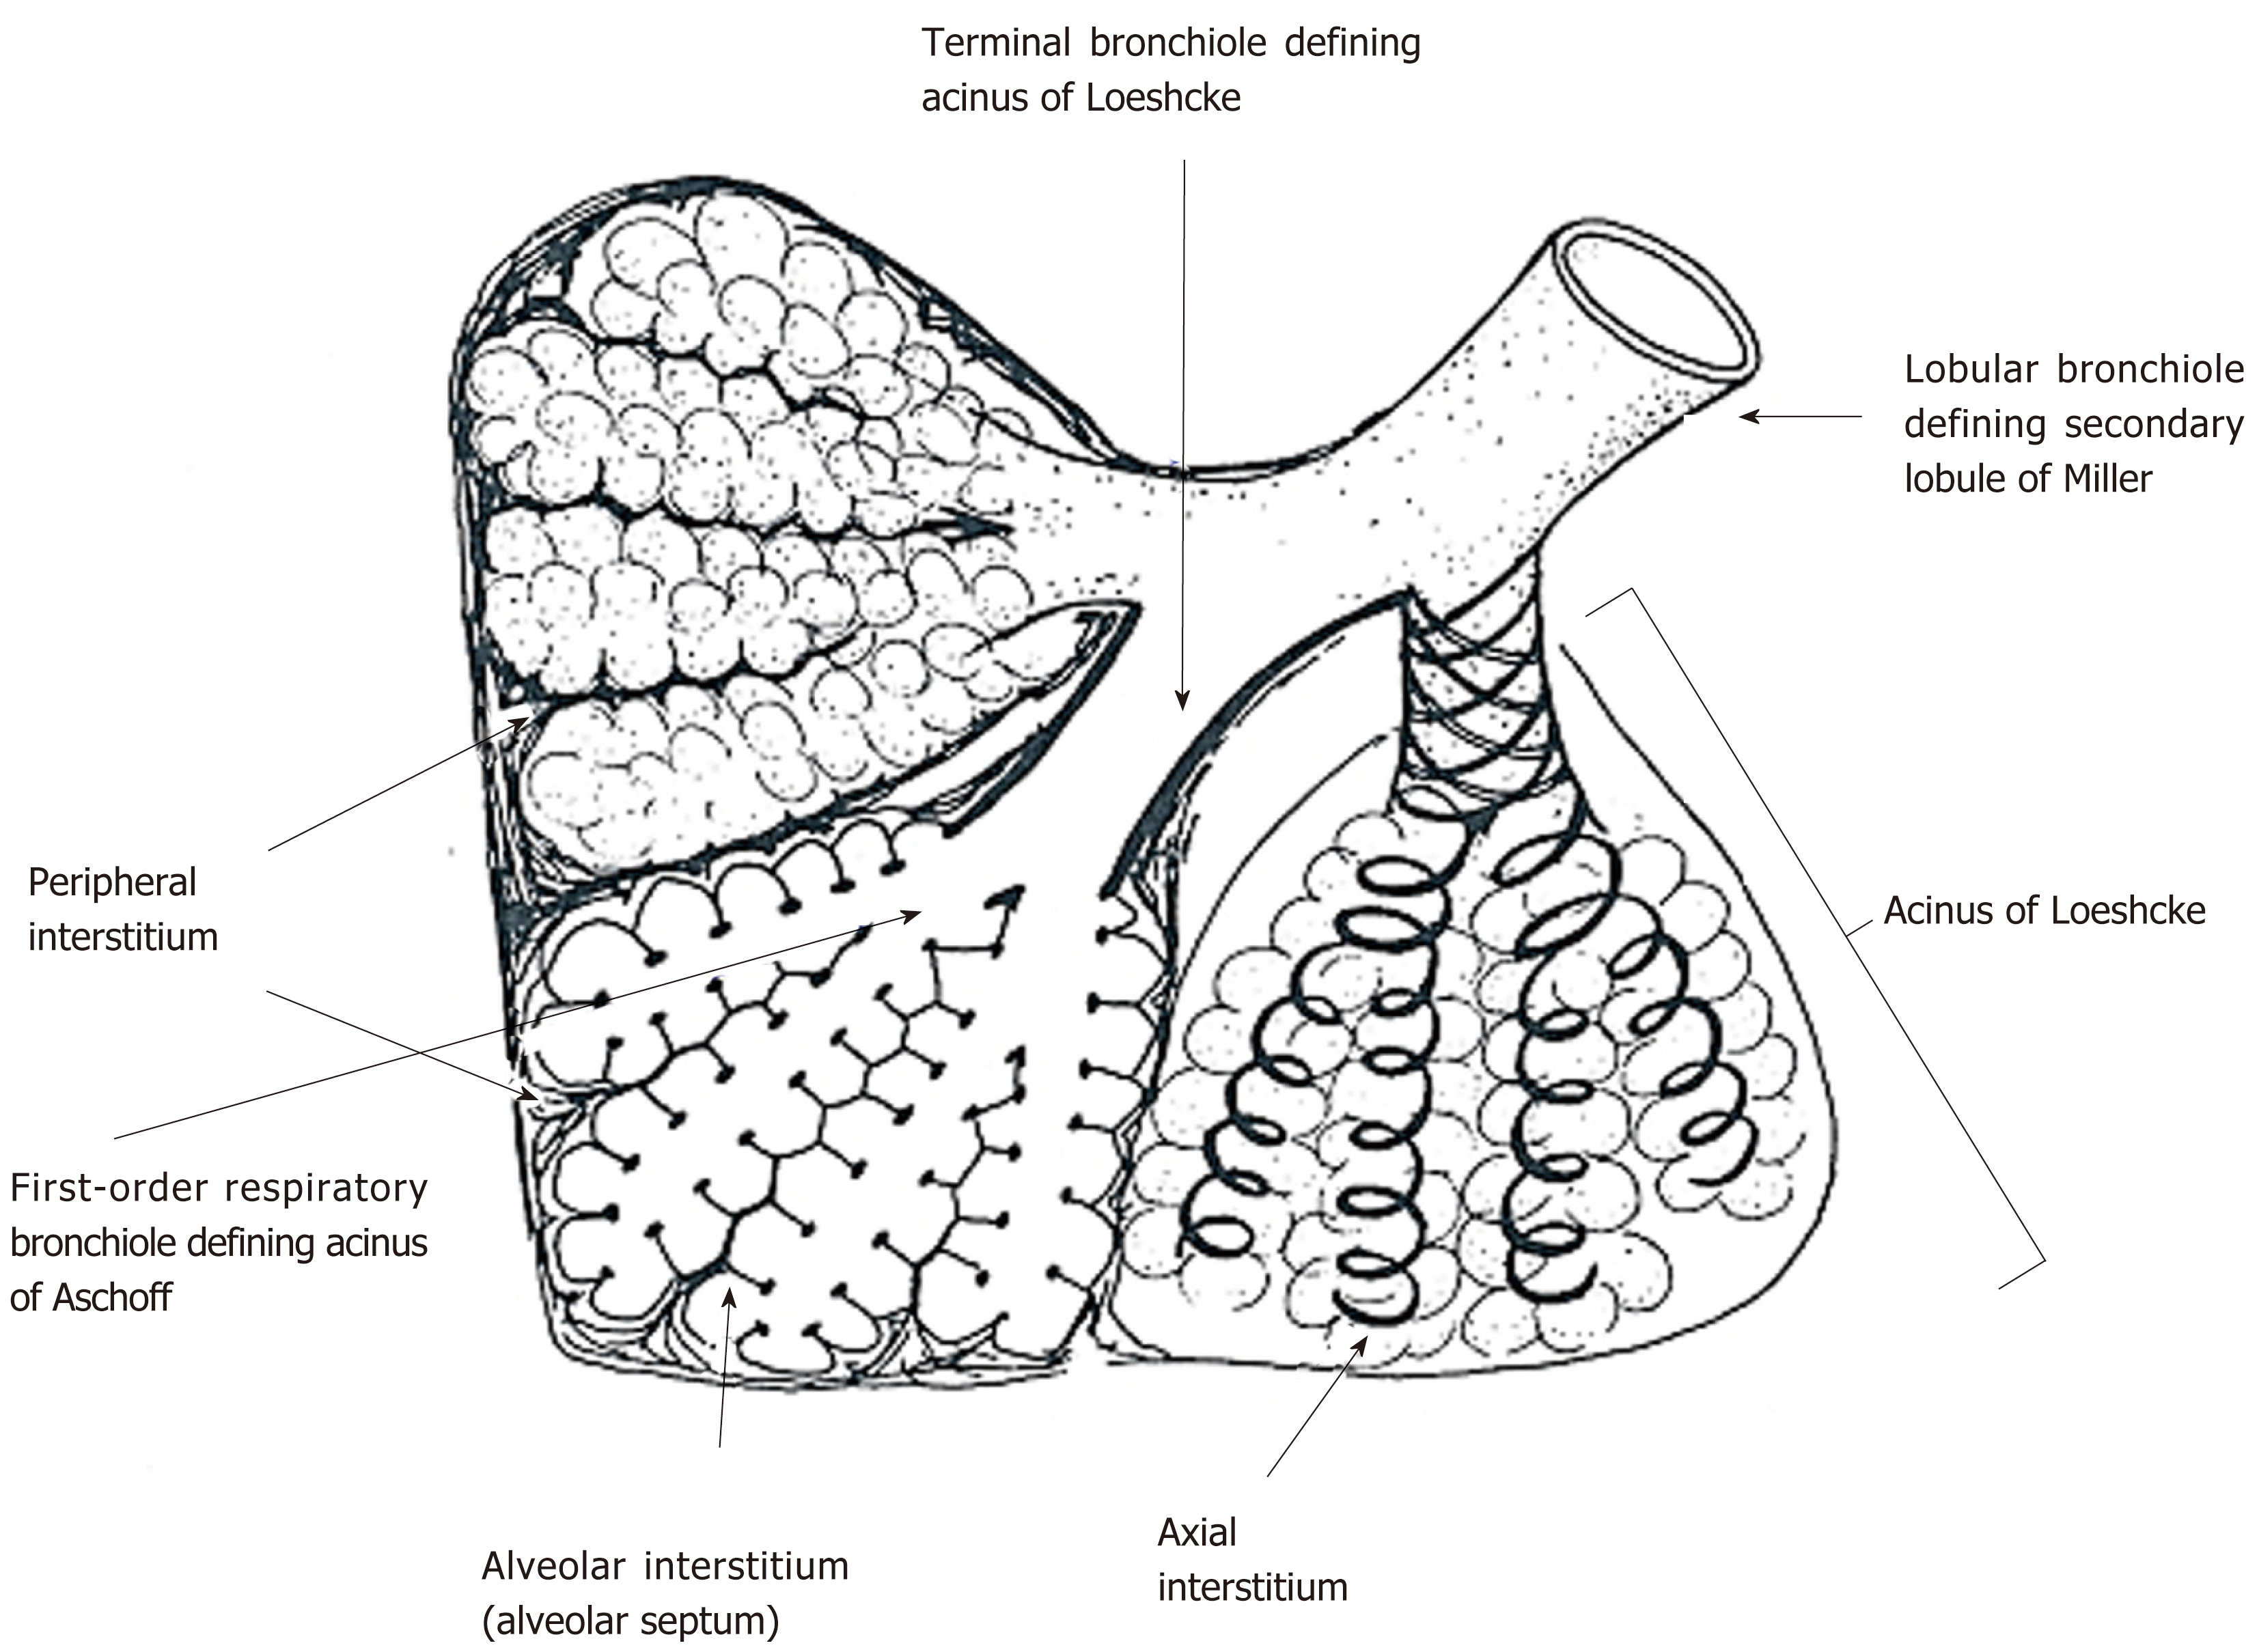
Figure 3 Secondary lobule and acinus.
Secondary lobule of Miller is defined by the area supplied by a lobular bronchiole while the acinus of Loeschcke is defined by the area supplied by a terminal bronchiole. Acinus of Aschoff is the area supplied by a first-order respiratory bronchiole. Secondary lobule of Miller is surrounded by fibrous connective tissue forming interlobular septum. In acini of Loeschcke and Aschoff, there are three important interstitial tissues, including peripheral interstitium, alveolar interstitium forming alveolar septum, and axial interstitium spirally surrounding airways, which begins at the alveolar duct extending to the hilum. Axial interstitium and alveolar interstitium are joined via intra-parenchymal interstitium and all interstitial tissues are in a serial linkage. Modified from ref[2].
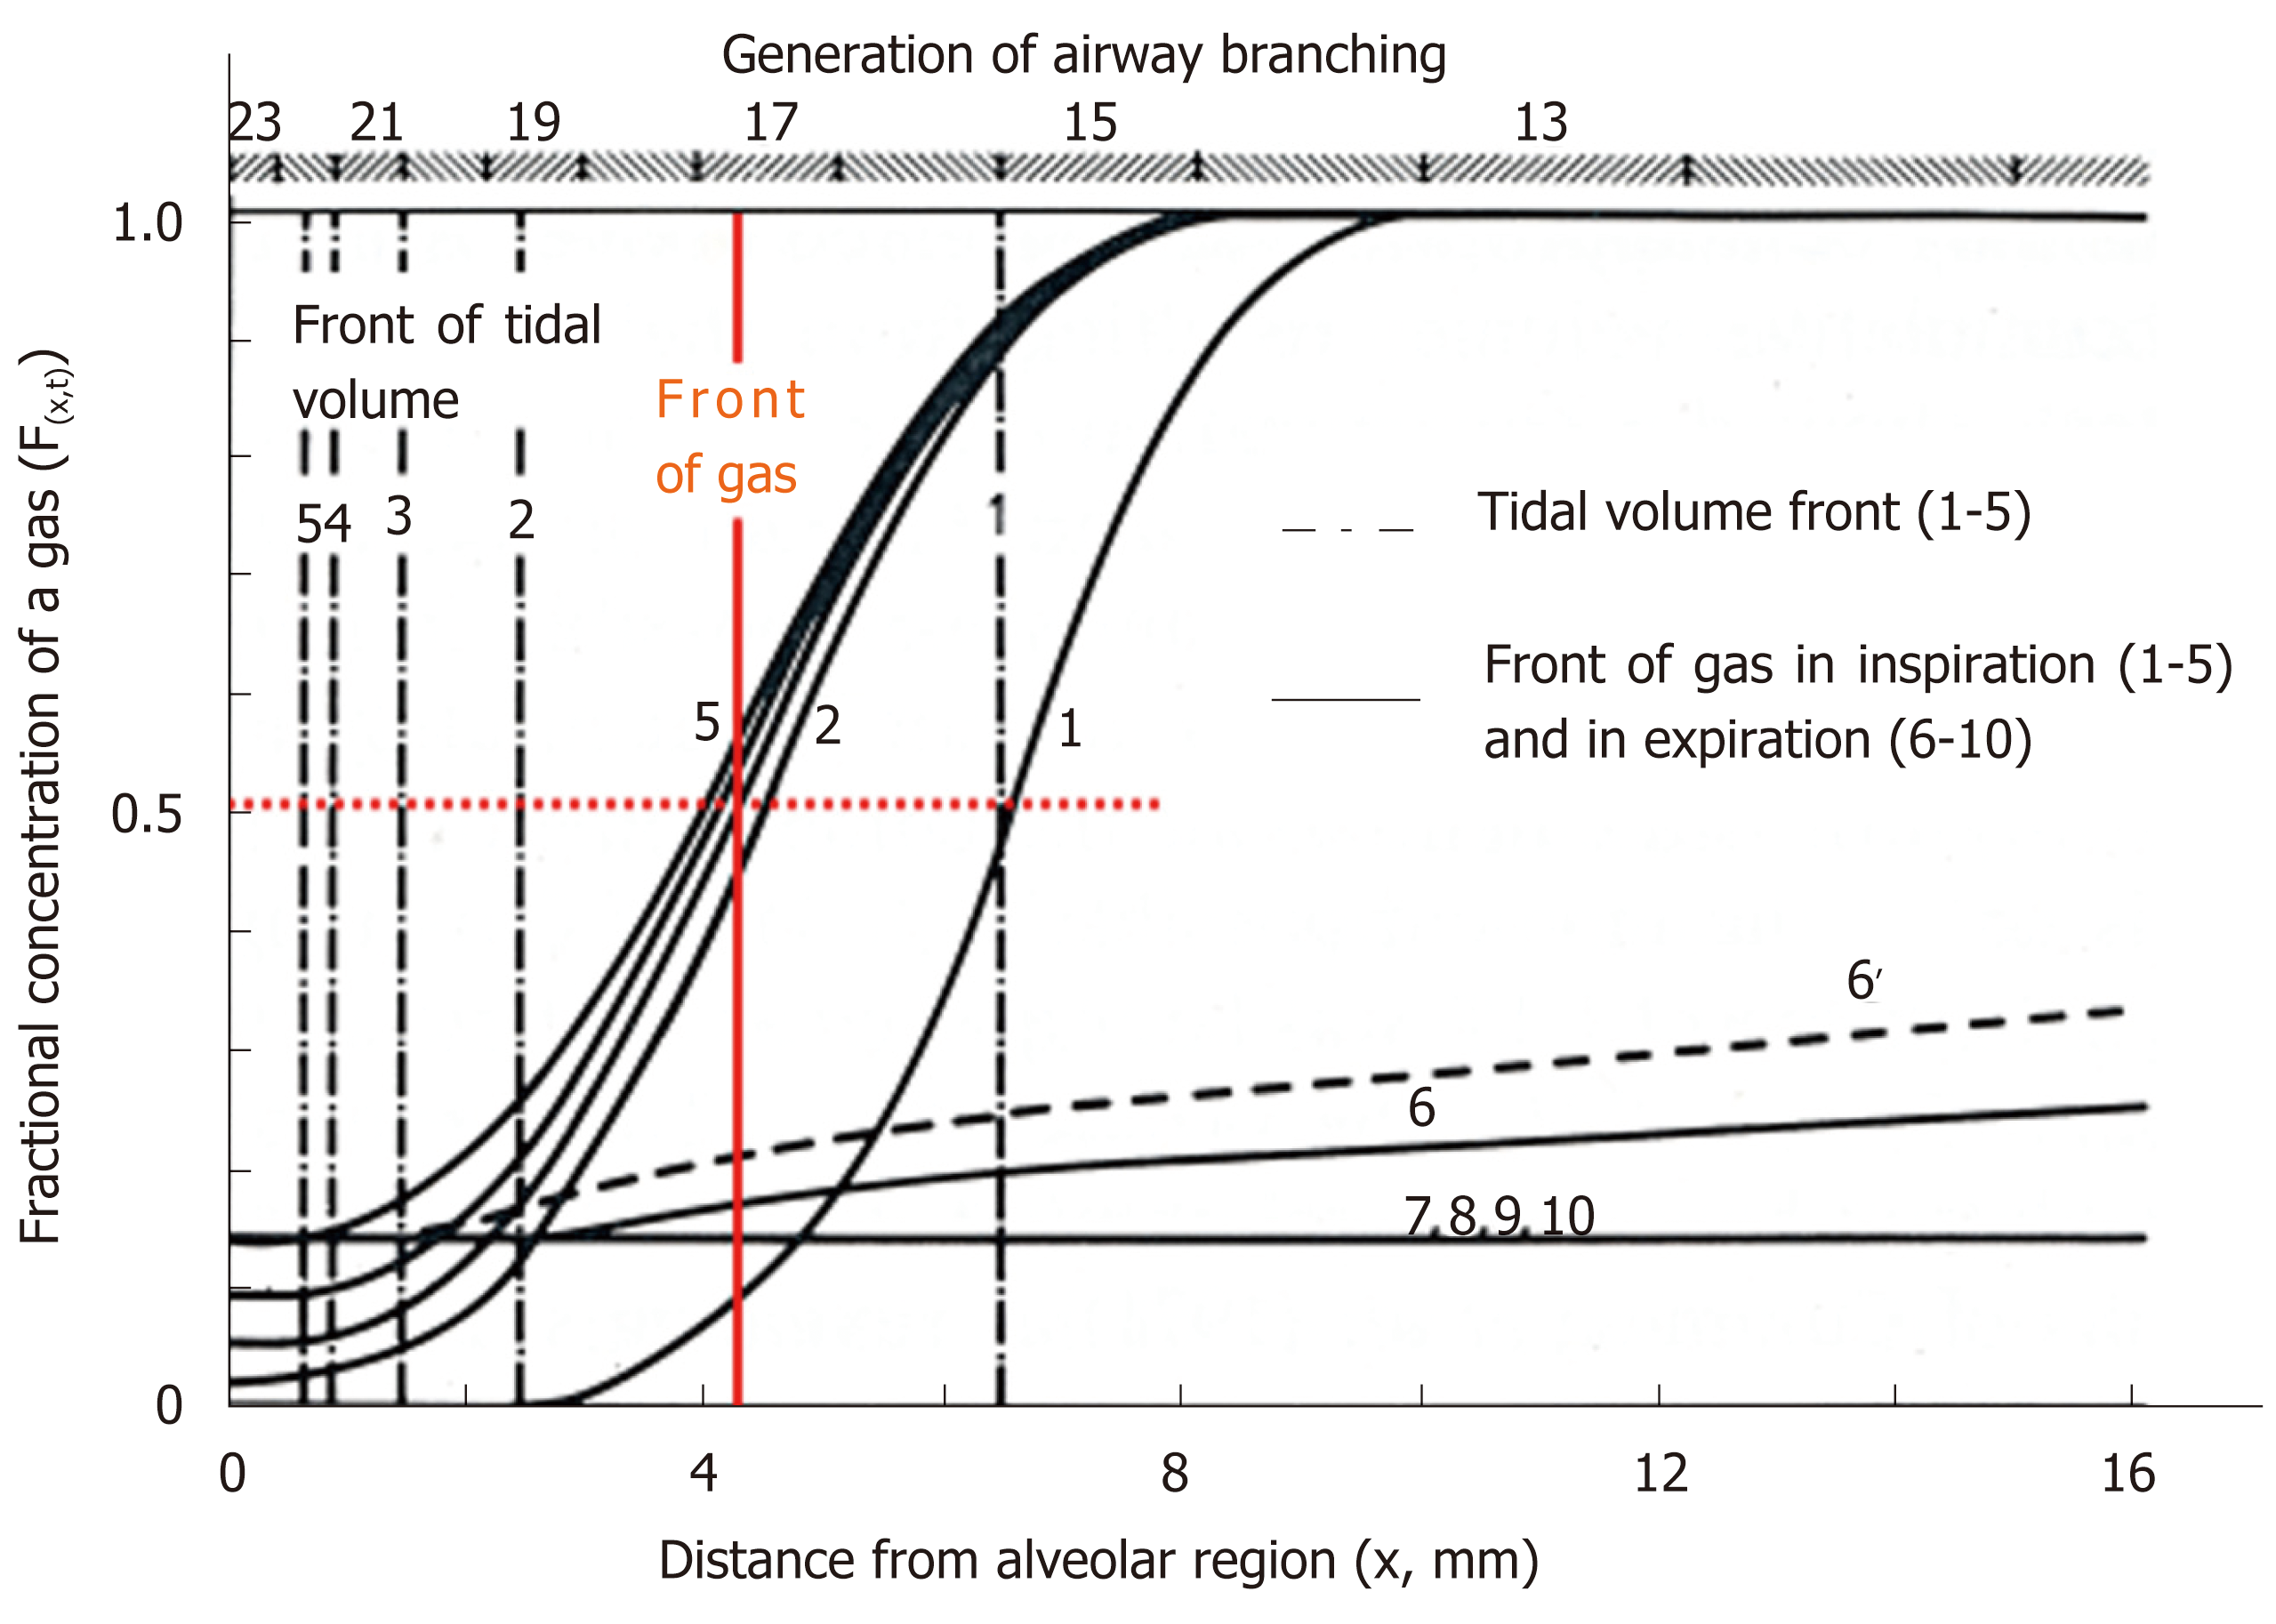
Figure 4 Concentration profiles along peripheral conducting airways and acinar airways during the respiratory cycle in thumbtack model.
Upper abscissa: generation of airway branching defined in model A of Weibel. Lower abscissa: axial distance from alveolar region. Ordinate: fractional concentration of the test gas. 100% O2 is inhaled (single breath) into and then exhaled from initially O2-free lung with constant flow (tidal volume: 500 mL) and constant lung volume (functional residual capacity: 3000 mL). O2 is assumed to not be absorbed into capillary blood (i.e., no gas exchange). Solid curves (black) indicate concentration profiles at successive equally timed periods during inspiration (1-5) and expiration (6-10). Dashed dotted lines (1-5) are tidal volume fronts (i.e., concentration fronts of non-diffusible tracer gas) during inspiration. Dashed line (6’) is a concentration profile calculated on assumption of no axial diffusion during expiratory phase corresponding to time point of solid line (6). Red solid line denotes “imaginary” boundary between common dead space and alveolar region conceptualized in classical gas-exchange theory. Boundary is defined by stationary gas front converting diffusional effect into equivalent convectional effect, which is formed at entrance of acinus of Aschoff (17th generation of branching tree). See text for detailed explanation. Modified from ref[46].
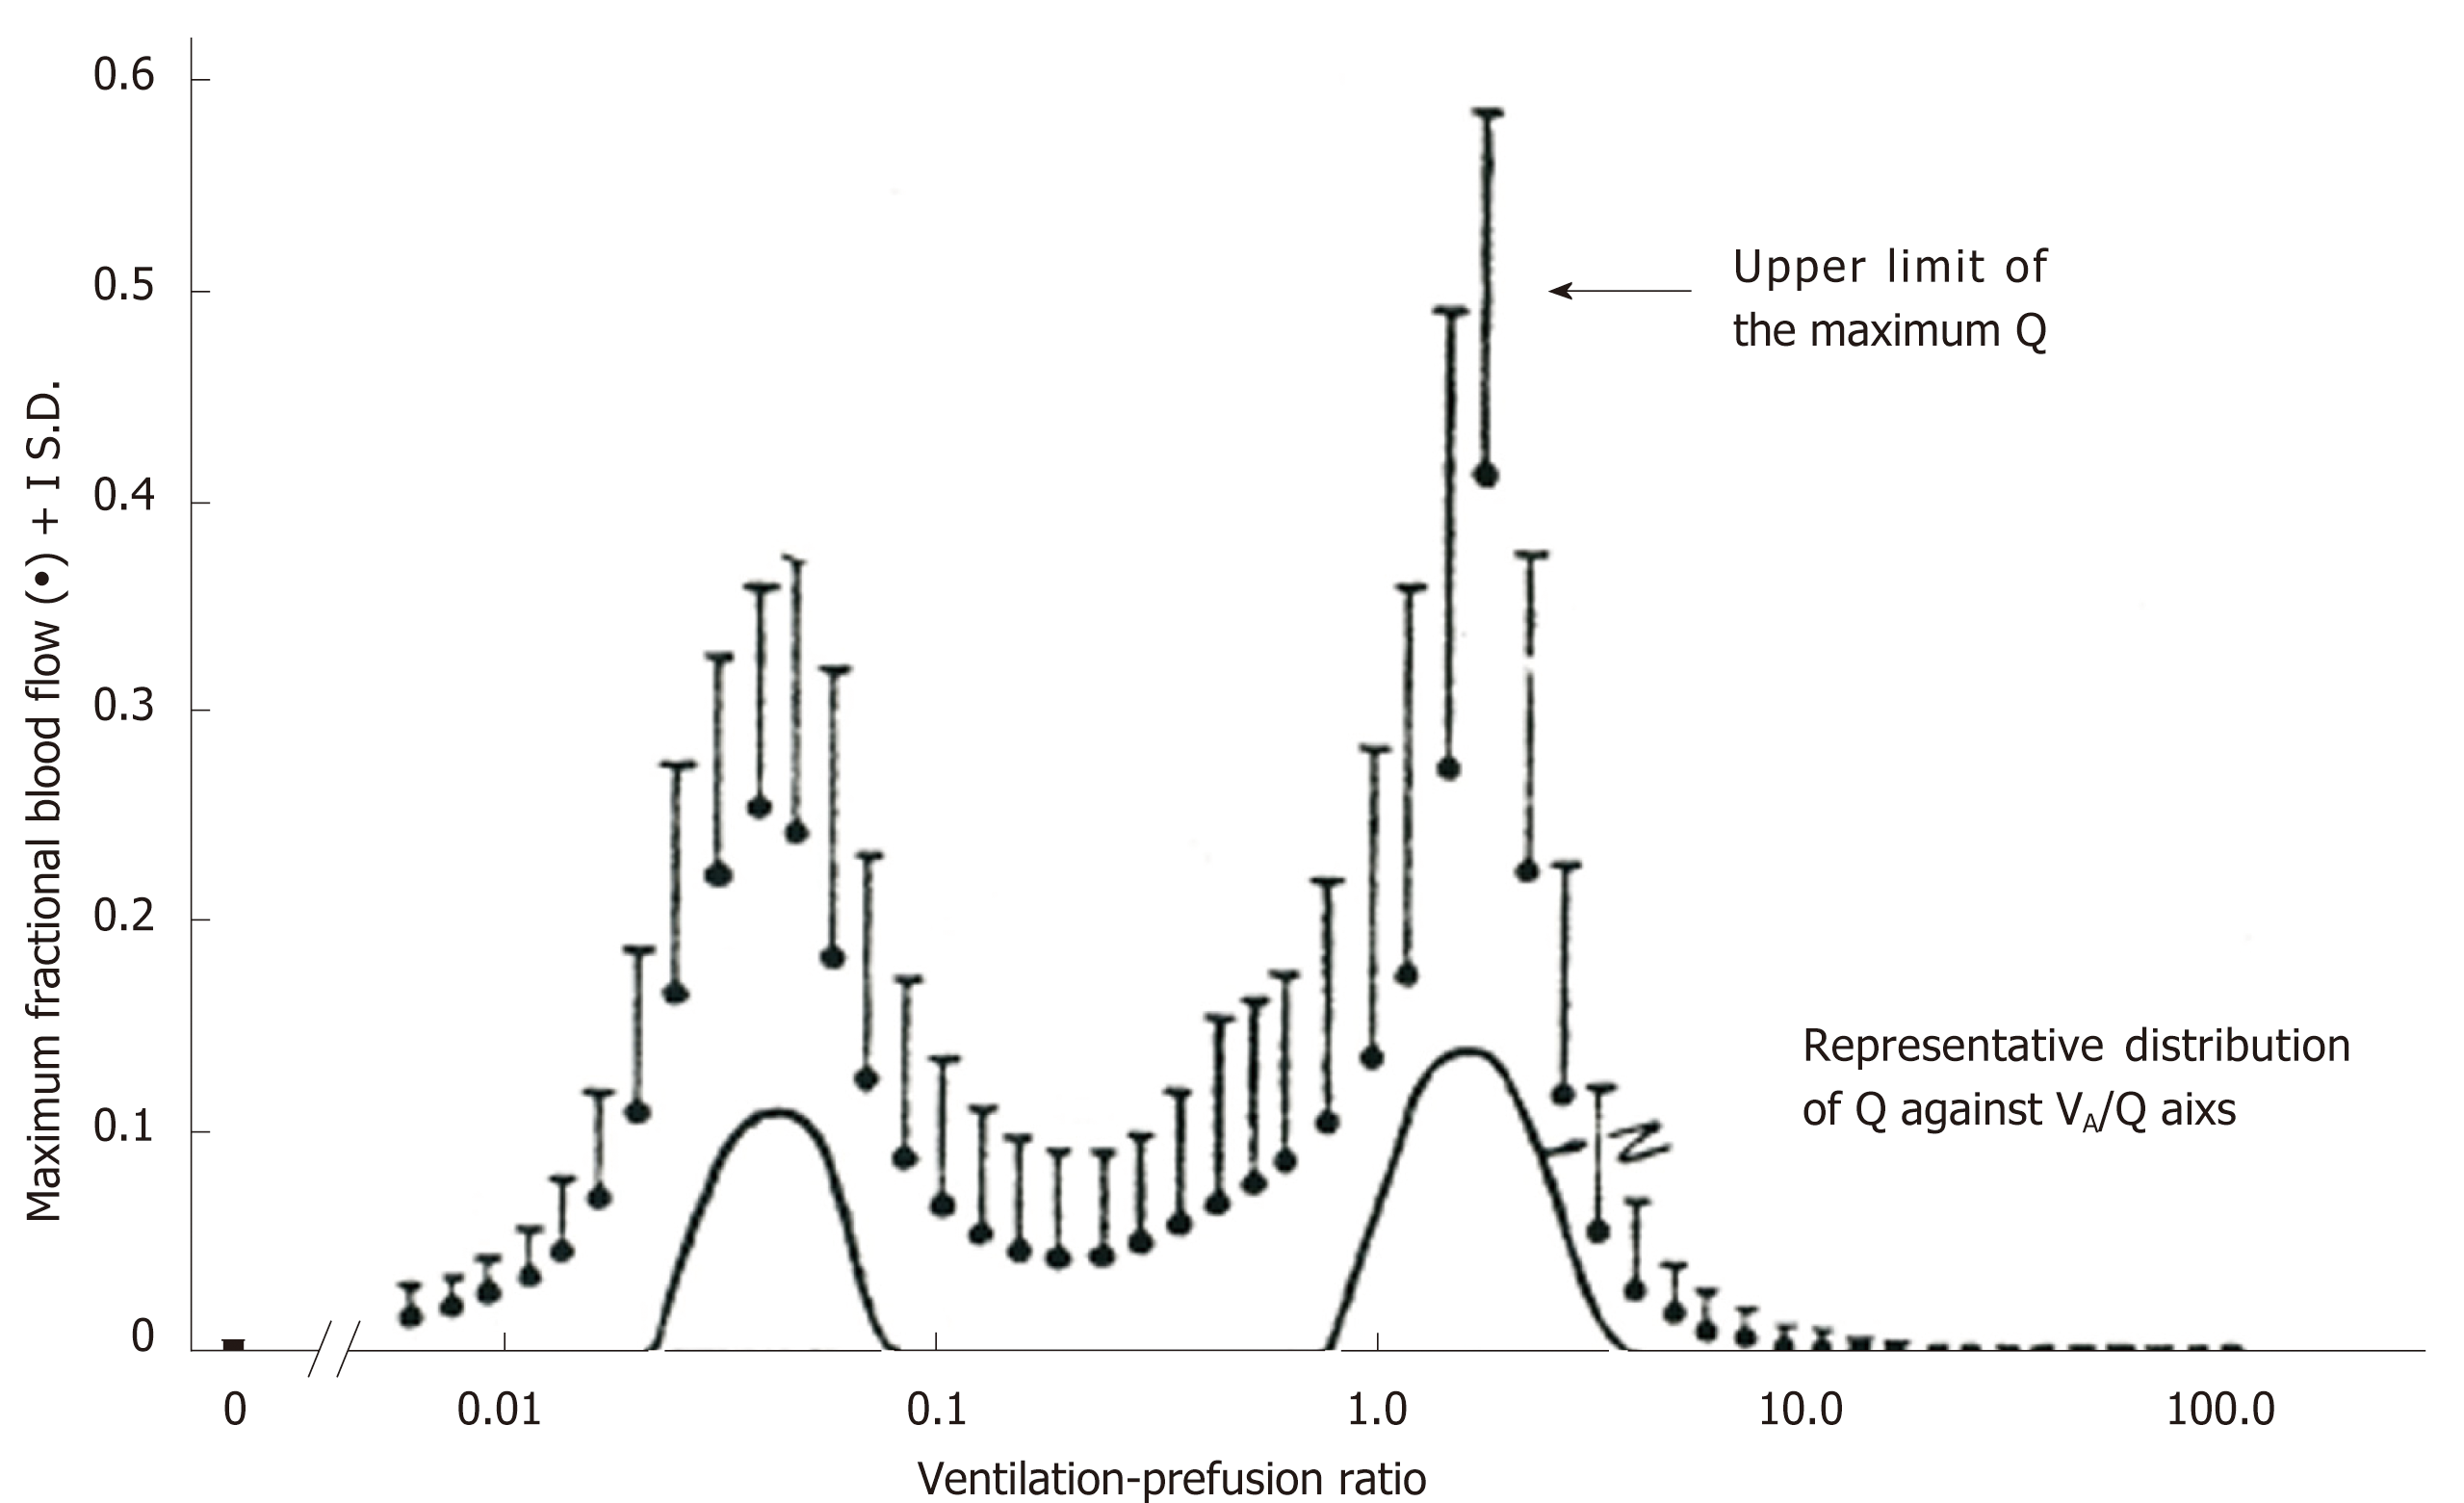
Figure 5 Range of solution for ventilation-perfusion distribution recovered from multiple inert-gas elimination technique.
Comparison between representative perfusion distribution obtained from multiple inert-gas elimination technique in terms of least-squares minimization and maximum perfusion distribution decided by linear programming. Adopted from ref[70].
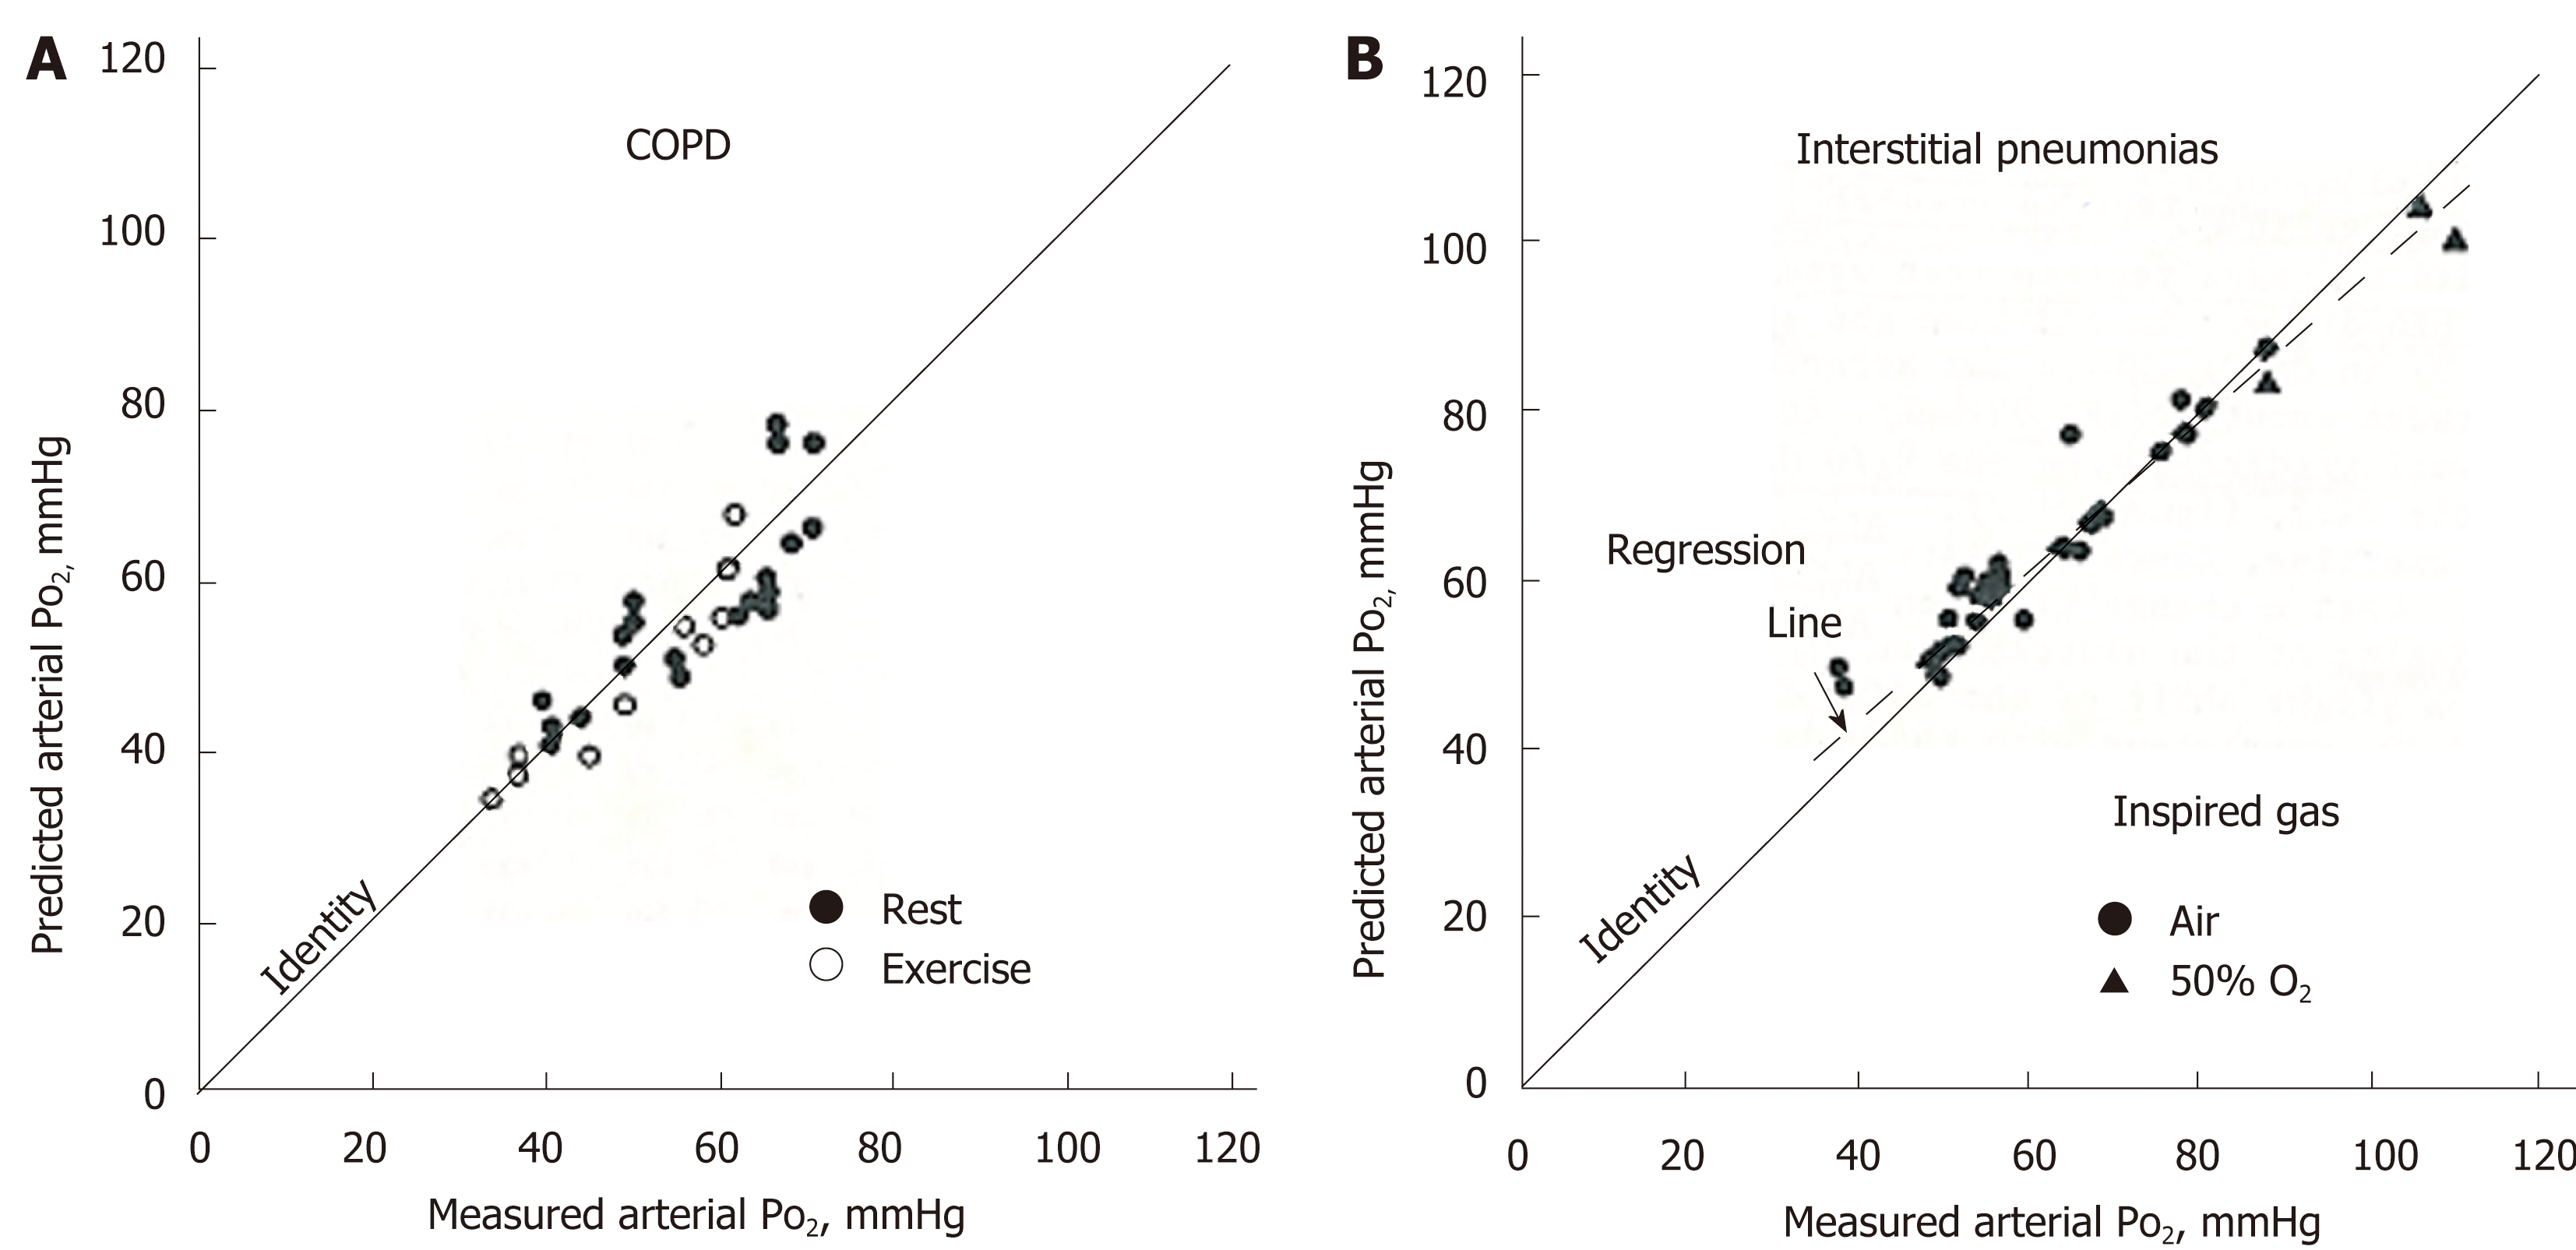
Figure 6 Comparison of predicted PaO2 from multiple inert-gas elimination technique and measured PaO2.
A: Chronic obstructive pulmonary disease at rest or during exercise; B: Interstitial pneumonias at rest while inspiring gas with 21% O2 (room air) or 50% O2. Adopted from ref[76]. COPD: Chronic obstructive pulmonary disease.
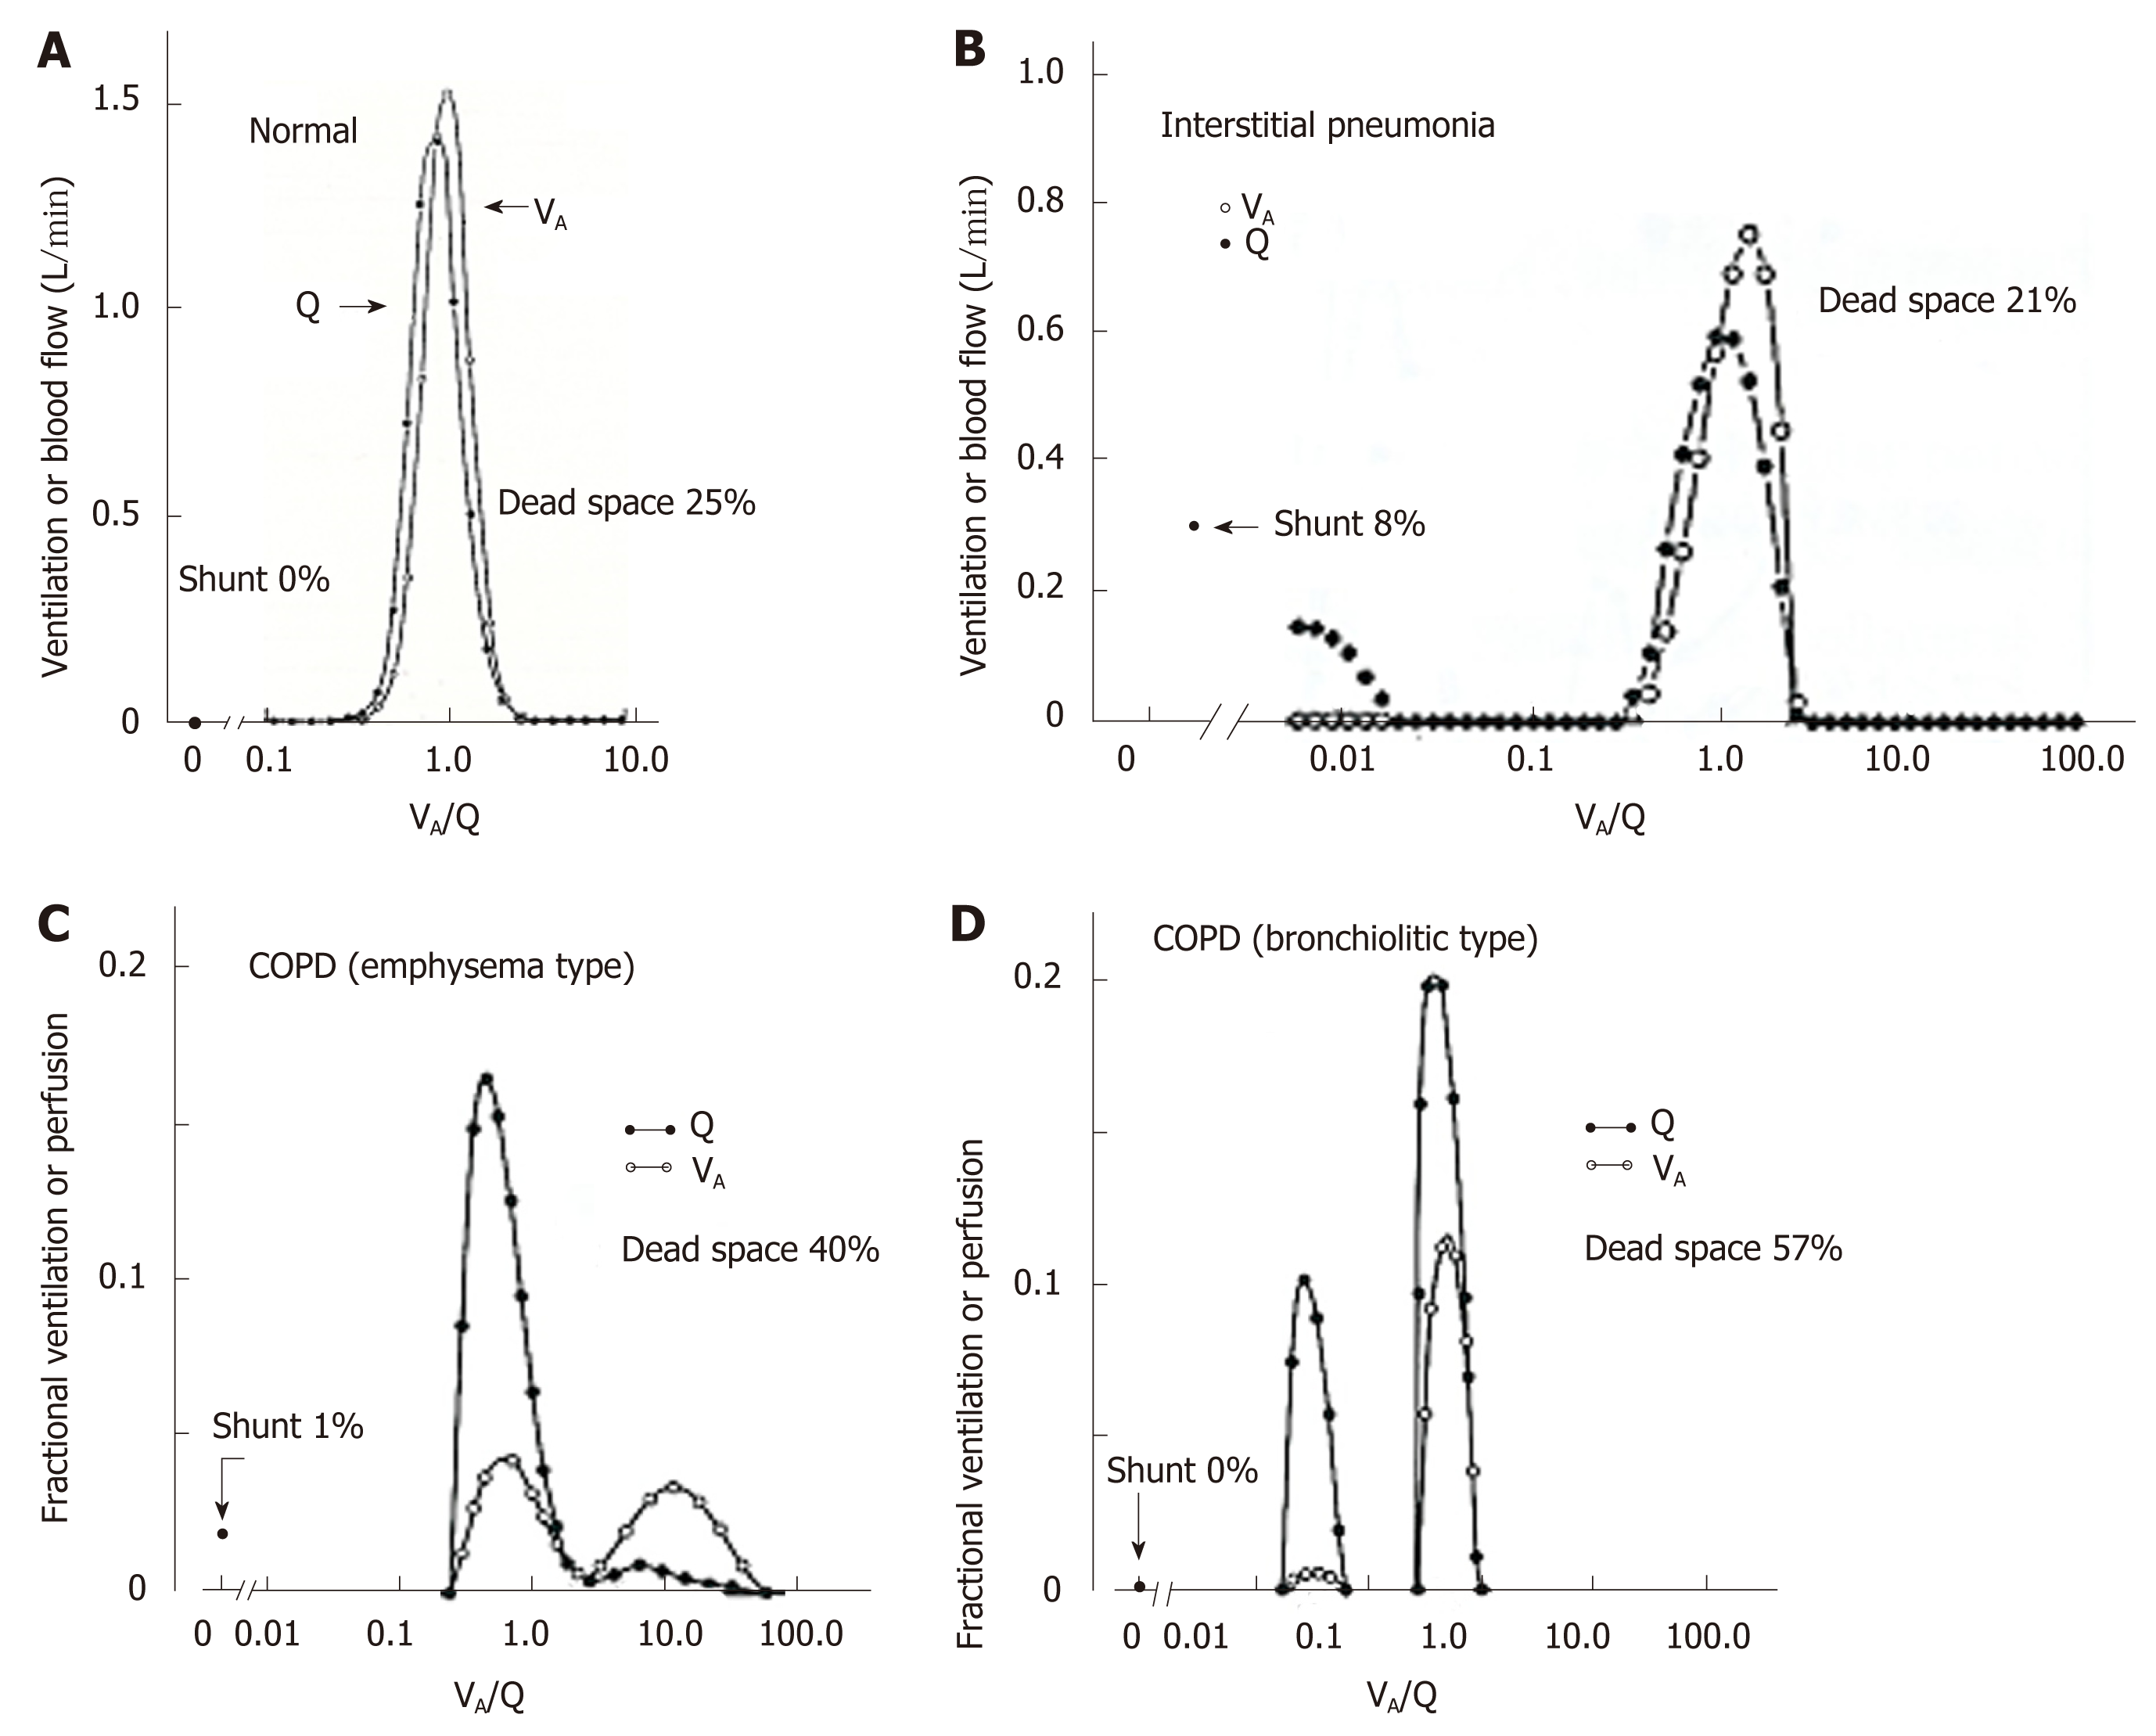
Figure 7 Representative ventilation-perfusion distributions predicted from multiple inert-gas elimination technique in various types of lung diseases.
A: Young normal subject; B: Patient with interstitial pneumonia; C: Chronic obstructive pulmonary disease patient with predominant emphysema; D: Chronic obstructive pulmonary disease patient with predominant bronchiolitis. See text for detailed explanation. Adopted from ref[59]. VA/Q: Ventilation-perfusion; COPD: Chronic obstructive pulmonary disease.
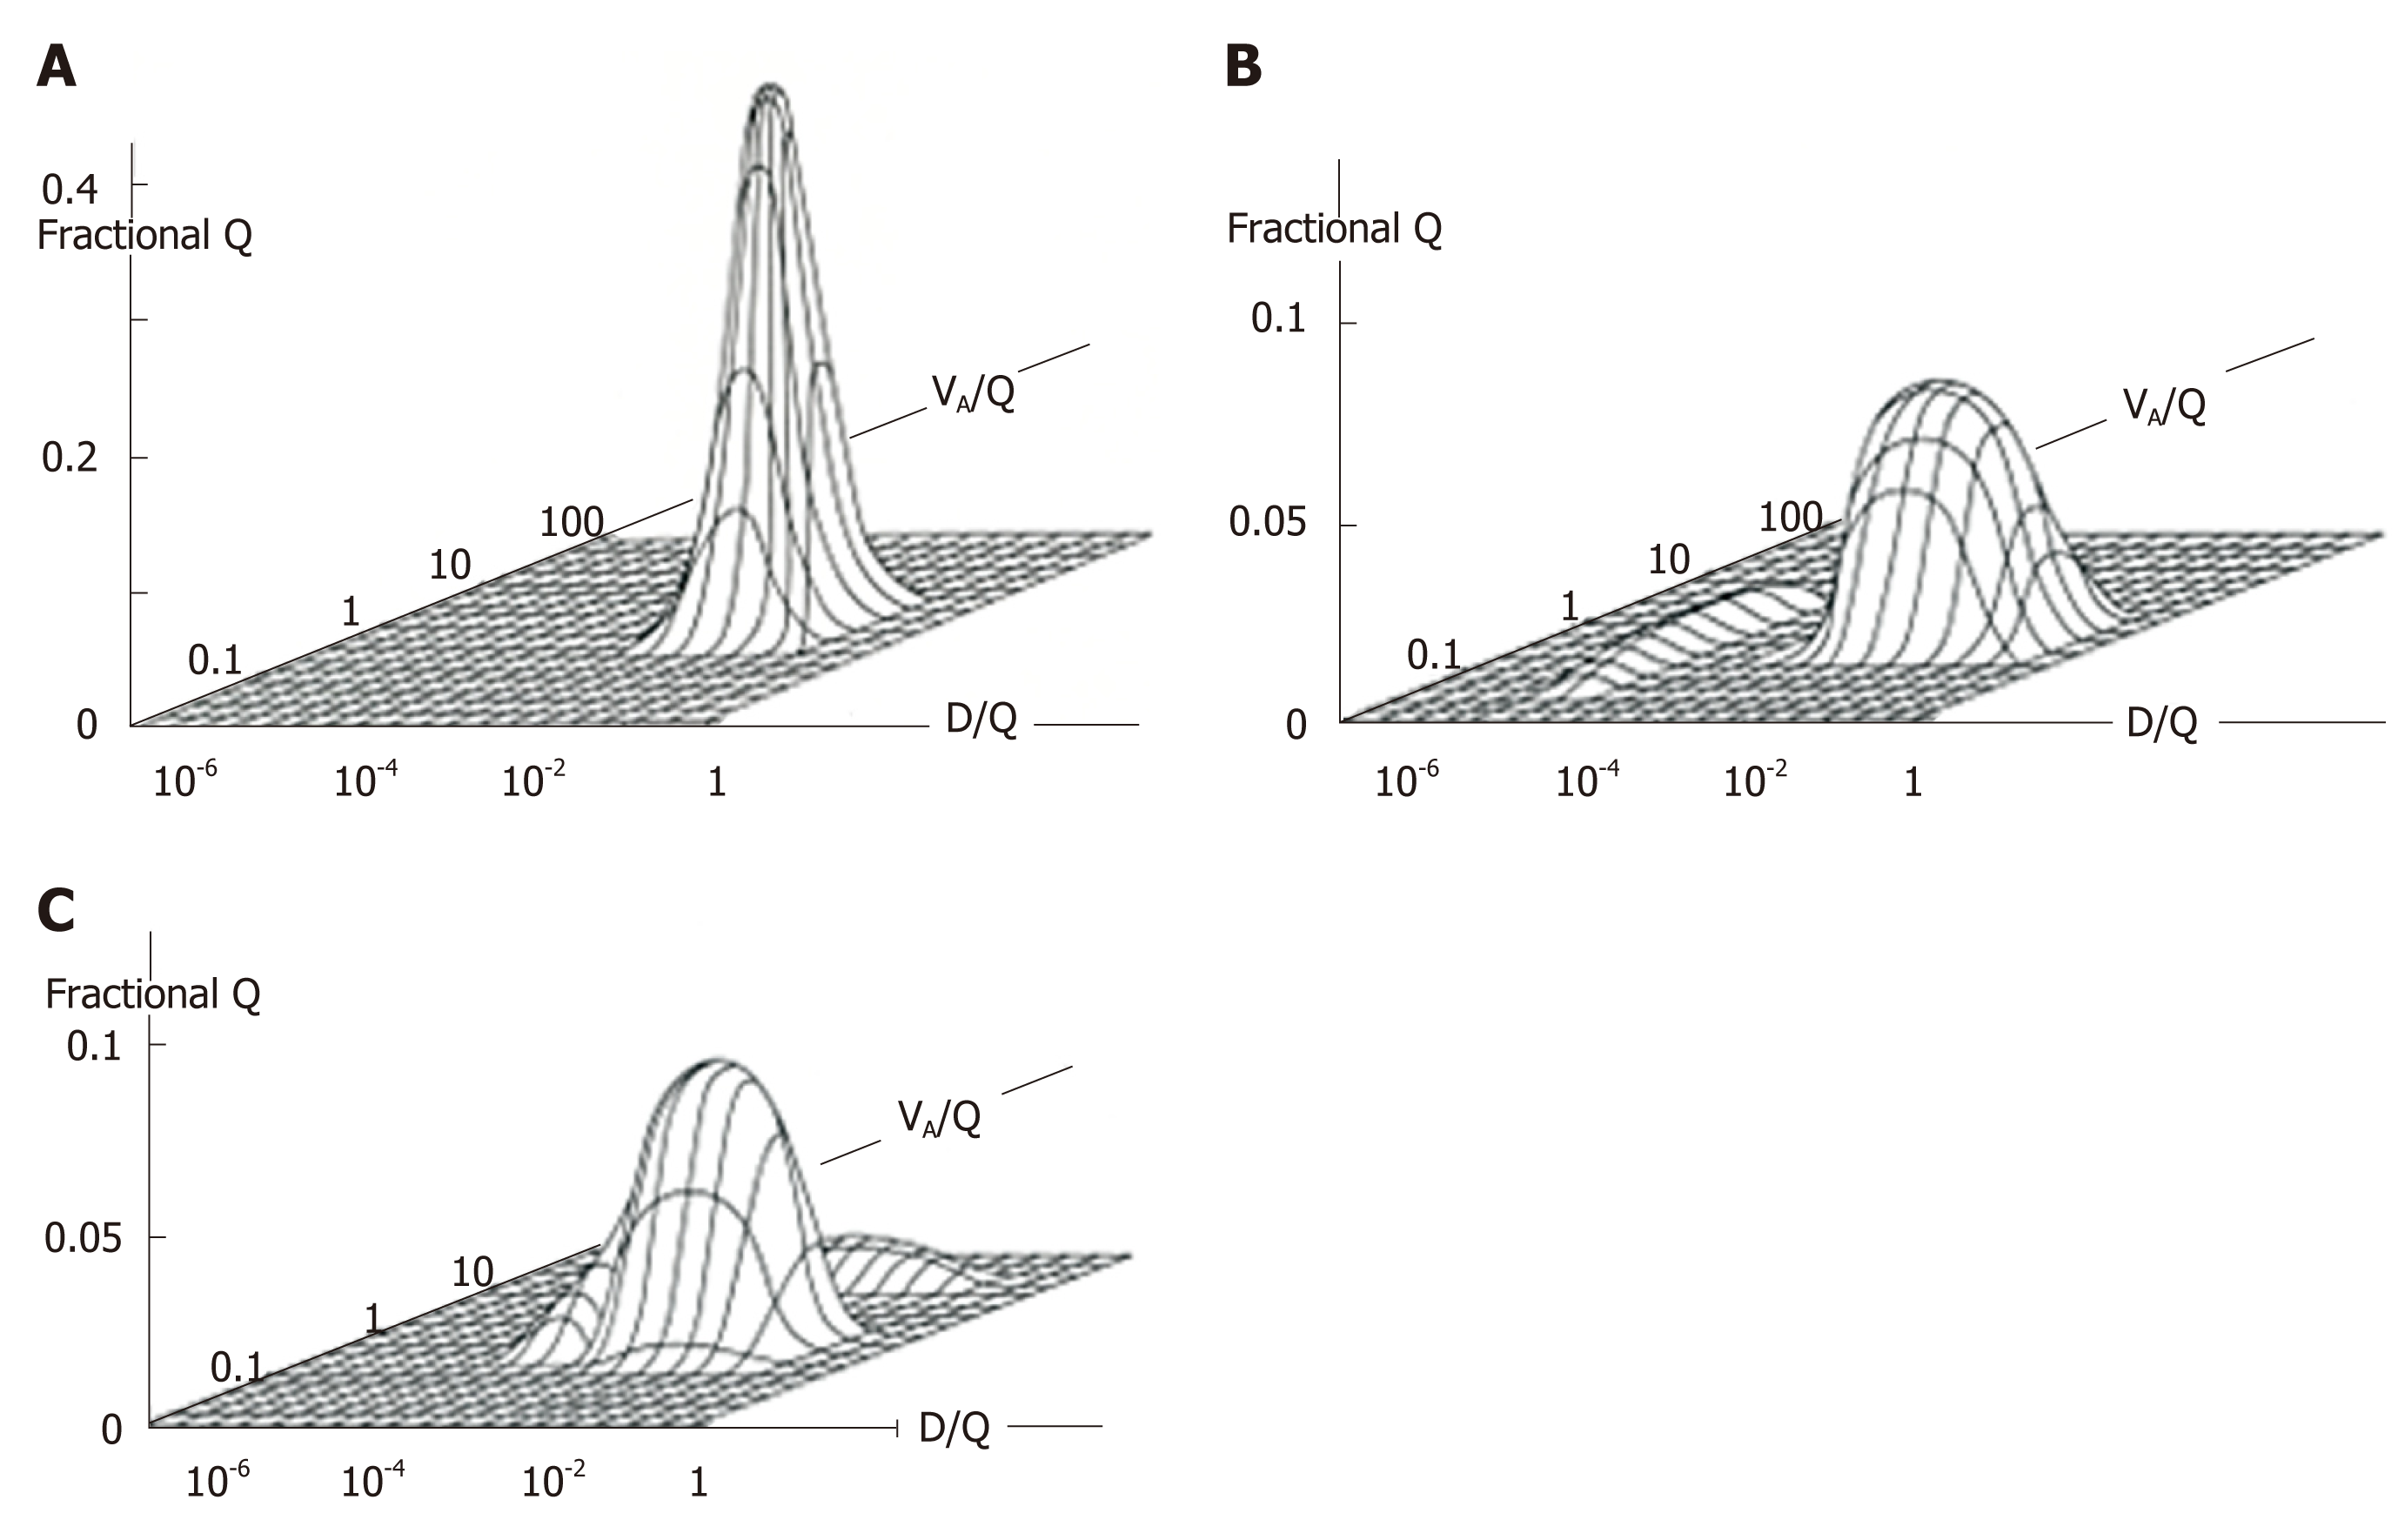
Figure 8 Ventilation-perfusion (VA/Q)-Diffusing capacity-perfusion (D/Q) distributions in normal and diseased lungs.
A: VA/Q and D/Q distribution in normal lung; B: That in lung with desquamative interstitial pneumonia; C: That in lung with chronic obstructive pulmonary disease characterized by emphysema. Patient with desquamative interstitial pneumonia (B) revealed minimal VA/Q heterogeneity but very low D/Q regions that may yield “diffusion shunt” contributing to hypoxemia. Very low D/Q regions may be caused by decreased surface area and/or increased thickness of alveolocapillary membrane. Patient with chronic obstructive pulmonary disease (C) showed VA/Q heterogeneity with high VA/Q regions but minimal regions with very low D/Q. Modified from ref[80].
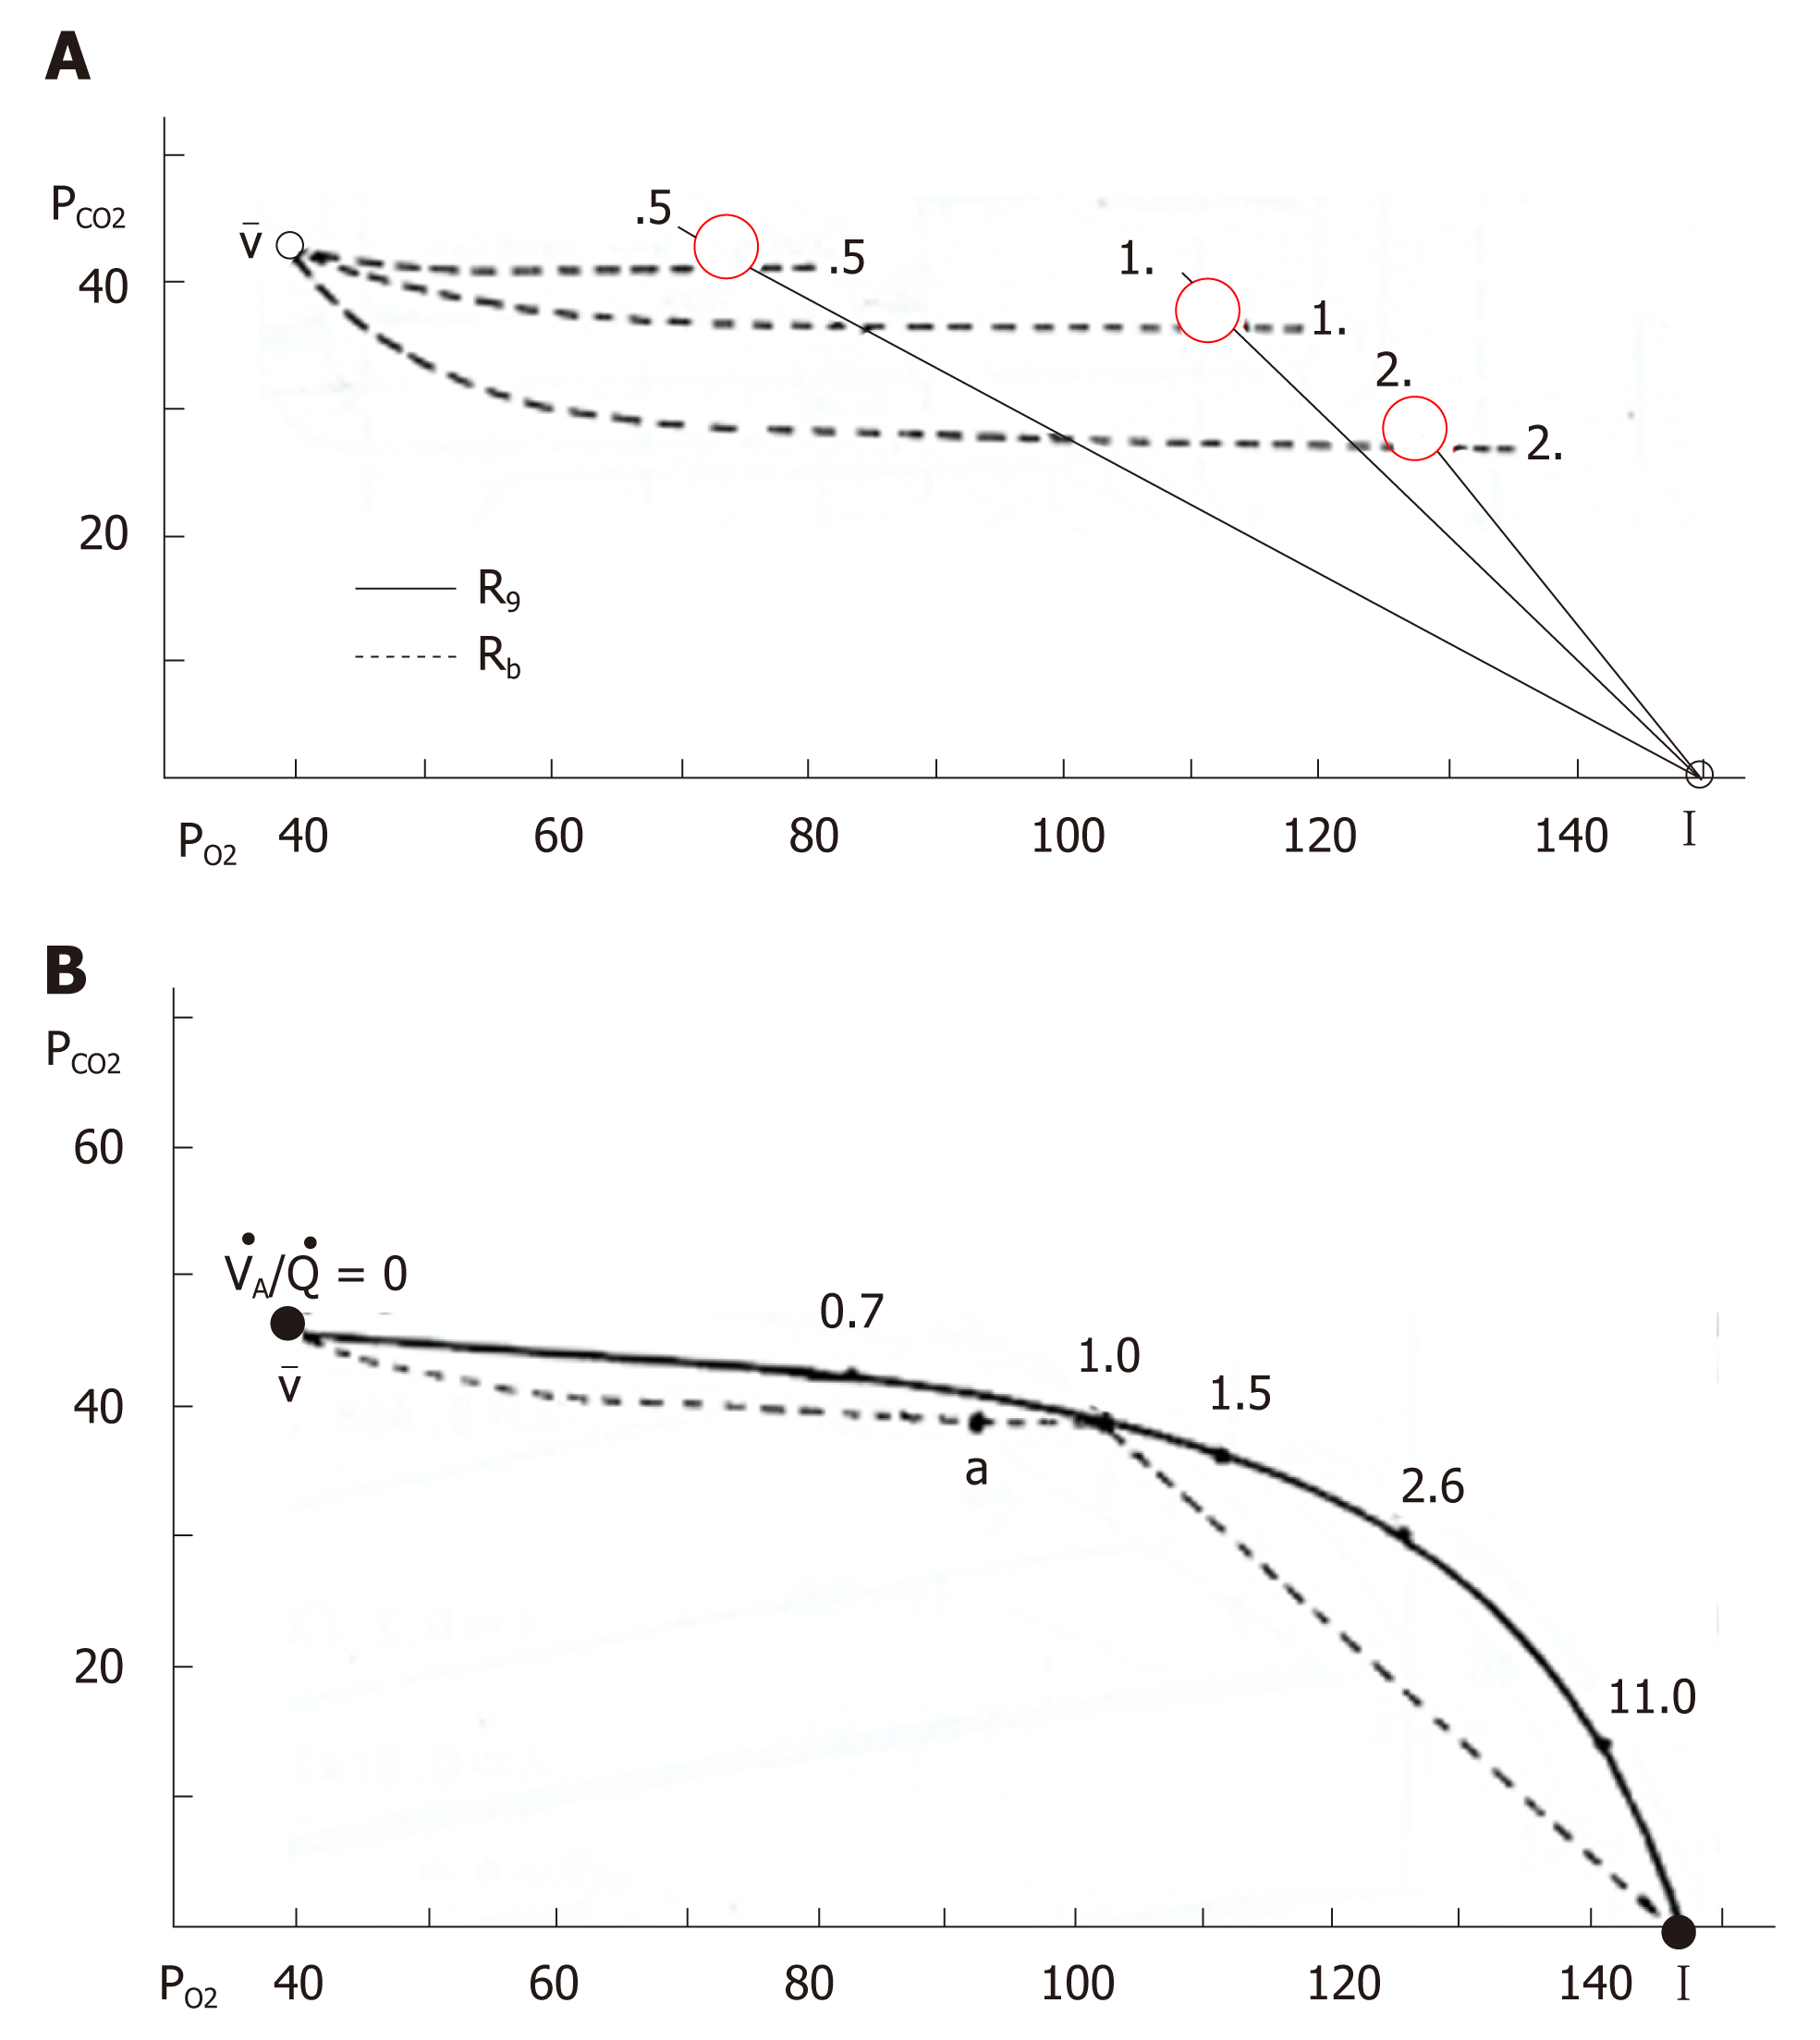
Figure 9 O2-CO2 diagram and ventilation-perfusion line.
A: O2-CO2 diagram, in which solid and dotted lines indicate gas R lines and blood R lines, respectively. Intersection of these two lines denoted by red circle provides a single ventilation-perfusion value and corresponding unique pair of PO2 and PCO2; B: Ventilation-perfusion line constructed by connecting each intersection of gas R lines and blood R lines. I: Inspired point; a: Arterial point; v: Mixed venous point. See text for further explanation. Adopted from ref[87].
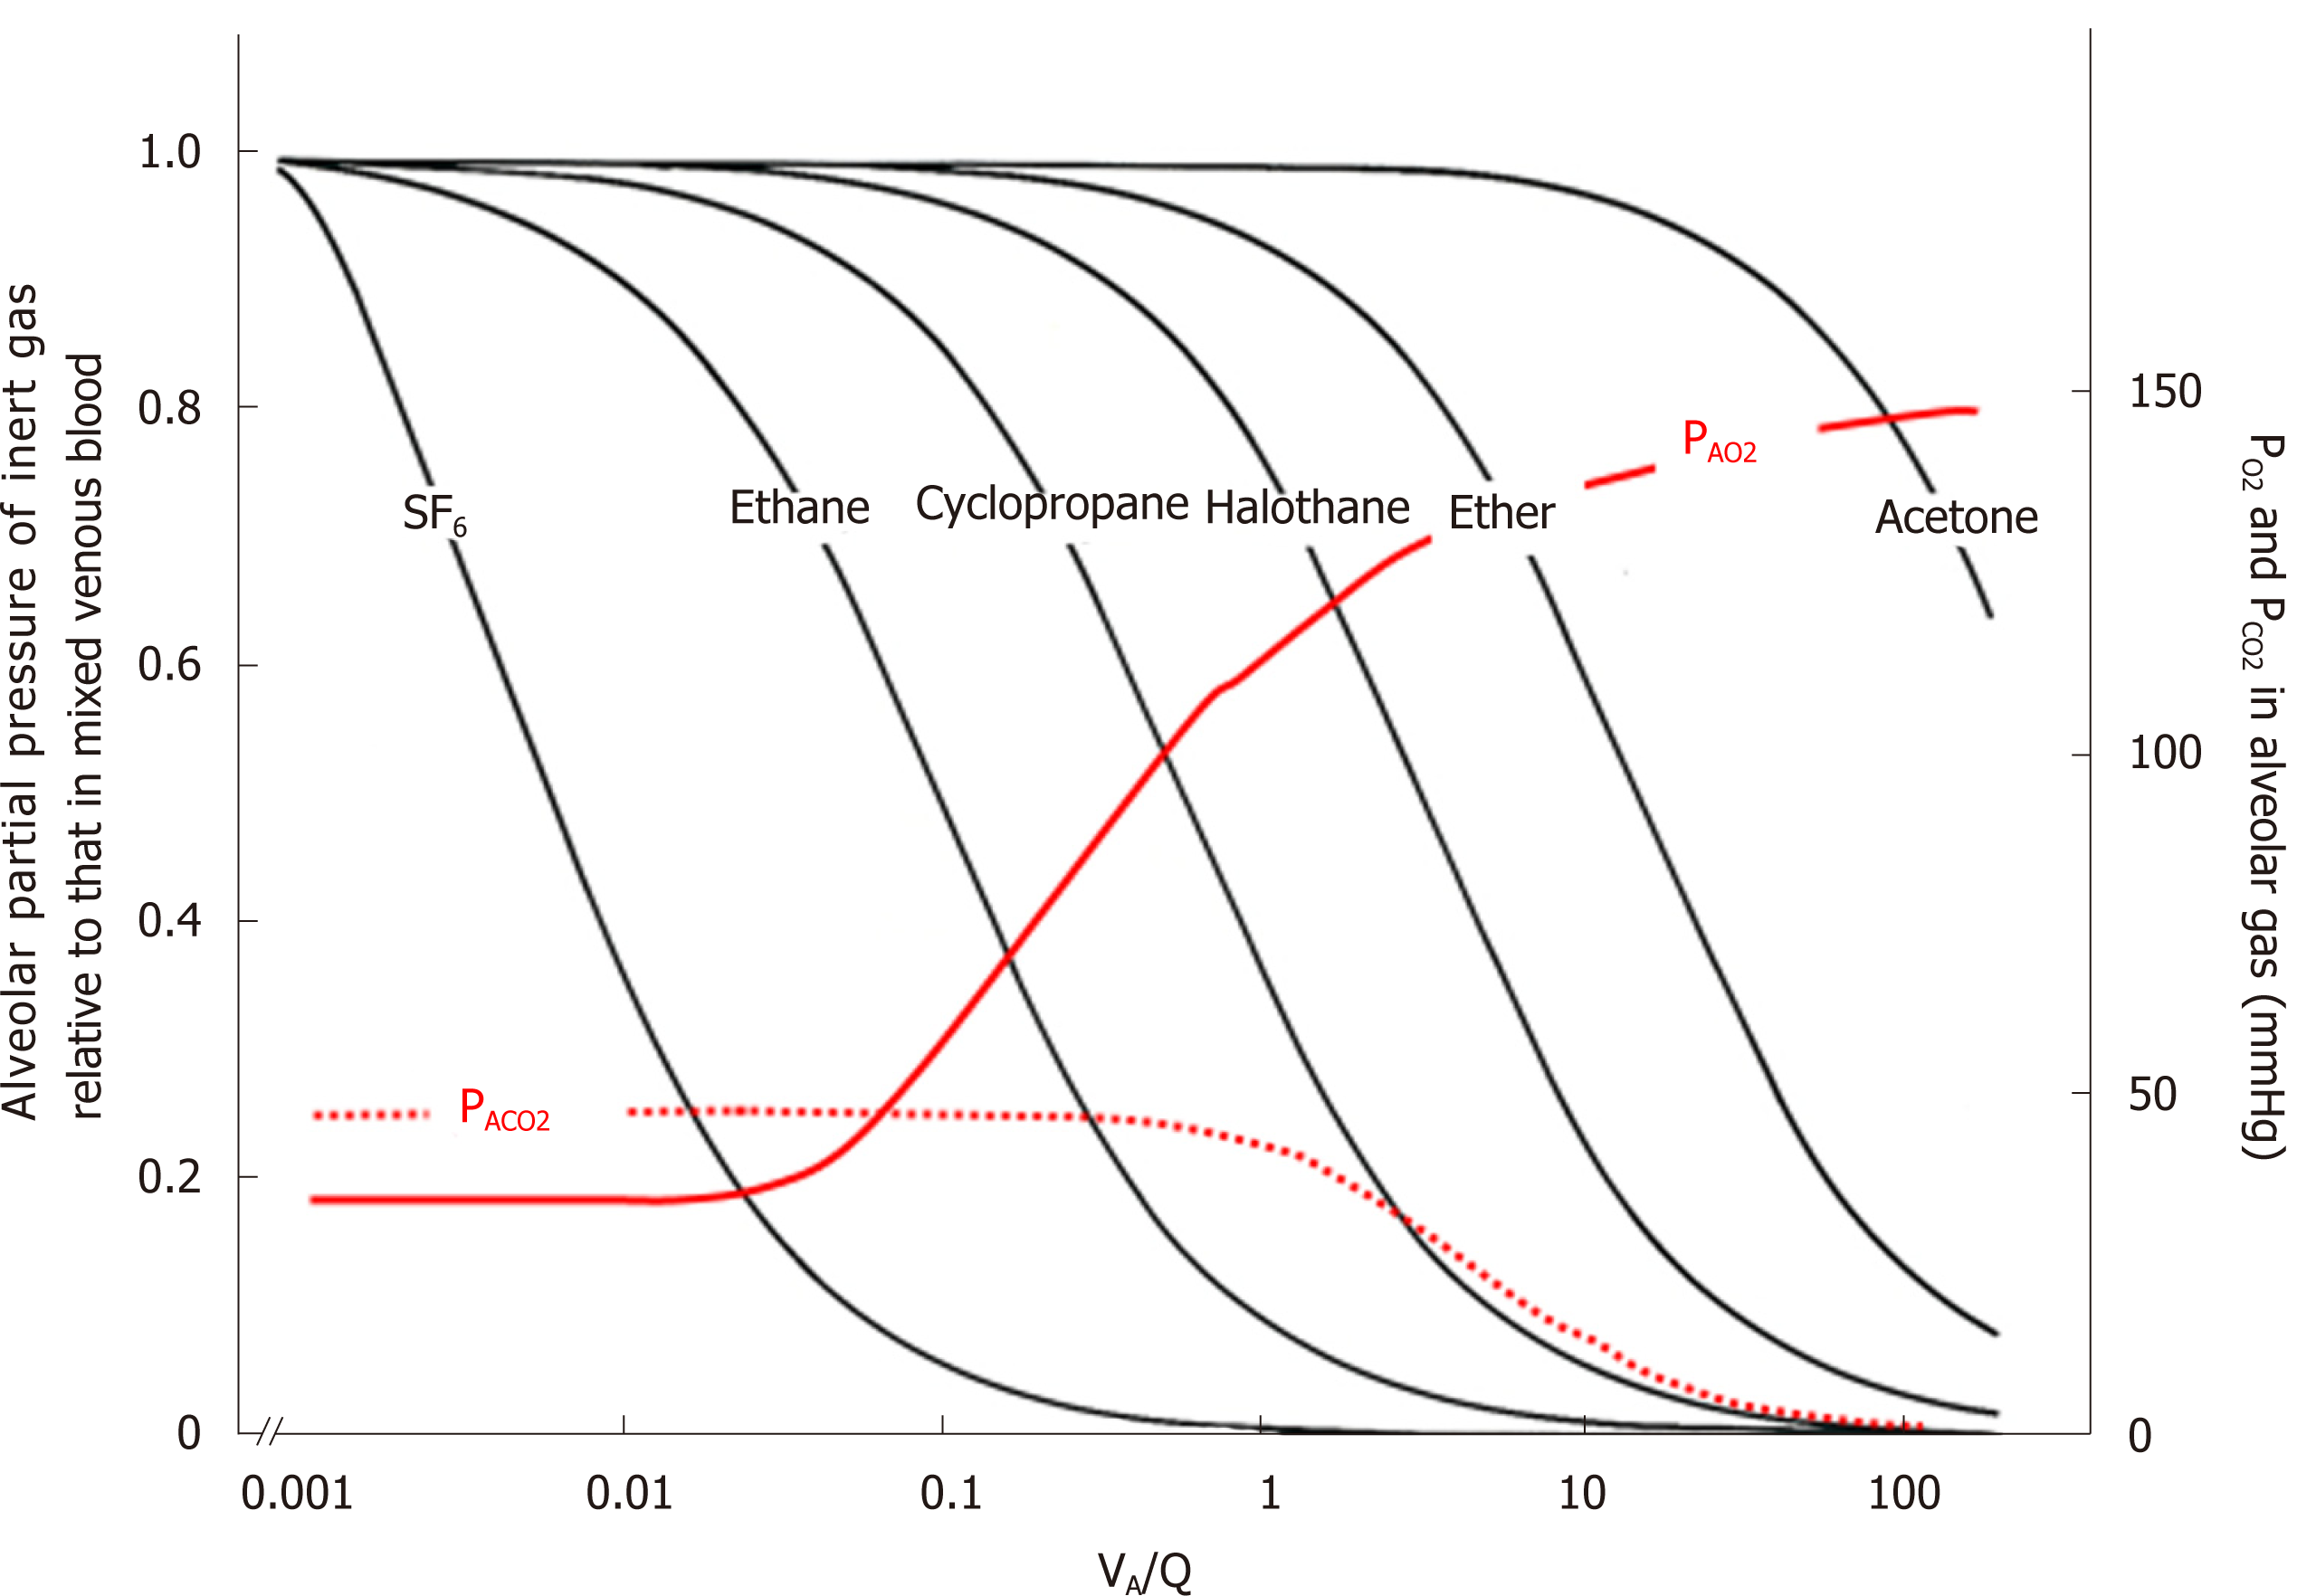
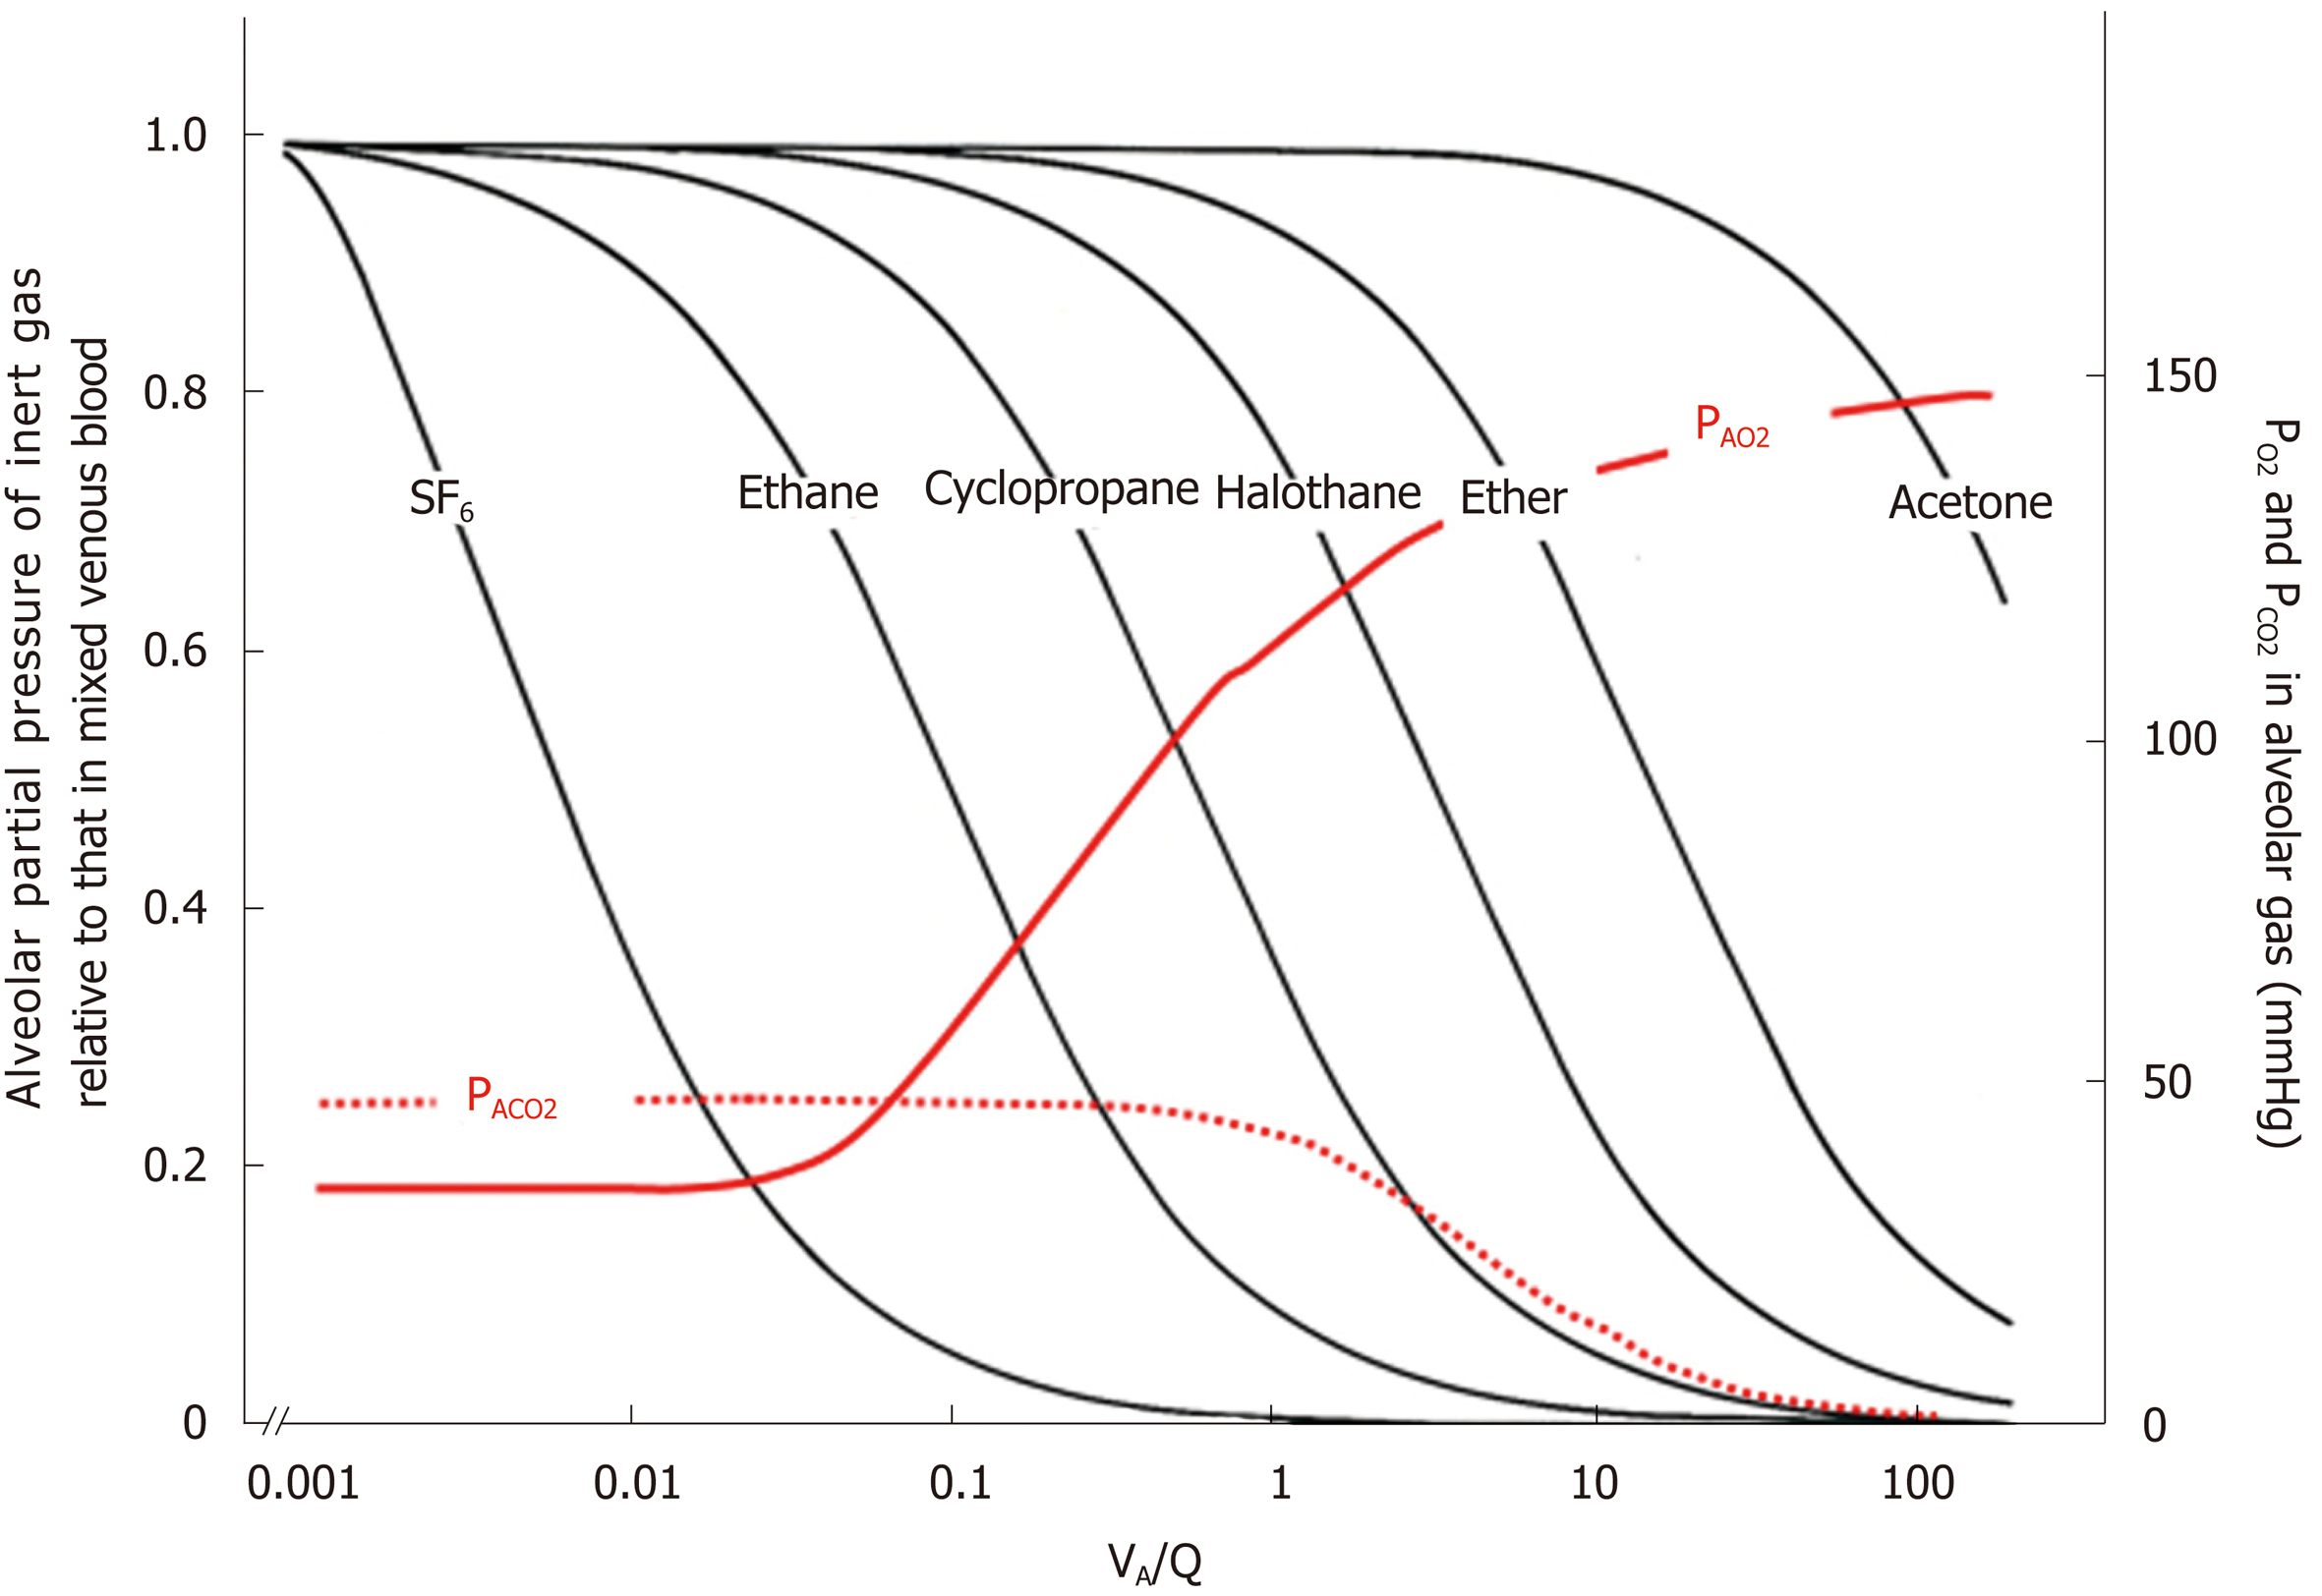
Figure 10 Ventilation-perfusion (VA/Q) regions detected from gas exchange behaviors of O2, CO2, and inert gases.
Left ordinate: excretion (E) of inert gas defined as PA/Pv, where PA is partial pressure of inert gas in each functional gas-exchange unit, while Pv is that in mixed venous blood. Right ordinate: PAO2 and PACO2 in each functional gas-exchange unit. Abscissa: logarithmic VA/Q value. E of each inert gas sharply changes in a certain range of VA/Q depending on its blood-gas partition coefficient (λ). For instance, sharp change in E for SF6 is found at VA/Q ranging between 0.001 and 0.01. As such, SF6 has high sensitivity to detecting gas exchange in regions with very low VA/Q. On the other hand, E for acetone sharply changes at VA/Q ranging from 10 to 100, indicating that acetone is susceptible to gas exchange in regions with very high VA/Q. PAO2 changes greatly at VA/Q ranging between 0.1 and 1.0, suggesting that O2 has sensitivity to detecting gas exchange in regions with moderately low VA/Q (like cyclopropane). Meanwhile, CO2 is susceptible to gas exchange in regions with moderately high VA/Q ranging from 1.0 to 10 (like halothane).
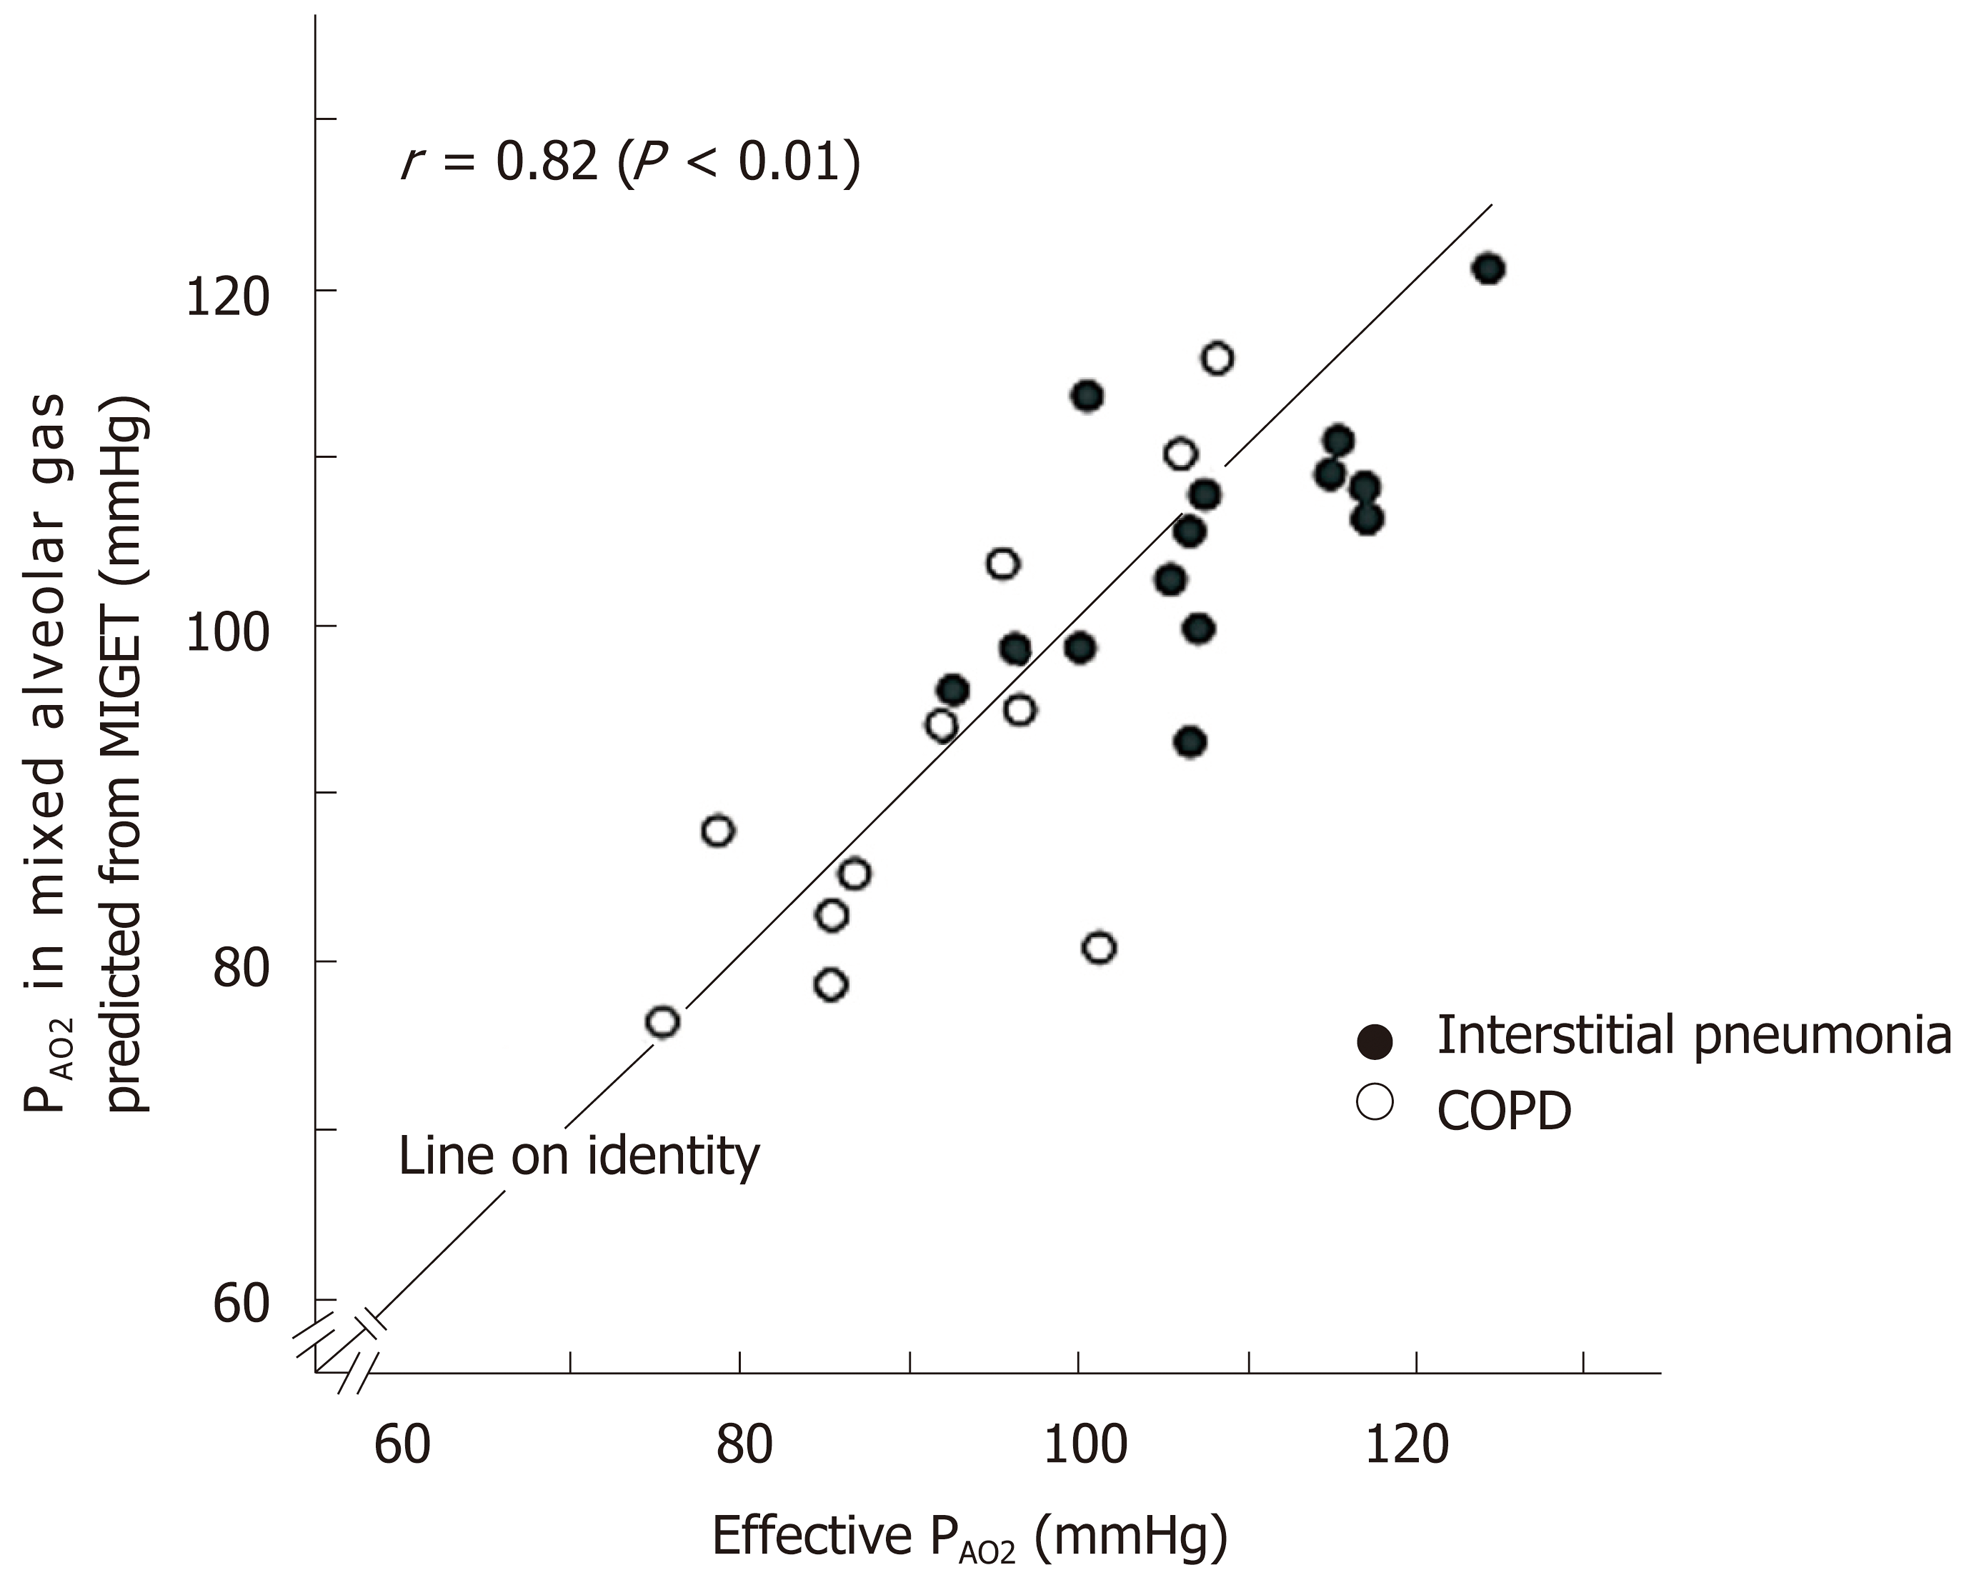
Figure 11 Comparison of effective PAO2 and PAO2 in mixed alveolar gas estimated from ventilation-perfusion distribution decided by multiple inert-gas elimination technique.
Effective PAO2 and PAO2 estimated from multiple inert-gas elimination technique were compared [patients with interstitial pneumonia (n = 14) and chronic obstructive pulmonary disease (n = 11)]. Coincidence of two PAO2 is satisfactory. See text for further explanation.
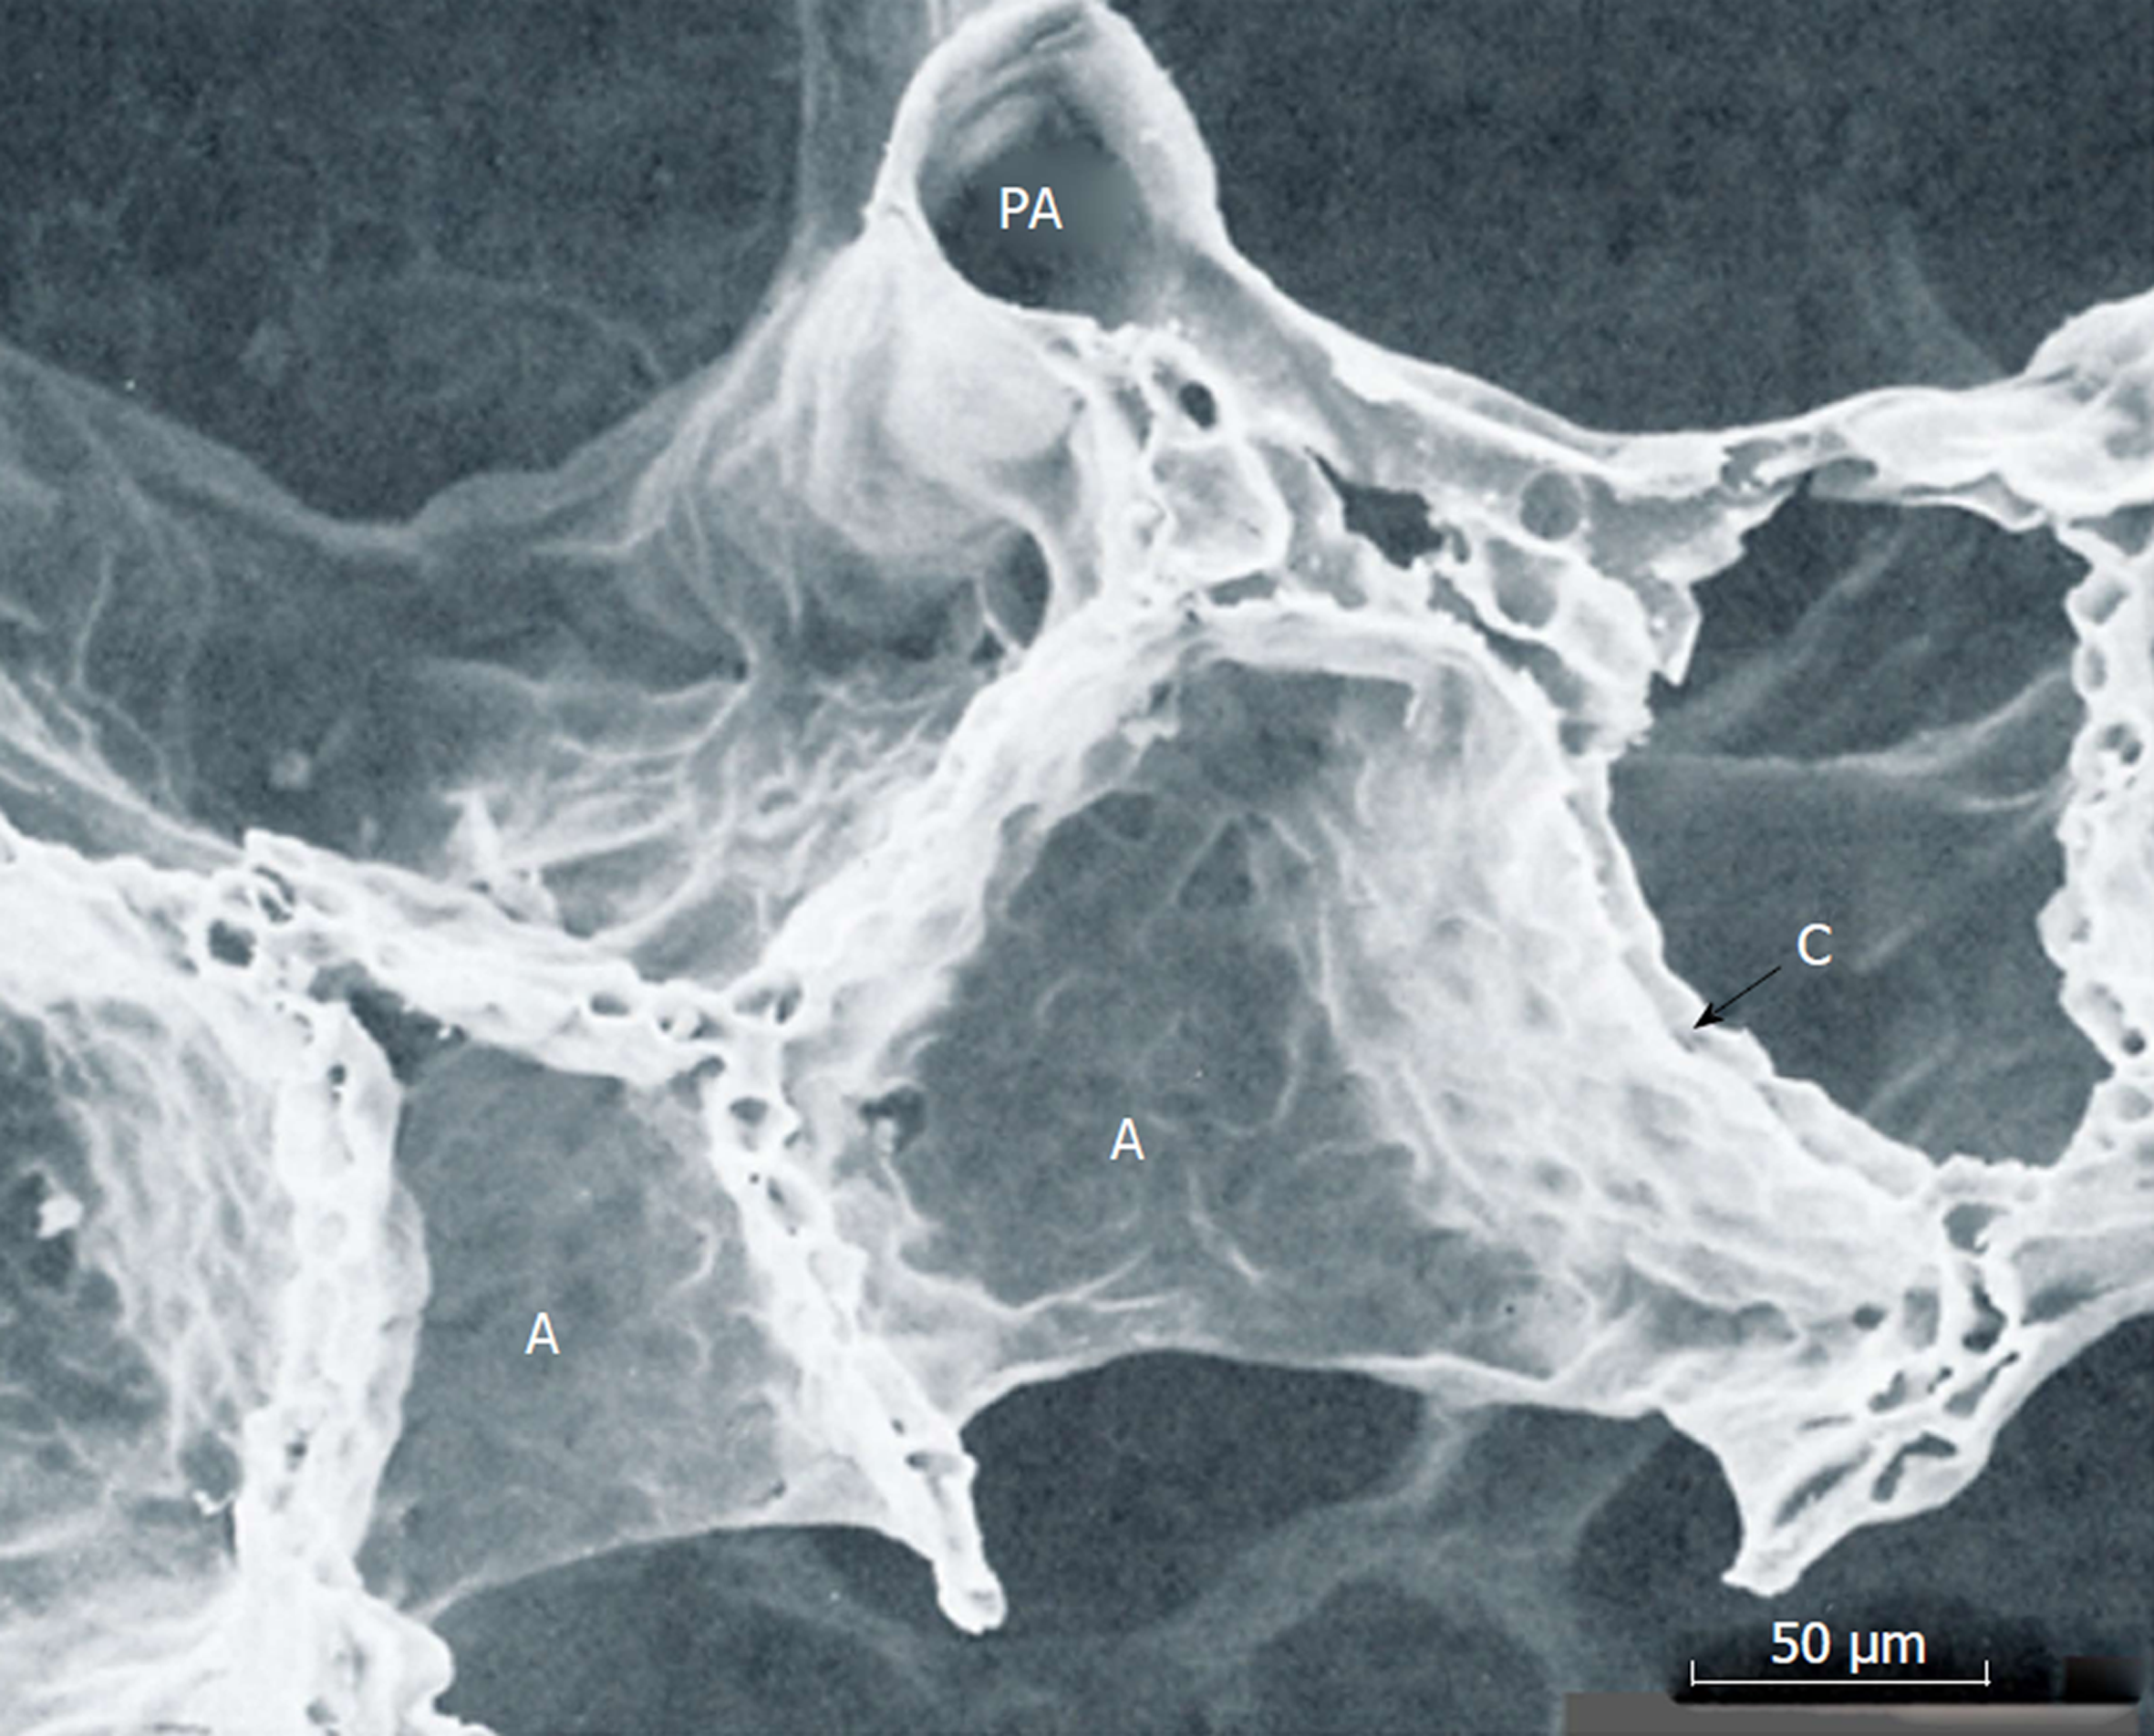
Figure 12 Scanning electron microscopic image of perfusion-fixed alveolar walls.
PA: Pulmonary arteriole; A: Alveolar walls, C: Capillary networks embedded in alveolar wall. Adopted from ref[25].
Figure 13 Partial-pressure equilibration of gases between alveolar gas and capillary blood.
Inert gases that are not combined with erythrocyte hemoglobin (Hb) show instantaneous equilibration between alveolar gas and capillary blood. O2 and CO2 that have relatively low affinity with Hb need some time for completing equilibration between alveolar gas and capillary blood. CO and NO (red lines) that have very high affinity with Hb prevent rise in their partial pressures in capillary blood. Hence, CO and NO do not reach partial-pressure equilibration between alveolar gas and capillary blood any more even in normal lung. Affinity of NO with Hb is extremely high and chemical reaction of NO with Hb is very rapid such that partial pressure of NO in capillary blood is maintained at negligible level. Therefore, there is no “back-pressure” effect during measurement of DLNO. However, affinity of CO with Hb is lower than that of NO (i.e., 1/1800 times that of NO). Therefore, partial pressure of CO in capillary blood rises gradually such that “back-pressure” of CO from capillary blood should not be ignored while measuring the pulmonary diffusing capacity for CO.
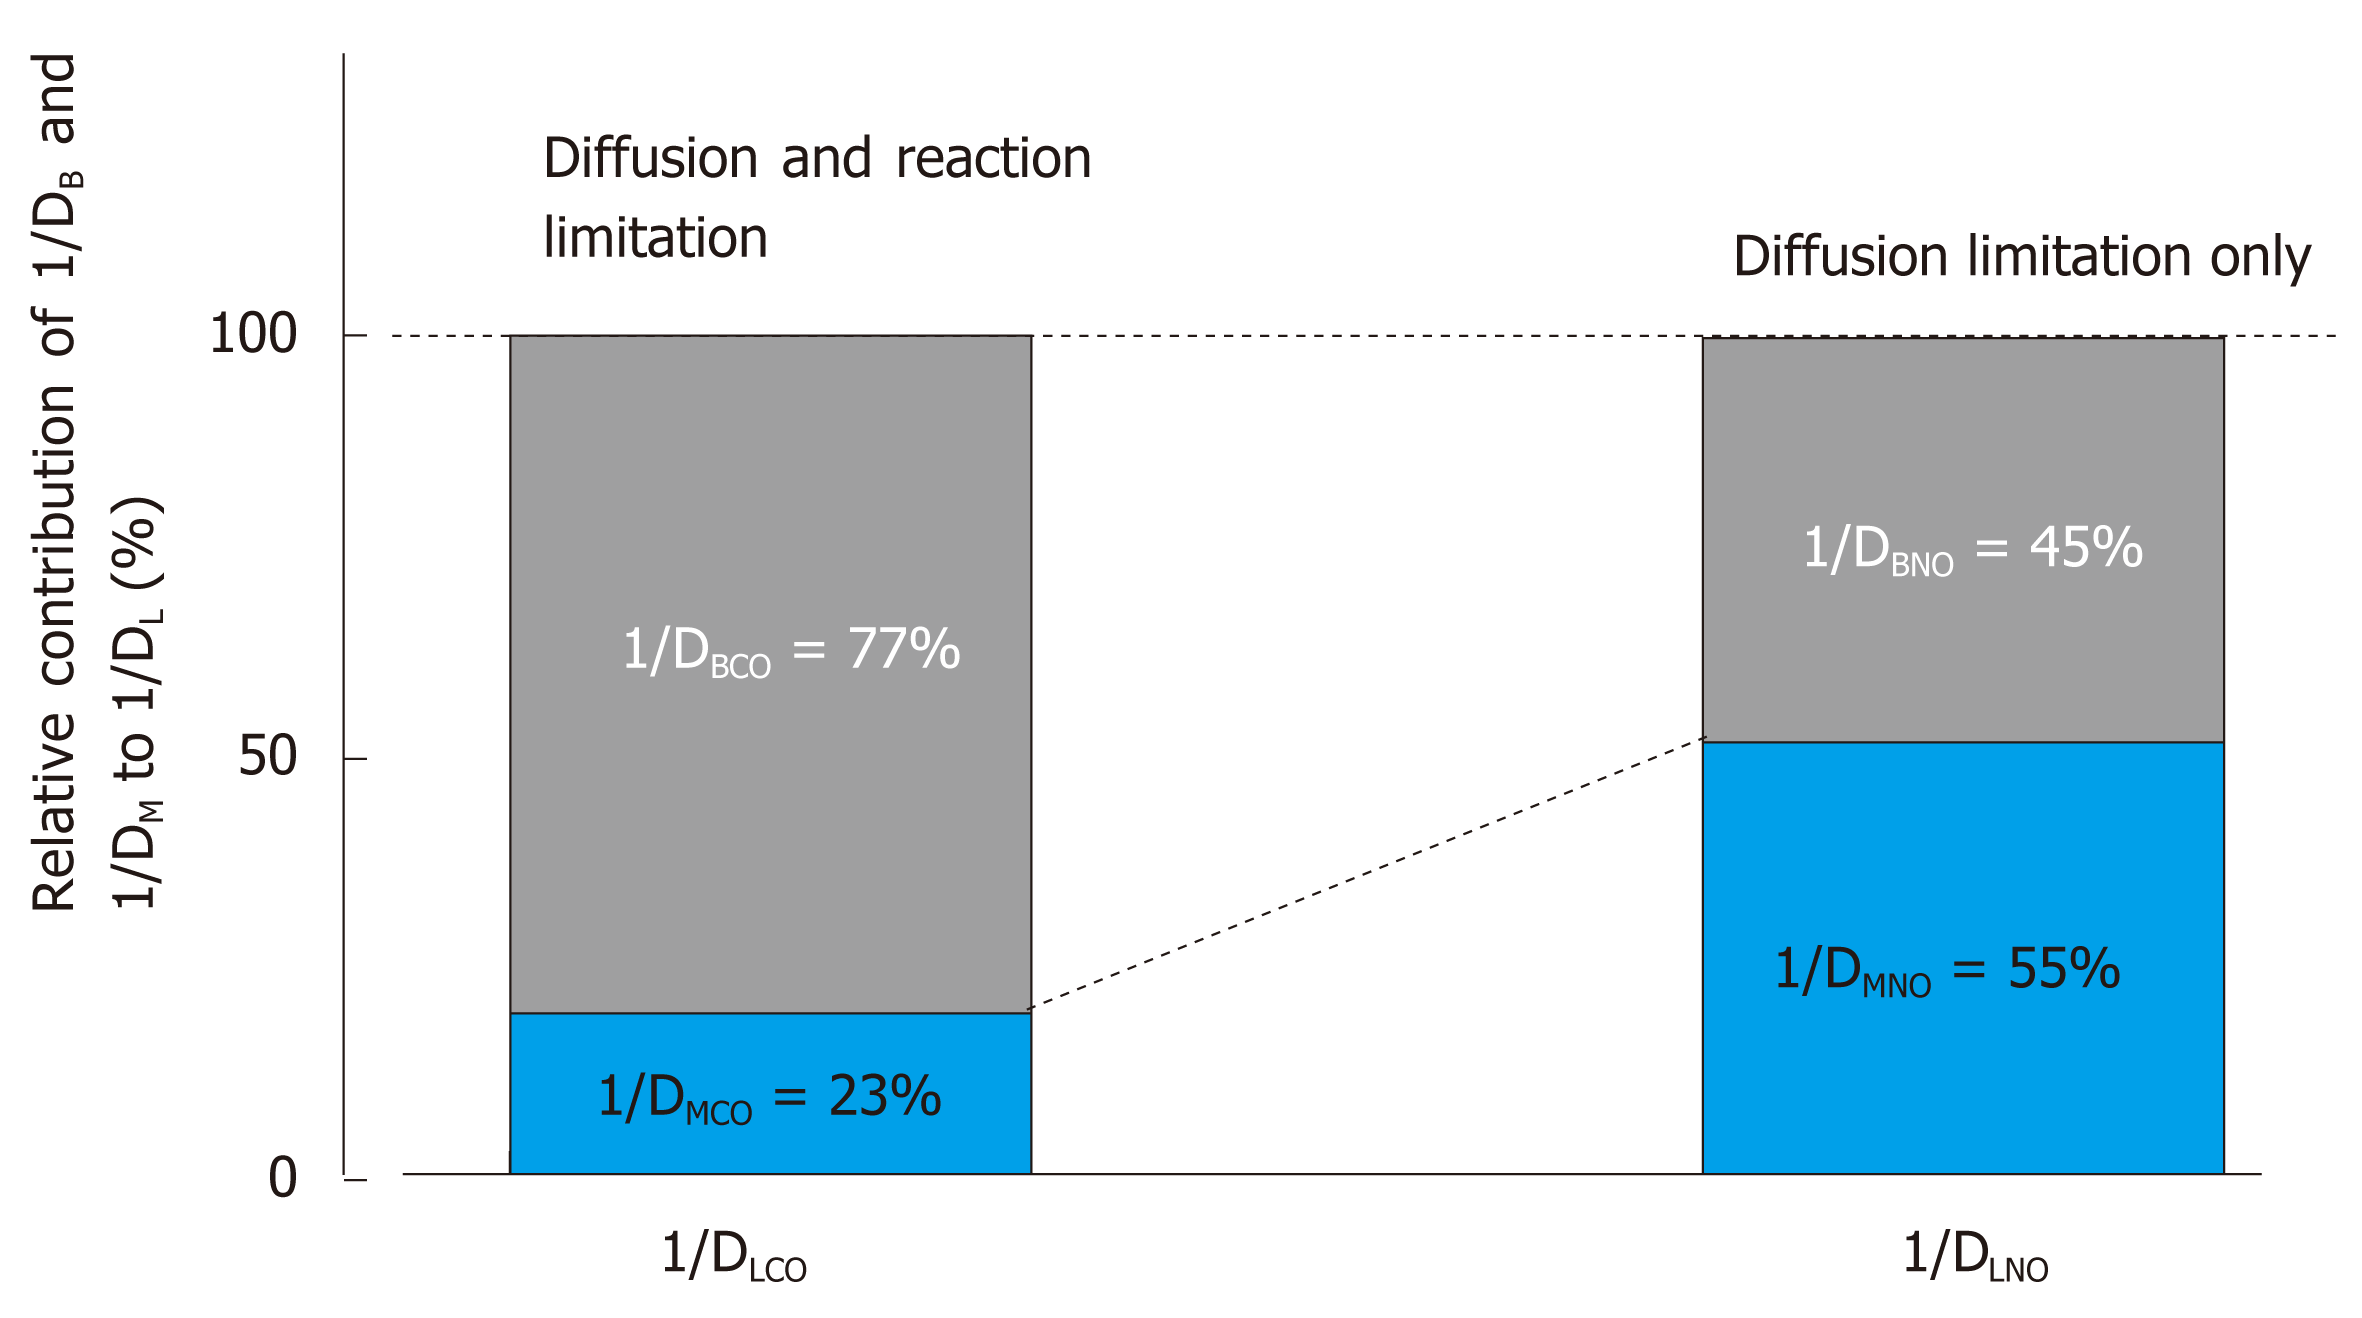
Figure 14 Relative contribution of 1/DM and 1/DB to overall resistance of 1/DL.
Difference in membrane diffusing capacity for CO (DMCO) and that for NO (DMNO) is simply attributed to difference in their Krogh diffusion constants defined as (α∙d), where α is Bunsen solubility coefficient of the gas (mL/mL/atm) and d is gas diffusivity (cm2/s) in alveolocapillary membrane and plasma layer. DMNO/DMCO is assumed to be 1.97[65]. On the other hand, blood-diffusing capacity for CO (DBCO) or NO (DBNO) is defined as alveolar capillary blood volume (VC) multiplied by specific gas conductance of each gas (θCO, θNO). θCO signifies the diffusive process across erythrocyte membrane and its interior incorporated with the competitive, replacement reaction of CO with hemoglobin O2. Therefore, θCO changes significantly depending on surrounding PO2. On the other hand, θNO is not influence by chemical reaction with hemoglobin and is predominant by diffusion across erythrocytes, thus resulting in constant θNO [4.5 mL/min/mmHg/(mL×blood)[65,93]]. The pulmonary diffusing capacity for CO is primarily governed by both diffusion through alveolocapillary membrane and erythrocytes as well as reaction in erythrocytes (limitation by both diffusion and reaction), whereas the pulmonary diffusing capacity for NO is almost evenly prescribed by diffusion through alveolocapillary membrane and that inside erythrocytes (diffusion limitation only). Important message drawn from this analysis is that the pulmonary diffusing capacity for NO is evenly sensitive to morphological abnormality in alveolocapillary membrane as well as that in pulmonary microcirculation. On the other hand, the pulmonary diffusing capacity for CO is more sensitive to microcirculatory abnormality. Adopted from ref[65].
- Citation: Yamaguchi K, Tsuji T, Aoshiba K, Nakamura H, Abe S. Anatomical backgrounds on gas exchange parameters in the lung. World J Respirol 2019; 9(2): 8-29
- URL: https://www.wjgnet.com/2218-6255/full/v9/i2/8.htm
- DOI: https://dx.doi.org/10.5320/wjr.v9.i2.8


