©The Author(s) 2017.
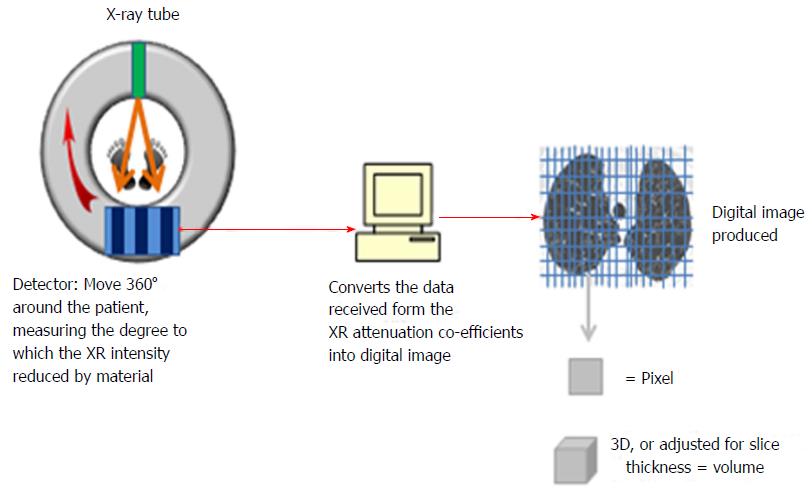
Figure 1 The process of computed tomography scanning.
X-rays are passed from the source through the subject laid on the table, and received by the detectors that rotate 360° around the patient. The reduction of the intensity of the XR beam passed through the subject is calculated as an attenuation co-efficient, which from all the slices is reformatted into a digital image.
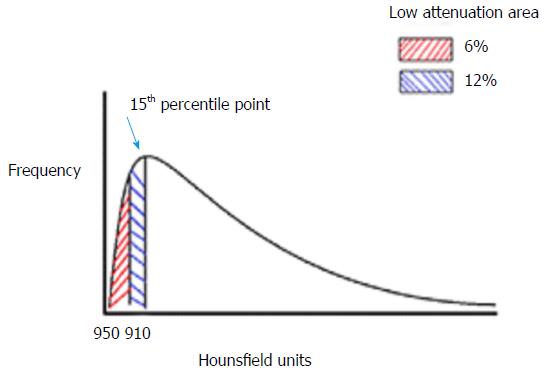
Figure 2 Calculation of densitometric indices.
Example of a density histogram, and how the area under the curve at a given threshold is calculated. In this figure, with a threshold of -910HU, 12% of the pixels are between -910 and -1000HU.
Figure 3 Airways disease measurements.
Diagram to demonstrate various values calculated in assessing either the luminal or wall contribution to airway thickening.
- Citation: Crossley D, Turner A, Subramanian D. Phenotyping emphysema and airways disease: Clinical value of quantitative radiological techniques. World J Respirol 2017; 7(1): 1-16
- URL: https://www.wjgnet.com/2218-6255/full/v7/i1/1.htm
- DOI: https://dx.doi.org/10.5320/wjr.v7.i1.1


