Copyright
©2013 Baishideng Publishing Group Co.
World J Respirol. Jul 28, 2013; 3(2): 20-28
Published online Jul 28, 2013. doi: 10.5320/wjr.v3.i2.20
Published online Jul 28, 2013. doi: 10.5320/wjr.v3.i2.20
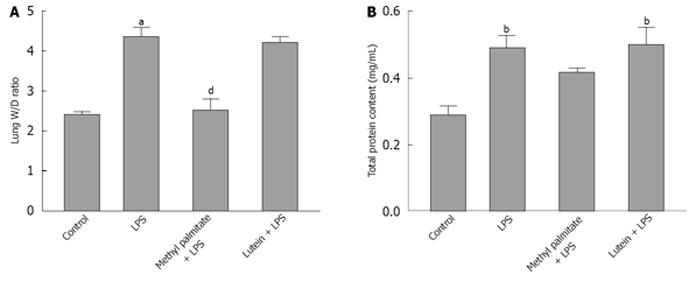
Figure 1 Effect of methyl palmitate and lutein on wet/dry ratio of the lung weight and total protein content in the bronchoalveolar lavage fluid of lipopolysaccharide-induced acute lung injury in rats.
aP < 0.05, bP < 0.01 vs the control group; dP < 0.01 vs the lipopolysaccharide (LPS) group (one way ANOVA followed by Tukey-Kramer’s multiple comparisons test). W/D: Wet/dry.
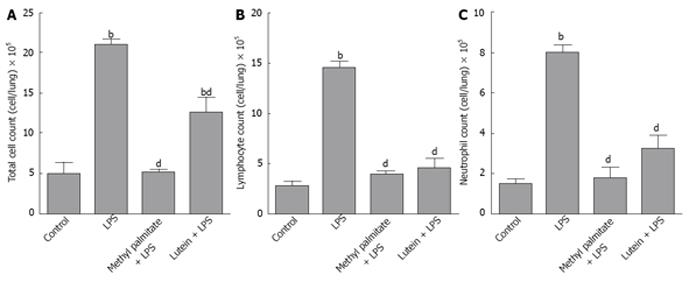
Figure 2 Effect of methyl palmitate and lutein on total and differential cell counts in the bronchoalveolar lavage fluid of lipopolysaccharide-induced acute lung injury in rats.
bP < 0.01 vs the control group; dP < 0.01 vs the lipopolysaccharide (LPS) group (one way ANOVA followed by Tukey-Kramer’s multiple comparisons test).
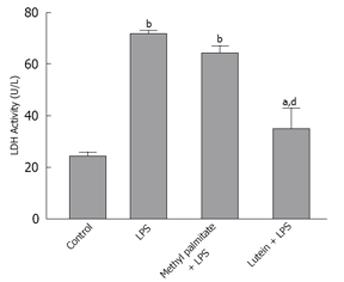
Figure 3 Effect of methyl palmitate and lutein on lactate dehydrogenase activity in the bronchoalveolar lavage fluid of lipopolysaccharide-induced acute lung injury in rats.
aP < 0.05, bP < 0.01 vs the control group; dP < 0.01 vs the lipopolysaccharide (LPS) group (one way ANOVA followed by Tukey-Kramer’s multiple comparisons test). LDH: Lactate dehydrogenase.
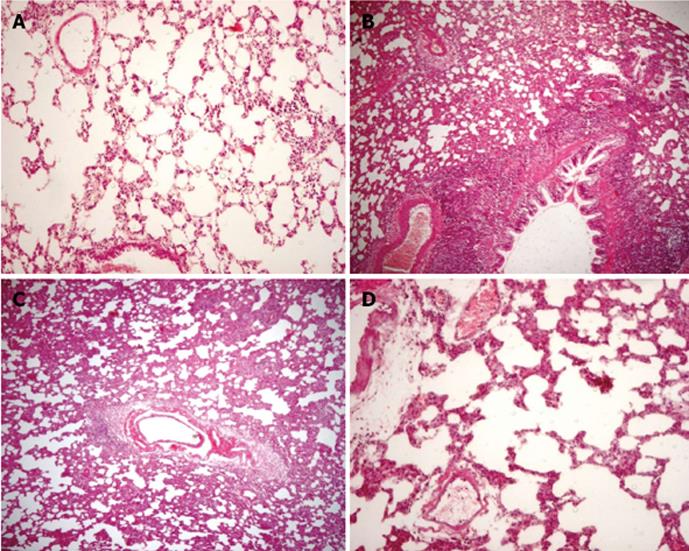
Figure 4 Effect of methyl palmitate and lutein on lung histopathological examination in lipopolysaccharide -induced acute lung injury in rats (HE, × 200).
A: Control, no inflammatory infiltrate, edema or fibrosis (score 0); B: Lipopolysaccharide (LPS), severe interstitial inflammation, peribronchial inflammation, fibrosis and edema (score 4); C: Methyl palmitate, mild interstitial inflammation, edema and peribronchial inflammation (score 2); D: Lutein, mild interstitial inflammation, edema and peribronchial inflammation (score 1).
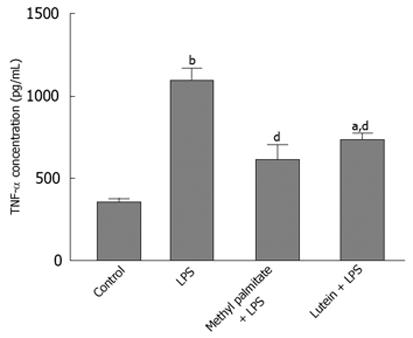
Figure 5 Effect of agmatine, methyl palmitate and lutein on tumor necrosis factor-α level in lung homogenate in lipopolysaccharide -induced acute lung injury in rats.
aP < 0.05, bP < 0.01, vs the control group; dP < 0.01 vs the lipopolysaccharide (LPS) group (one way ANOVA followed by Tukey-Kramer’s multiple comparisons test). TNF-α: Tumor necrosis factor-α.
- Citation: Ammar ESM, Sharawy MH, Shalaby AA, El-Agamy DS. Effects of methyl palmitate and lutein on LPS-induced acute lung injury in rats. World J Respirol 2013; 3(2): 20-28
- URL: https://www.wjgnet.com/2218-6255/full/v3/i2/20.htm
- DOI: https://dx.doi.org/10.5320/wjr.v3.i2.20


