Copyright
©The Author(s) 2025.
World J Ophthalmol. Jun 18, 2025; 9(1): 105857
Published online Jun 18, 2025. doi: 10.5318/wjo.v9.i1.105857
Published online Jun 18, 2025. doi: 10.5318/wjo.v9.i1.105857
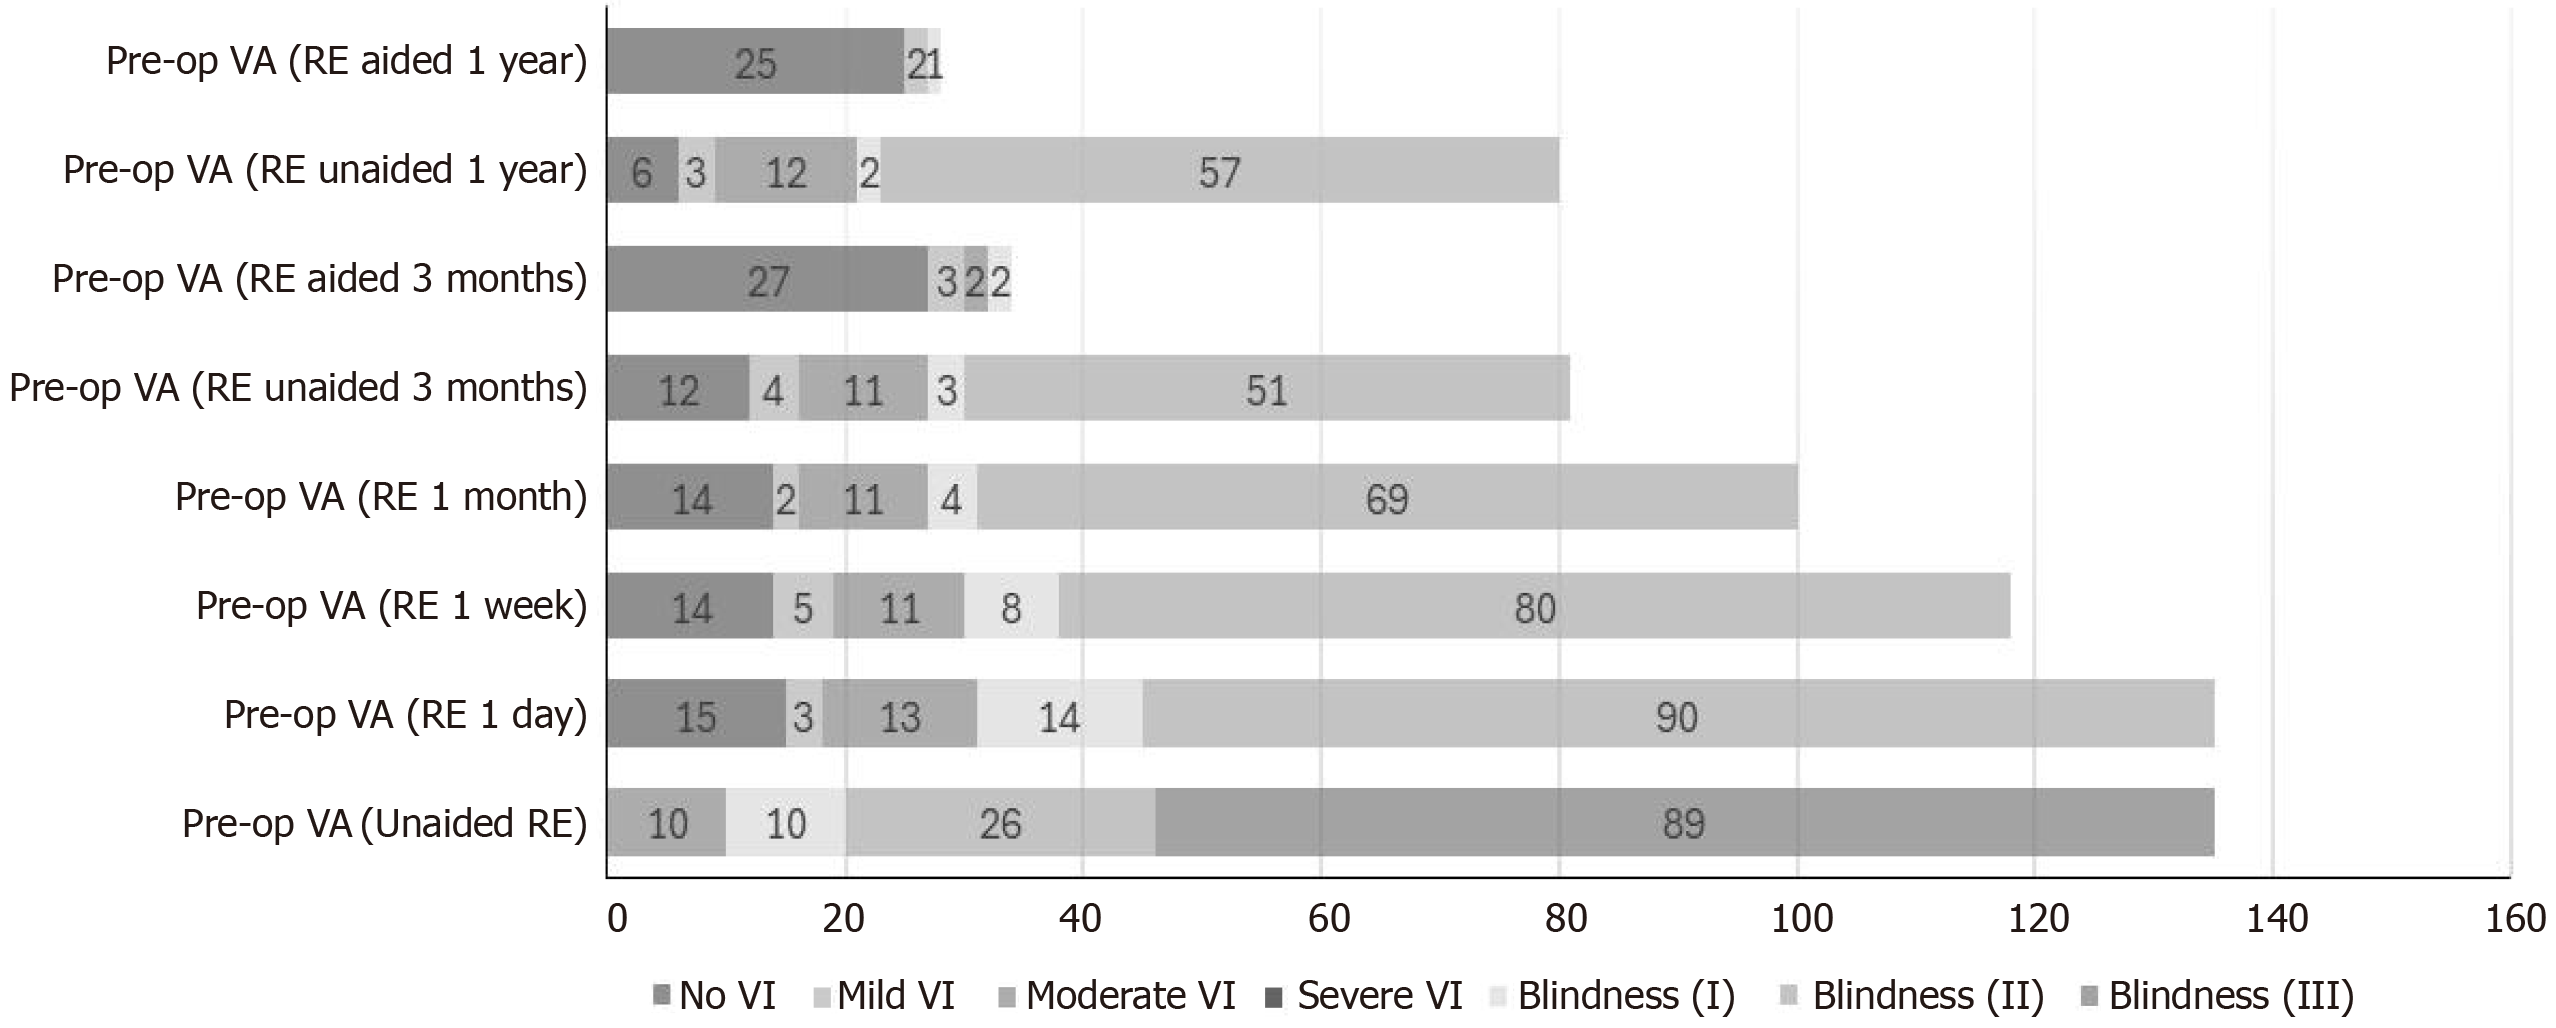
Figure 1 A graph showing the pattern of the preoperative and postoperative visual acuity of the right eye.
VI: Visual impairment; Pre-op VA: Preoperative visual acuity; Post-op VA: Postoperative visual acuity; RE: Right eye.
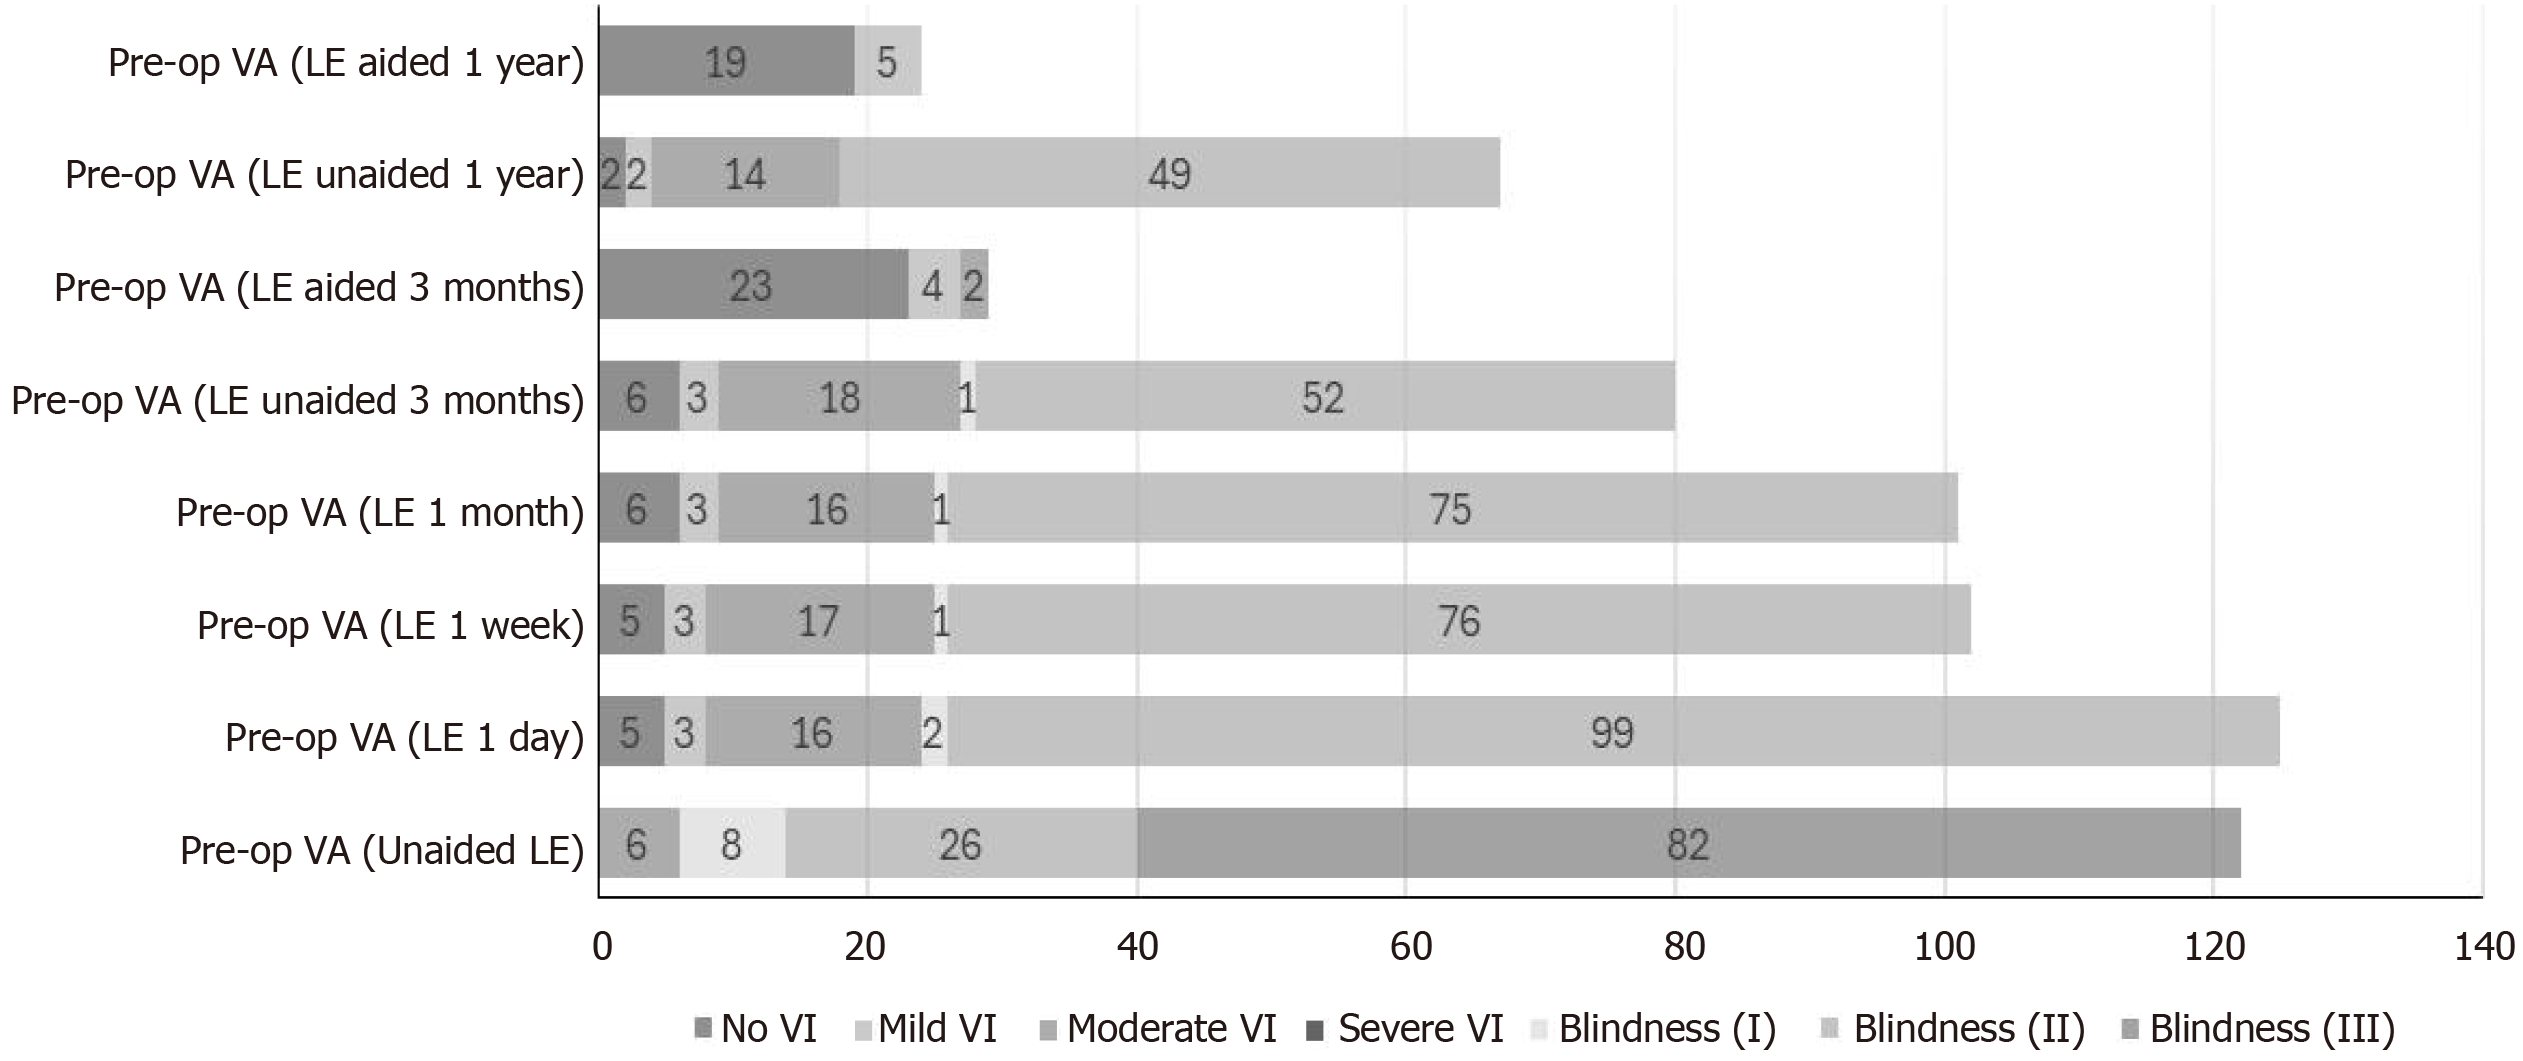
Figure 2 A graph showing the pattern of the preoperative and postoperative visual acuity of the left eye.
VI: Visual impairment; Pre-op VA: Preoperative visual acuity; Post-op VA: Postoperative visual acuity; LE: Left eye.
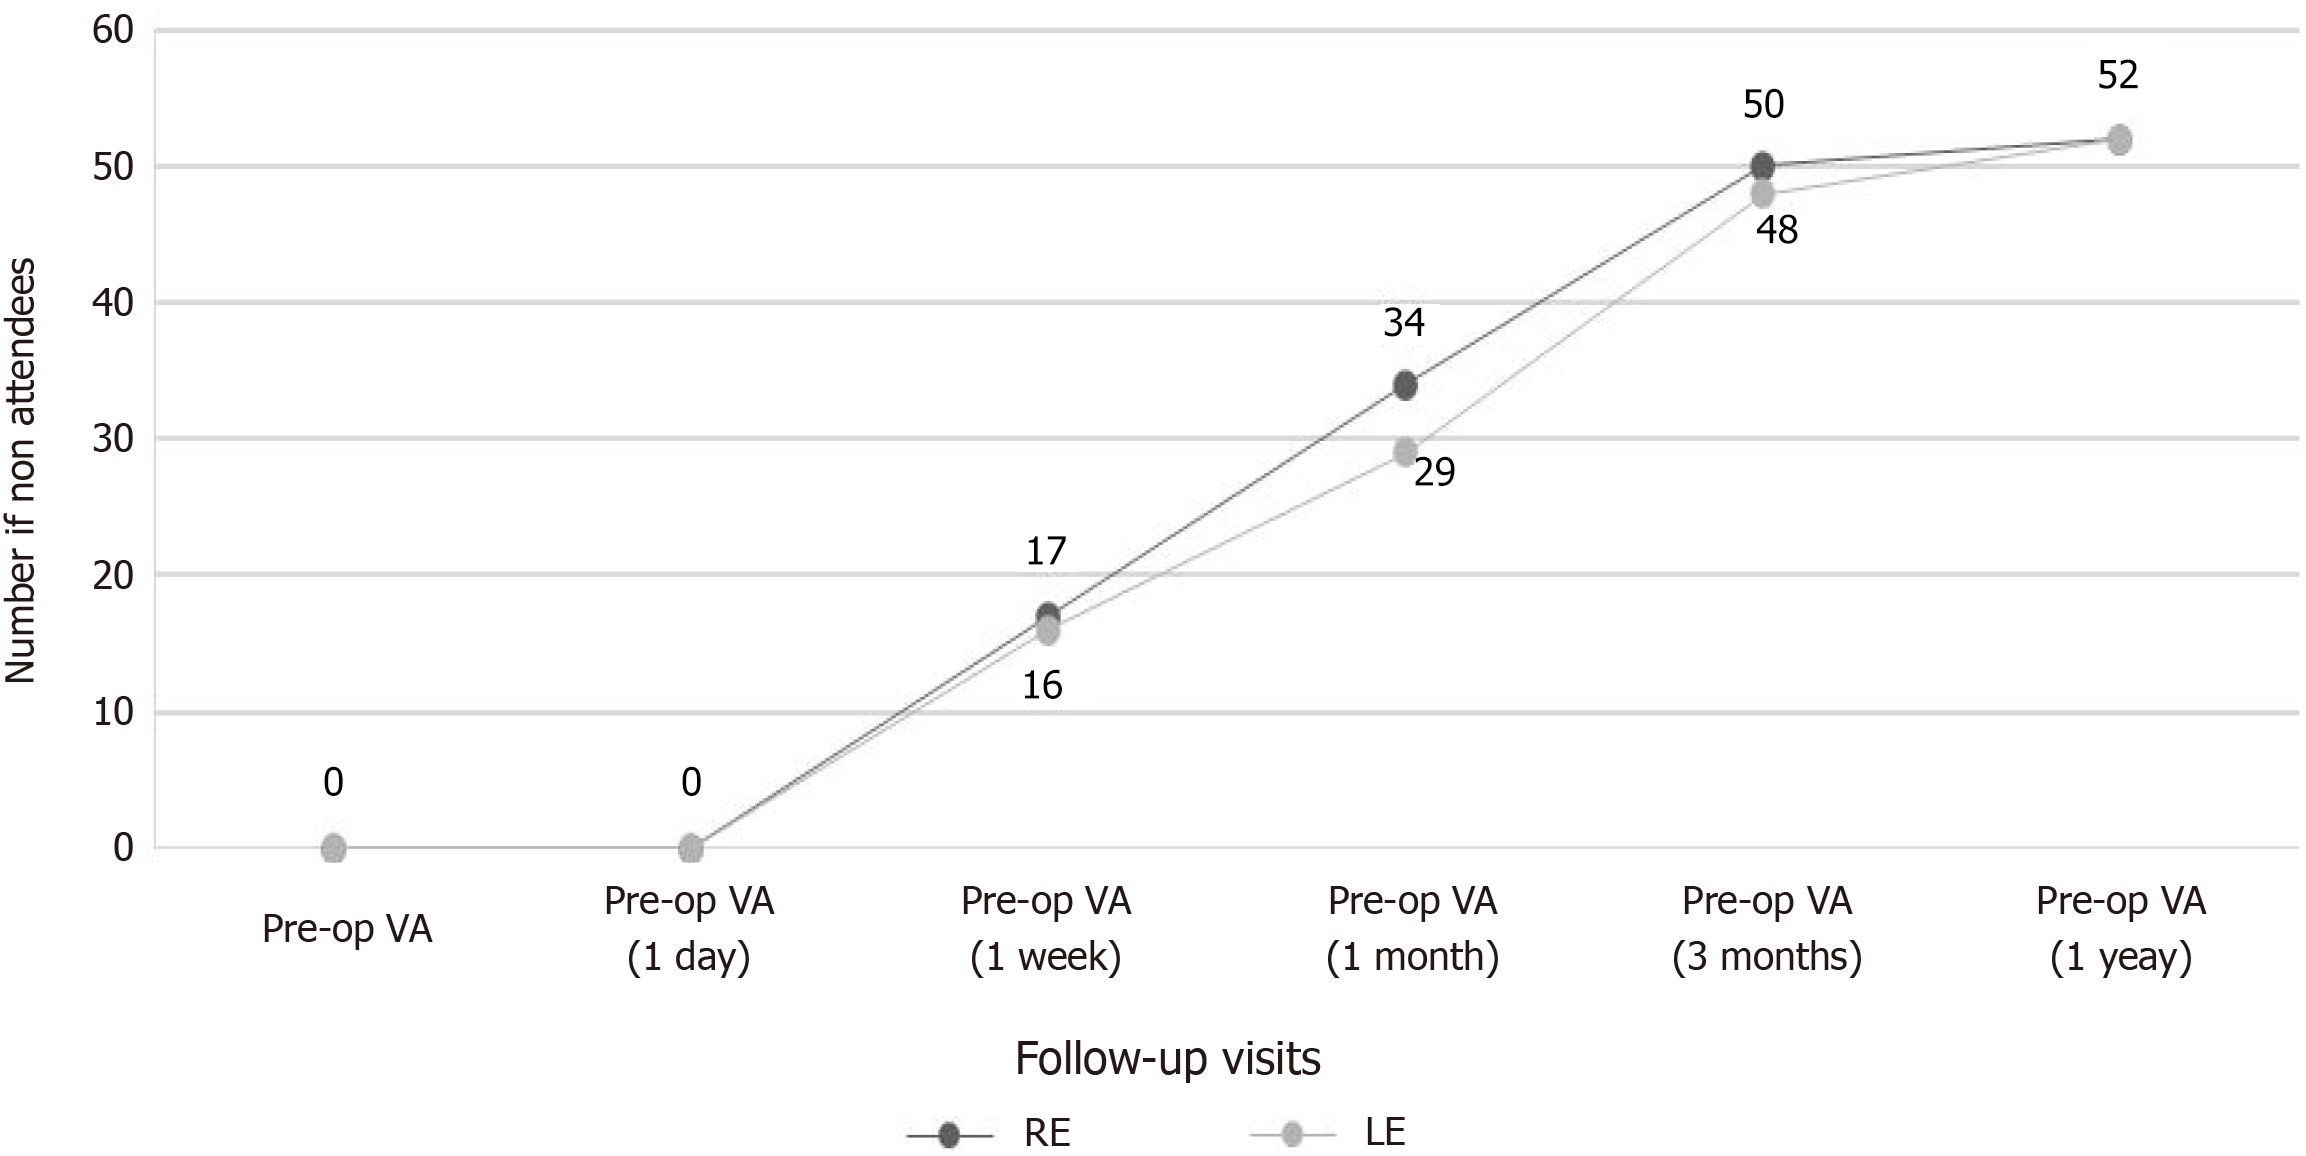
Figure 3 A line graph showing the loss of follow-up visits.
RE: Right eye; LE: Left eye; Pre-op VA: Preoperative visual acuity; Post-op VA: Postoperative visual acuity.
- Citation: Amematekpor LD, Amankwaa-Frempong D, Owusu E. Visual outcomes following pediatric cataract surgery at Komfo Anokye Teaching Hospital in Ghana. World J Ophthalmol 2025; 9(1): 105857
- URL: https://www.wjgnet.com/2218-6239/full/v9/i1/105857.htm
- DOI: https://dx.doi.org/10.5318/wjo.v9.i1.105857


