Copyright
©The Author(s) 2016.
World J Orthop. Jul 18, 2016; 7(7): 406-417
Published online Jul 18, 2016. doi: 10.5312/wjo.v7.i7.406
Published online Jul 18, 2016. doi: 10.5312/wjo.v7.i7.406
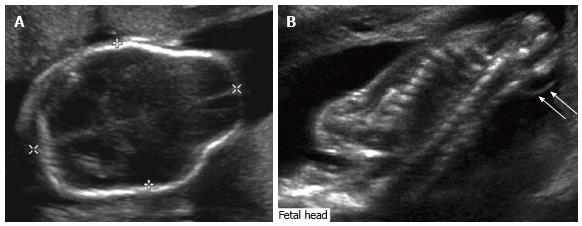
Figure 1 Fetal ultrasound.
Grayscale ultrasound images of the fetal head (A) and spine (B) demonstrate ventriculomegaly as well as a lemon-shaped configuration of the fetal head due to bifrontal concavity, typical of Chiari II malformation. There is an associated myelomeningocele (arrows).
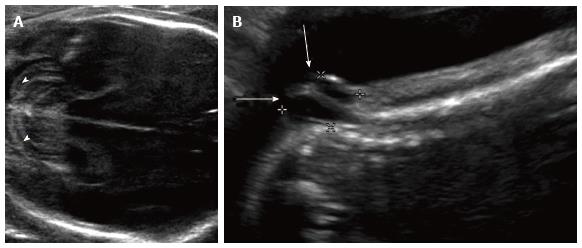
Figure 2 Chiari ultrasound.
Grayscale ultrasound images of the 23 wk fetal head (A) and spine (B) demonstrate curved, “banana-shaped” appearance of the fetal cerebellum (arrowheads) typical of Chiari II malformation, as well as associated lower sacral myelomeningocele (arrows).
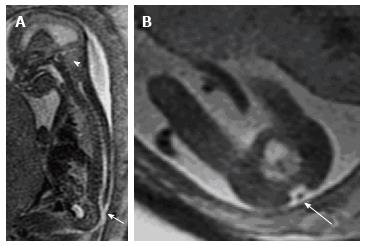
Figure 3 Fetal magnetic resonance imaging.
A: Sagittal T2 weighted fetal MR demonstrates a small posterior fossa (arrowhead) with crowding of the cerebellar tonsils and hindbrain; B: Evaluation of the spine demonstrated a lumbosacral myelomeningocele.
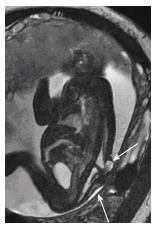
Figure 4 Myelomeningocele magnetic resonance - T2 weighted magnetic resonance image of a 26 wk fetus demonstrates a large thoracolumbar myelomeningocele (arrows) covered by skin.
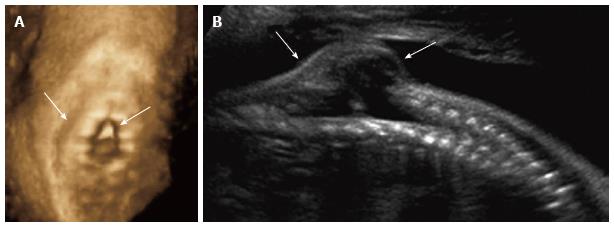
Figure 5 Spinal dysraphism ultrasound.
Coronal 3D (A) and sagittal 2D (B) ultrasound images of the 26 wk fetal spine demonstrate dysraphism of the thoracolumbar junction (arrows), in the region of known myelomeningocele.
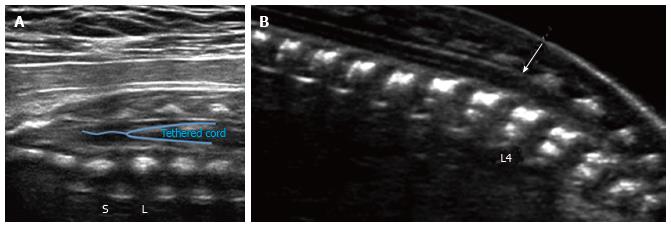
Figure 6 Spinal tether ultrasound.
Grayscale ultrasound image (A) of the lumbosacral spine in a 29 wk fetus demonstrates a low-lying conus medullaris, extending below the lumbosacral junction (L/S). No evidence of associated fatty filum terminale was seen in this case; B: Grayscale ultrasound image of the lumbosacral spine in a 21 wk fetus demonstrates a low-lying conus medullaris (arrow), extending below the inferior endplate of L3. No evidence of associated fatty filum terminale was seen in this case.
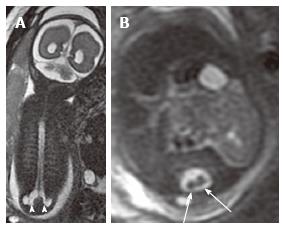
Figure 7 Lumbosacral myelomeningocele.
Coronal (A) and axial (B) T2 weighted magnetic resonance images of a 26 wk fetus demonstrate complex spinal anomalies with a lumbosacral myelomeningocele (arrowheads) and diastematomyelia (arrows).
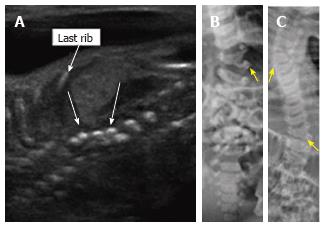
Figure 8 Thoracic hemivertebrae.
Parasagittal grayscale ultrasound image (A) of a 20 wk fetus acquired with a high frequency linear transducer demonstrate unpaired echogenic structures at the thoracolumbar junction representing hemivertebrae (arrows). Postnatal frontal radiographs of the same patient’s spine at 0 d (B) and 3 years of age (C) demonstrate left thoracolumbar and right midthoracic hemivertebrae.
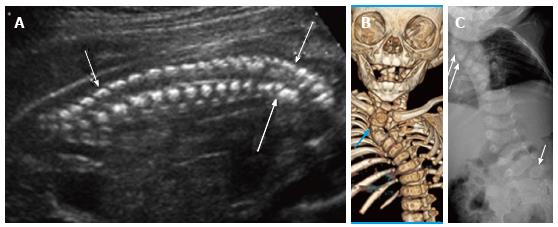
Figure 9 Cervicothoracic Hemivertebrae.
Grayscale ultrasound image (A) of a 21 wk fetus demonstrate multiple hemivertebrae (arrows) and cervicothoracic kyphosis. Six months postnatal multidetector unenhanced computed tomography of the thorax with volume rendering (B) as well as frontal radiograph of the spine (C) demonstrate multiple vertebral segmentation anomalies, including right upper thoracic and left lumbosacral hemivertebrae (arrows), resulting in congenital cervicothoracic dextroscoliosis.
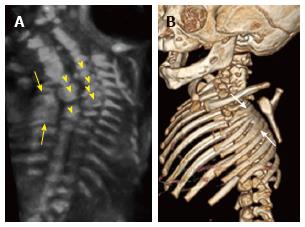
Figure 10 Rib fusions.
Grayscale 3D ultrasound image (A) of a 21 wk fetus demonstrate fusion of multiple left sided ribs (arrows) as well as multiple segmentation anomalies (arrowheads) resulting in congenital cervicothoracic kyphoscoliosis. Postnatal multidetector unenhanced computed tomography (B) of the thorax with volume rendering demonstrates bony fusion of multiple left sided ribs (arrows) as well as multiple segmentation anomalies and cervicothoracic dextroscoliosis.
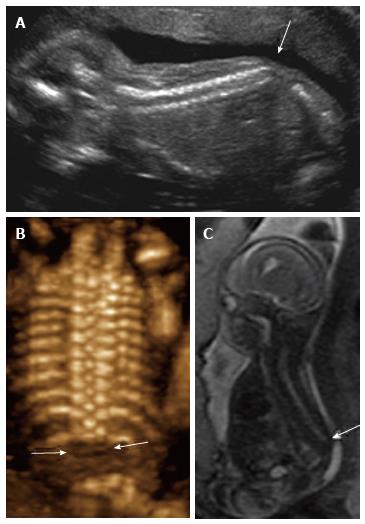
Figure 11 Sacral agenesis.
2D sagittal grayscale ultrasound (A), coronal 3D ultrasound (B), and parasagittal T1 weighted image (C) of a 19 wk fetus demonstrate absence of the fetal spine caudal to T12 (arrows), consistent with sacral agenesis/caudal regression syndrome. The mother was known to have type 1 diabetes, a risk factor for this condition.
- Citation: Upasani VV, Ketwaroo PD, Estroff JA, Warf BC, Emans JB, Glotzbecker MP. Prenatal diagnosis and assessment of congenital spinal anomalies: Review for prenatal counseling. World J Orthop 2016; 7(7): 406-417
- URL: https://www.wjgnet.com/2218-5836/full/v7/i7/406.htm
- DOI: https://dx.doi.org/10.5312/wjo.v7.i7.406


