Copyright
©2013 Baishideng Publishing Group Co.
World J Orthop. Jul 18, 2013; 4(3): 157-160
Published online Jul 18, 2013. doi: 10.5312/wjo.v4.i3.157
Published online Jul 18, 2013. doi: 10.5312/wjo.v4.i3.157
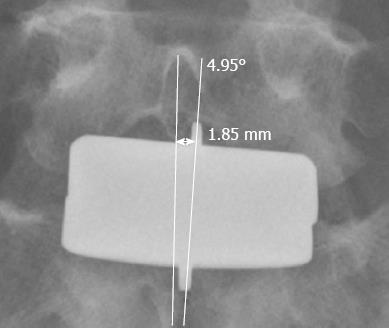
Figure 1 In the anteroposterior view, the superior endplate of the implant deviated 1.
85 mm to the left of midline with 4.95° angular displacement.
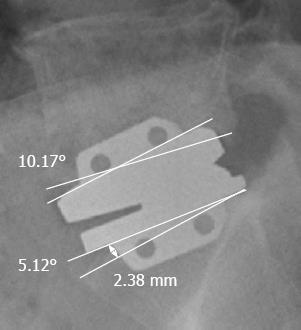
Figure 2 In the lateral view, angular gaps of 10.
17° and 5.12° existed between the upper and lower implant endplates, respectively, and 2.38 mm of the lower anterior vertical keel did not insert completely into the S1 upper endplate.
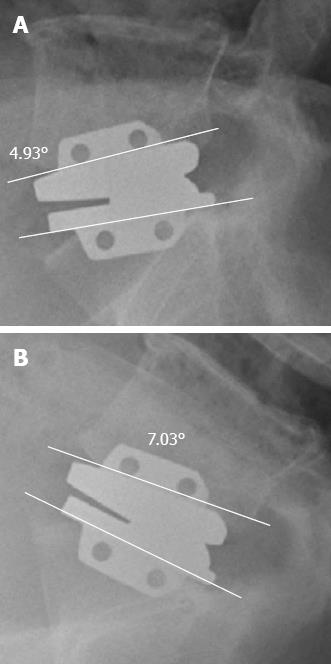
Figure 3 One month after the operation, range of motion of the implant was checked 2.
1° (Left: Extension; Right: Flexion).
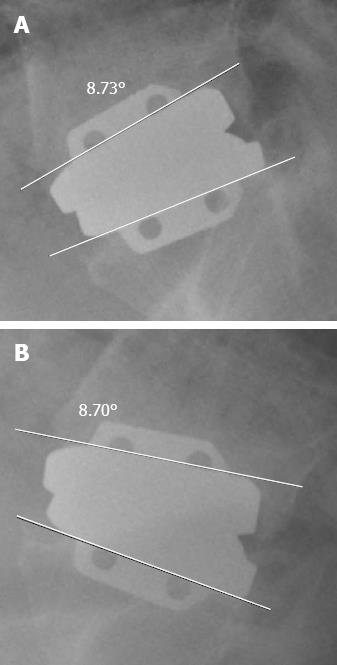
Figure 4 Two years after the operation, radiograph (Above: Extension; Beow: Flexion) shows range of motion of the implant was almost 0°.
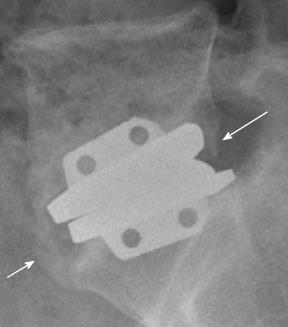
Figure 5 Three years after the operation, calcified spurs (heterotopic ossification) were identified (arrow) at the anterior and posterior margin of the implant.
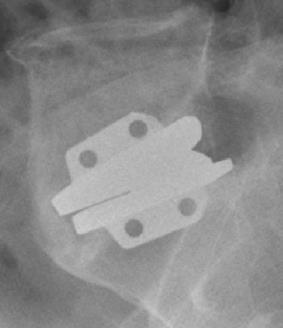
Figure 6 At the last follow-up (5 years), more prominent bony masses were identified and the L5-S1 segment was fused completely.
- Citation: Jang SH, Lee HY, Cho JY, Lee SH. Solid fusion after lumbosacral arthroplasty. World J Orthop 2013; 4(3): 157-160
- URL: https://www.wjgnet.com/2218-5836/full/v4/i3/157.htm
- DOI: https://dx.doi.org/10.5312/wjo.v4.i3.157


